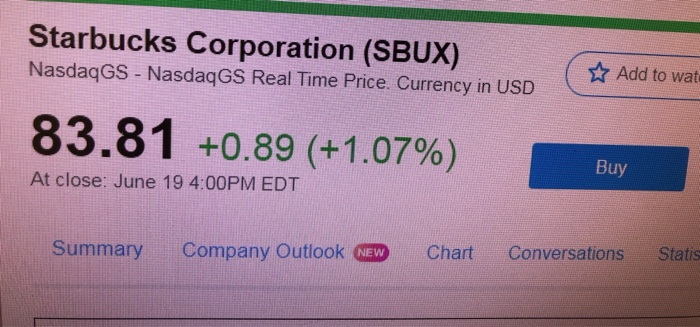
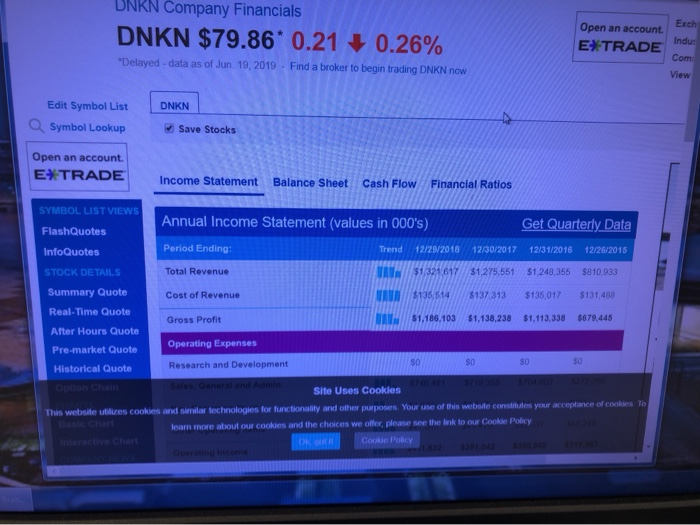
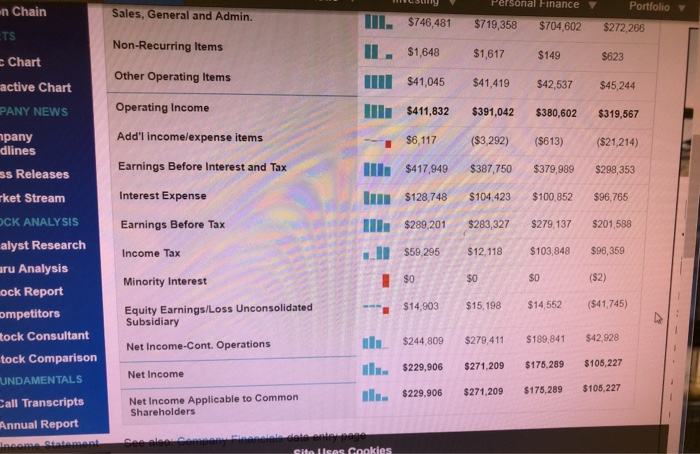
Ratio analysis of dunkin donuts vs starbucks 2017, 2018
Ratio Analysis
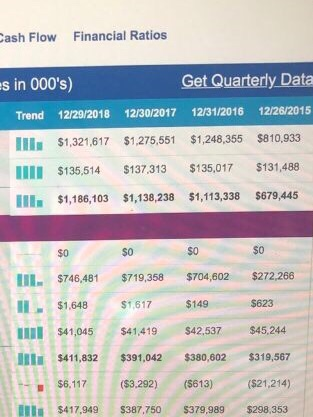
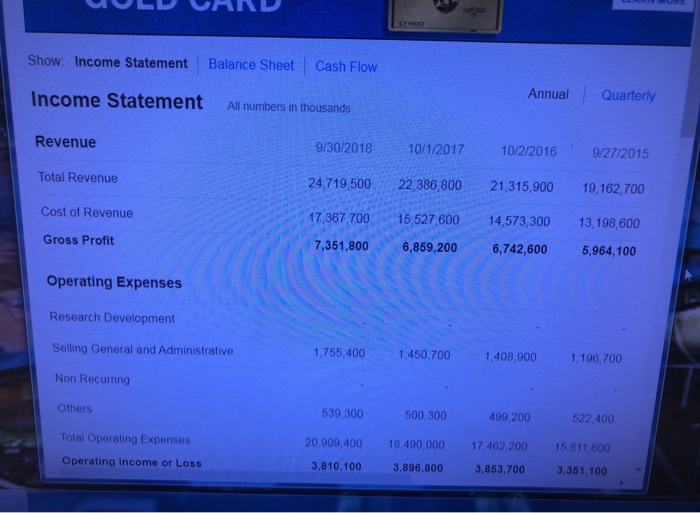
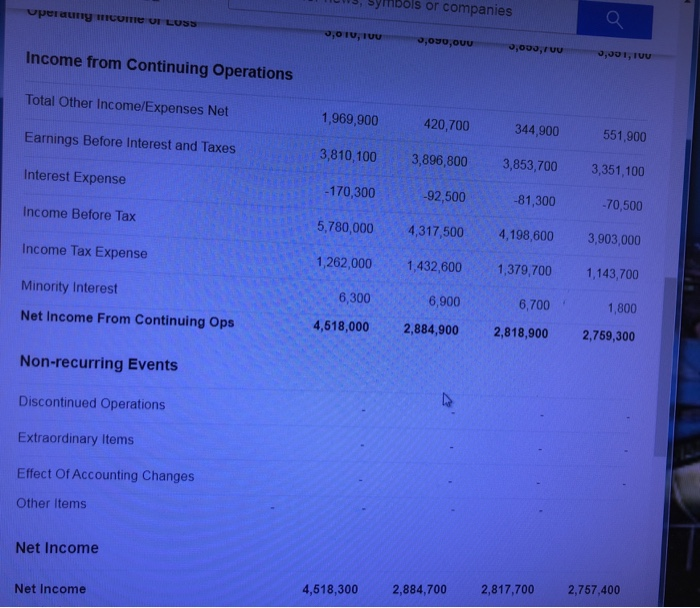
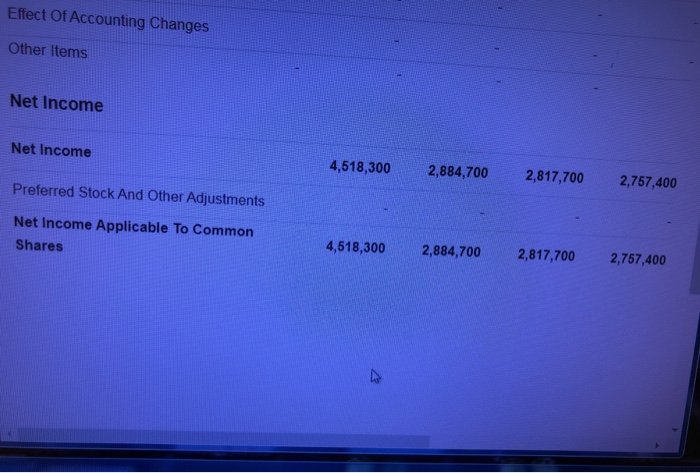
complete ratio for both companies curent ratio cash acid. test ratio inventory turover . Ratio day sales in inventory in receivables gross profit percentage.
Cash Flow Financial Ratios Get Quarterly Data s in 000's) Trend 12/29/2018 12/30/2017 12/31/2016 12/26/2015 Ill$1,321,617 $1275,551 $1,248,355 $810,933 $131,488 $135,017 $135,514 $137.313 Hll$1,186,103 $1,138,238 $1,113,338 $679,445 $0 S0 $0 $272,266 $719,358 $704,602 II $746,481 $623 $1,617 $149 $1,648 $45,244 $41,419 $42,537 $41,045 $411,832 $380,602 $319,567 $391,042 ($613) ($21,214) $6.117 ($3,292) $417,949 $387,750 $379,989 $298,353 CFOST Show Income Statement Balance Sheet Cash Flow Annual Quarterly Income Statement All numbers in thousands Revenue 9/30/2018 10/1/2017 10/2/2016 9/27/2015 Total Revenue 22,386 800 24,719,500 21,315,900 19,162,700 Cost of Revenue 17,367,700 15,527,600 14,573,300 13,198,600 Gross Profit 7,351,800 6,859,200 6,742,600 5,964,100 Operating Expenses Research Development Selling General and Administrative 1,755,400 1,450,700 1,408,900 1,196,700 Non Recurring Others 539,300 500,300 499 200 522,400 Total Operating Expenses 20,909,400 18,490,000 17.462.200 15,811 600 Operating Income or Loss 3,810,100 3.896.800 3,853,700 3,351,100 bols or companies Operauny mcome OI LOSS 9,000,ruu nniinio'e nno oco'e 0,001,IUu Income from Continuing Operations Total Other Income/Expenses Net 1,969,900 420,700 344,900 551,900 Earnings Before Interest and Taxes 3,810,100 3,896,800 3,853,700 3,351,100 Interest Expense -170,300 -92,500 -81,300 -70,500 Income Before Tax 5,780,000 4,317,500 4,198,600 3,903,000 Income Tax Expense 1,262,000 1,432,600 1,379,700 1,143,700 Minority Interest 6,300 6,900 6,700 1,800 Net Income From Continuing Ops 4,518,000 2,884,900 2,818,900 2,769,300 Non-recurring Events Discontinued Operations Extraordinary Items Effect Of Accounting Changes Other Items Net Income 2,757,400 2,817,700 2,884,700 4,518,300 Net Income Effect Of Accounting Changes Other Items Net Income Net Income 4,518,300 2,884,700 2,817,700 2,757,400 Preferred Stock And Other Adjustments Net Income Applicable To Common 4,618,300 2,817,700 2,884,700 2,757,400 Shares Starbucks Corporation (SBUX) Add to wat NasdaqGS NasdaqGS Real Time Price. Currency in USD 83.81 +0.89 (+1.07%) Buy At close: June 19 4:00PM EDT Conversations Statis Chart Company Outlook NEW Summary DNKN Company Financials Exch Open an account DNKN $79.86 0.21 0.26% Indu EXTRADE Com Delayed- data as of Jun. 19, 2019 Find a broker to begin trading DNKN now View Edit Symbol List DNKN Q Symbol L0okup Save Stocks Open an account. E*TRADE Income Statement Balance Sheet Cash Flow Financial Ratios SYMBOL LIST VIEWS Annual Income Statement (values in 000's) Get Quarterly Data FlashQuotes Period Ending: 12/28/2018 Trend 12/30/2017 12/31/2016 12/26/2015 InfoQuotes $1,248,355 Total Revenue $1/321 617 $1,275,551 $810,933 STOCK DETAILS Summary Quote Cost of Revenue $135,514 $137 313 $135,017 $131,488 Real-Time Quote $1.186,103 $1.138,238 $1.113,338 $679,445 Gross Profit After Hours Quote Operating Expenses Pre-market Quote $0 S0 Research and Development Historical Quote 719 384 $704 0 o:481 Option Chain Sales General and Admin Site Uses Cookles This website utilizes cookies and similar technologies for functionality and other purposes Your use of this website constitutes your acceptance of cookies To Basic Chart learn more about our cookies and the choices we offer, please see the link to our Cookie Policy Gookie Poicy Interactive Chart 832 301 04 300 0 Operating Income Personal Finance Portfolio n Chain TS Sales, General and Admin. II. $746,481 $719,358 $704,602 $272,266 Non-Recurring Items $1,648 $1,617 $149 $623 Chart Other Operating Items II $41,045 $41,419 $42,537 $45,244 active Chart Operating Income PANY NEWS ll$411,832 $391,042 $380,602 $319,567 pany dlines Add'l income/expense items $6,117 ($3,292) ($613) ($21,214) Earnings Before Interest and Tax l $417,949 $387,750 $379,989 $298,353 ss Releases Interest Expense $104,423 $100,852 $96.765 $128,748 rket Stream CK ANALYSIS l $289,201 $201,588 Earnings Before Tax $283,327 $279,137 alyst Research $96,359 $12.118 $103,848 $59,295 Income Tax aru Analysis ock Report ompetitors ($2) $0 $0 $0 Minority Interest $14,552 ($41,745) Equity Earnings/Loss Unconsolidated Subsidiary $14,903 $15,198 tock Consultant $42,928 $279,411 $189,841 i $244,809 Net Income-Cont. Operations tock Comparison $175,289 $105,227 $271,209 i $229,906 Net Income UNDAMENTALS $105,227 $175,289 ill $229,906 $271,209 Net Income Applicable to Common Shareholders Call Transcripts Annual Report See aleet Cem lnceme Statement. Site Uses Cookies