Ratio analysis of financial performance and financial position of JBHIFI company in fiscal year 2021
1. Report on three financial performance and efficiency ratios 2. Report three financial position ratios (financial structure and liquidity) 3. Annual data by June 31, 2021, or why they decided not to do it 4. Typical explanation and integration of the company's financial situation, including reference to loan decision-making.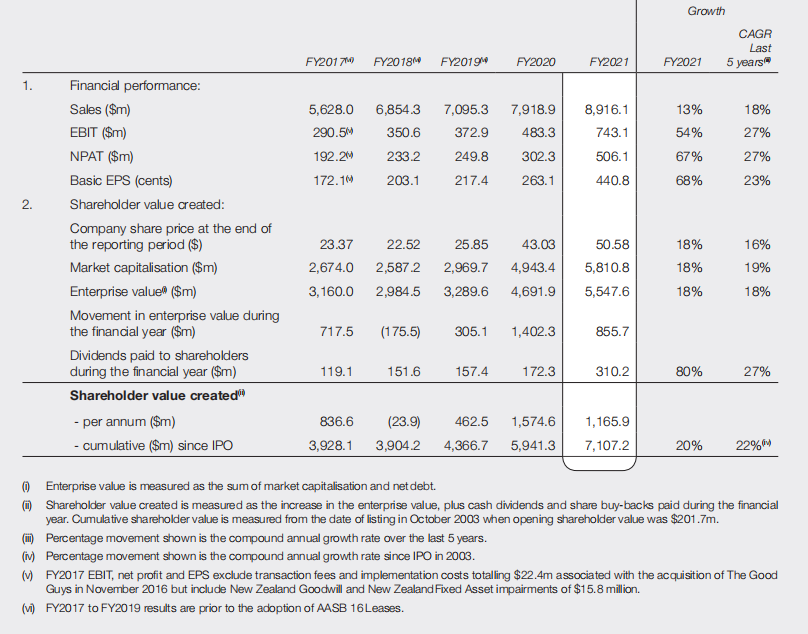
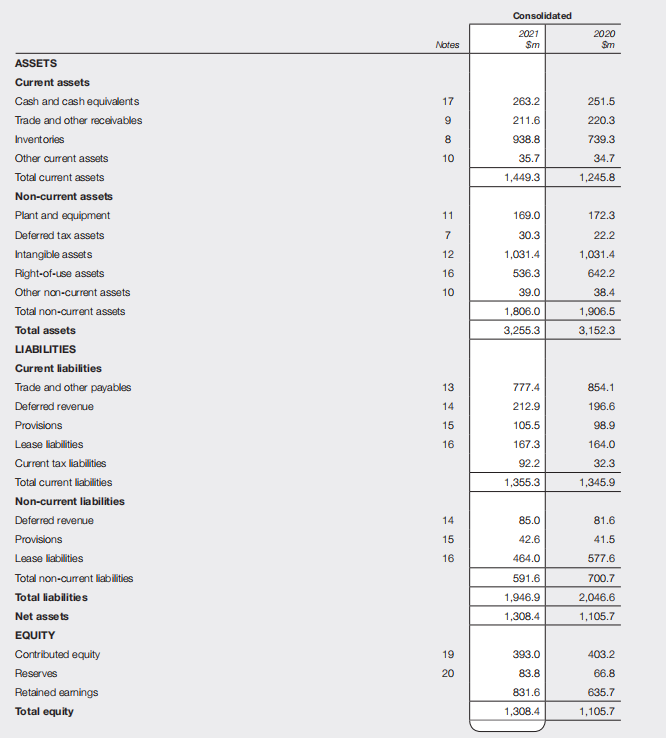
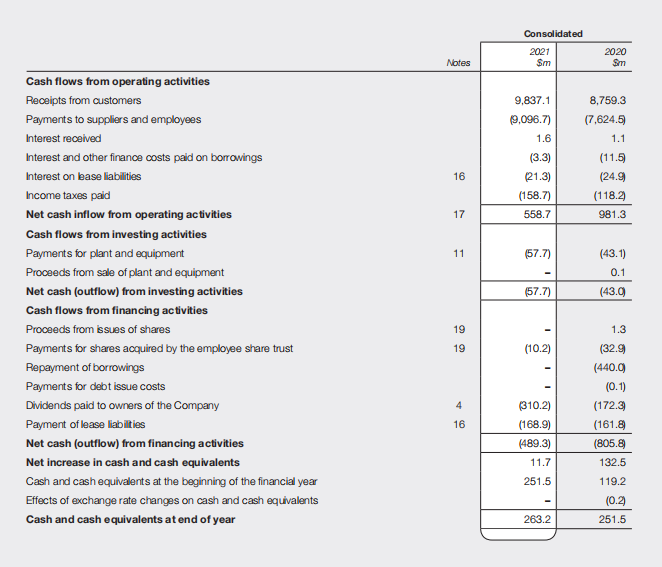
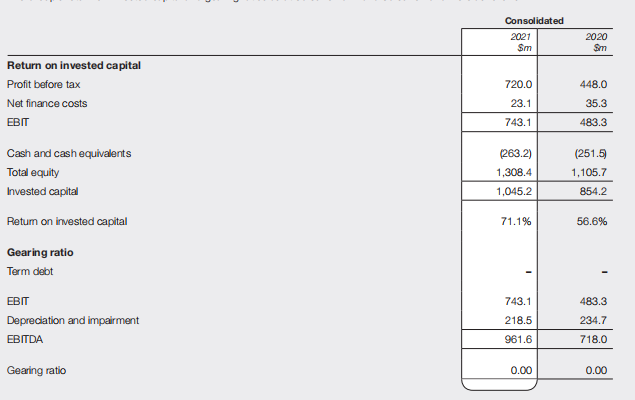
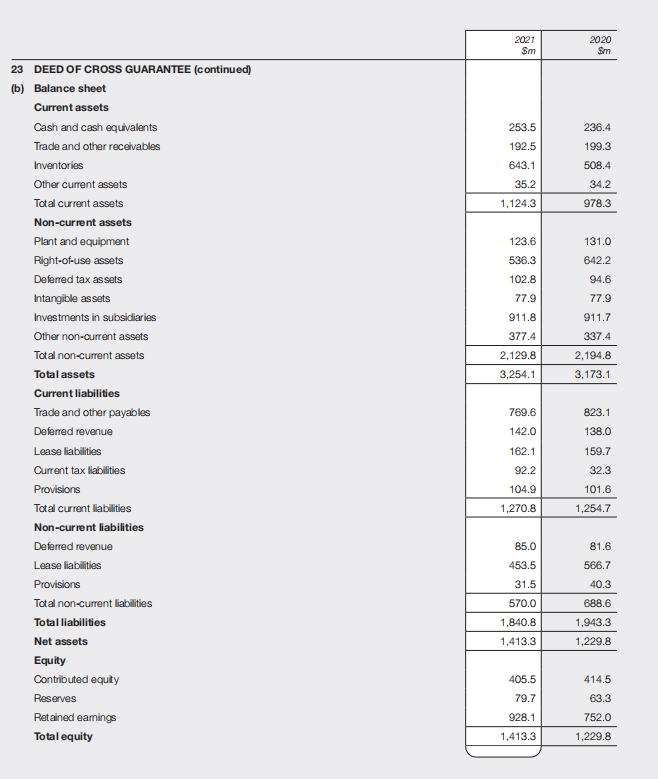
Growth CAGR Last FY2021 5 years FY2017100 FY201810 FY2019 FY2020 FY2021 1. 18% 27% 5,628.0 290.5 192.2M 172.1 6,854.3 350.6 233.2 203.1 7,095.3 372.9 249.8 217.4 7,918.9 483.3 302.3 263.1 8,916.1 743.1 506.1 440.8 13% 54% 67% 68% 27% 23% 2. Financial performance: Sales ($m) EBIT ($m) NPAT ($m) Basic EPS (cents) Shareholder value created: Company share price at the end of the reporting period ($) Market capitalisation ($m) Enterprise value ($m) Movement in enterprise value during the financial year ($m) Dividends paid to shareholders during the financial year ($m) Shareholder value created - per annum ($m) - cumulative ($m) since IPO 23.37 2,674.0 3,160.0 22.52 2,5872 2,984.5 25.85 2,969.7 3,289.6 43.03 4,943.4 4,691.9 50.58 5,810.8 5,547.6 18% 18% 16% 19% 18% 18% 717.5 (175.5) 305.1 1,402.3 855.7 119.1 151.6 157.4 172.3 310.2 80% 27% 836.6 462.5 (23.9) 3,9042 1,574.6 5,941.3 1,165.9 7,107.2 3,928.1 4,366.7 20% 22% 0 Enterprise value is measured as the sum of market capitalisation and net debt. Shareholder value created is measured as the increase in the enterprise value, plus cash dividends and share buy-backs paid during the financial year. Cumulative shareholder value is measured from the date of listing in October 2003 when opening shareholder value was $201.7m. m Percentage movement shown is the compound annual growth rate over the last 5 years. (M) Percentage movement shown is the compound annual growth rate since IPO in 2003. (FY2017 EBIT, net profit and EPS exclude transaction fees and implementation costs totalling $22.4m associated with the acquisition of The Good Guys in November 2016 but include New Zealand Goodwill and New Zealand Fixed Asset impairments of $15.8 million. (1) FY2017 to FY2019 results are prior to the adoption of AASB 16Leases. Consolidated 2021 Sm 2020 Sm Notes 17 263.2 251.5 9 211.6 938.8 220.3 739.3 8 10 35.7 34.7 1,449.3 1,245.8 11 169.0 172.3 7 30.3 22.2 12 1,031.4 1,031.4 16 536.3 642.2 10 39.0 38.4 1,806.0 3,255.3 1,906.5 3,152.3 ASSETS Current assets Cash and cash equivalents Trade and other receivables Inventories Other current assets Total current assets Non-current assets Plant and equipment Deferred tax assets Intangible assets Right-of-use assets Other non-current assets Total non-current assets Total assets LIABILITIES Current liabilities Trade and other payables Deferred revenue Provisions Lease liabilities Current tax liabilities Total current liabilities Non-current liabilities Deferred revenue Provisions Lease liabilities Total non-current liabilities Total liabilities Net assets EQUITY Contributed equity Reserves Retained eamings Total equity 13 777.4 14 854.1 196.6 98.9 212.9 105.5 167.3 15 16 164.0 92.2 32.3 1,355.3 1,345.9 14 85.0 81.6 41.5 15 42.6 16 464.0 577.6 591.6 700.7 1,946.9 1,308.4 2,046.6 1,105.7 19 393.0 403.2 66.8 20 83.8 831.6 635.7 1,105.7 1,308.4 Consolidated 2021 Sm 2020 Sm Notes 9,837.1 9,096.7) 1.6 (3.3) 8,759.3 (7,624.5 1.1 (11.5 (24.9 (118.2 981.3 16 21.3) (158.7) 558.7 17 11 67.7) (43.1) 0.1 (43.9 57.7) Cash flows from operating activities Receipts from customers Payments to suppliers and employees Interest received Interest and other finance costs paid on borrowings Interest on base liabilities Income taxes paid Net cash inflow from operating activities Cash flows from investing activities Payments for plant and equipment Proceeds from sale of plant and equipment Net cash (outflow) from investing activities Cash flows from financing activities Proceeds from issues of shares Payments for shares acquired by the employee share trust Repayment of borrowings Payments for debt issue costs Dividends paid to owners of the Company Payment of lease liabilities Net cash (outflow) from financing activities Net increase in cash and cash equivalents Cash and cash equivalents at the beginning of the financial year Effects of exchange rate changes on cash and cash equivalents Cash and cash equivalents at end of year 19 1.3 19 (10.2) 4 (32.9 (440.0 (0.1) (172.3 (161.8 (805.8) 132.5 (310.2) (168.9) (489.3) 11.7 16 251.5 119.2 (0.2 263.2 251.5 Consolidated 2021 Sm 2020 Sm 448.0 Return on invested capital Profit before tax Net finance costs EBIT 720.0 23.1 35.3 743.1 483.3 Cash and cash equivalents Total equity Invested capital (263.2) 1,308.4 1,045.2 (251.5 1,105.7 854.2 Retum on invested capital 71.1% 56.6% Gearing ratio Term debt EBIT Depreciation and impairment EBITDA 743.1 483.3 218.5 234.7 718.0 961.6 Gearing ratio 0.00 0.00 2021 Sm 2020 Sm 253.5 236.4 192.5 199.3 508.4 643.1 35.2 34.2 1,124.3 978.3 123.6 131.0 536.3 642.2 102.8 94.6 77.9 911.8 377.4 2,129.8 77.9 911.7 337.4 2,194.8 3,173.1 3,254.1 23 DEED OF CROSS GUARANTEE (continued) (b) Balance sheet Current assets Cash and cash equivalents Trade and other receivables Inventories Other current assets Total current assets Non-current assets Plant and equipment Right-of-use assets Deferred tax assets Intangible assets Investments in subsidiaries Other non-current assets Total non-current assets Total assets Current liabilities Trade and other payables Deferred revenue Lease liabilities Current tax liabilities Provisions Total current liabilities Non-current liabilities Deferred revenue Lease liabilities Provisions Total non-current liabilities Total liabilities Net assets Equity Contributed equity Reserves Retained eamings Total equity 769.6 823.1 142.0 138.0 162.1 159.7 92.2 32.3 104.9 101.6 1,270.8 1,254.7 85.0 81.6 453.5 31.5 566.7 40.3 688.6 570.0 1,840.8 1,943.3 1,229.8 1,413.3 405.5 414.5 63.3 79.7 928.1 752.0 1,229.8 1,413.3