Answered step by step
Verified Expert Solution
Question
1 Approved Answer
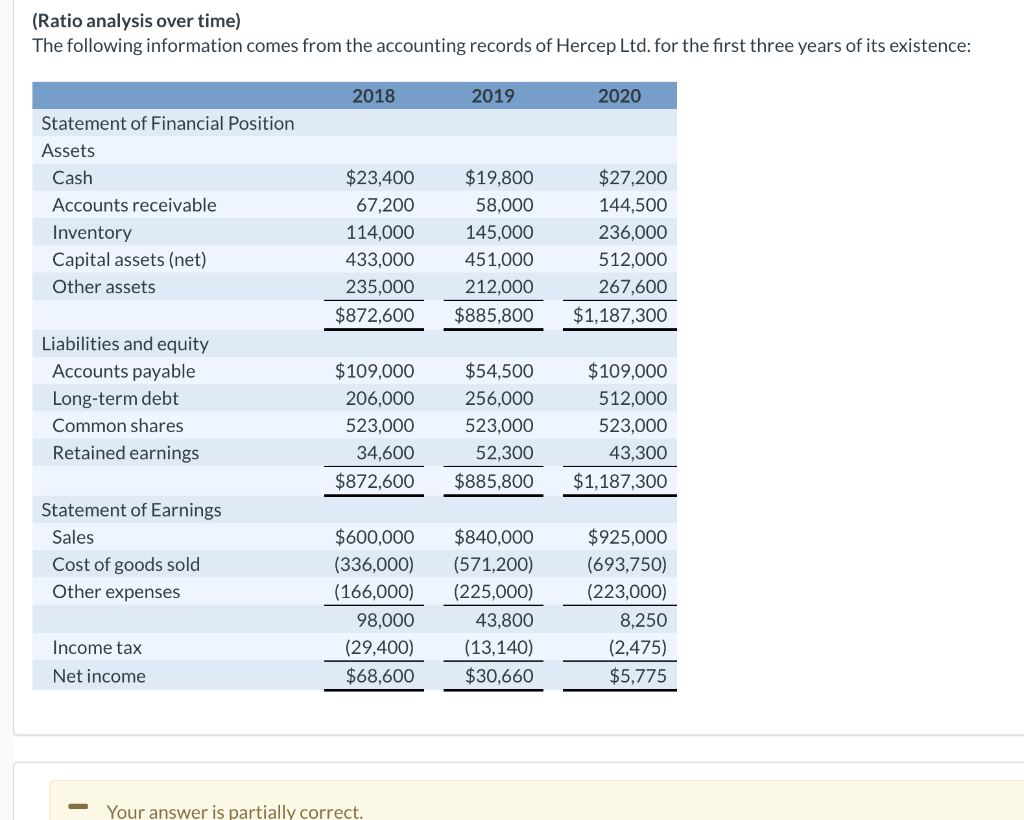
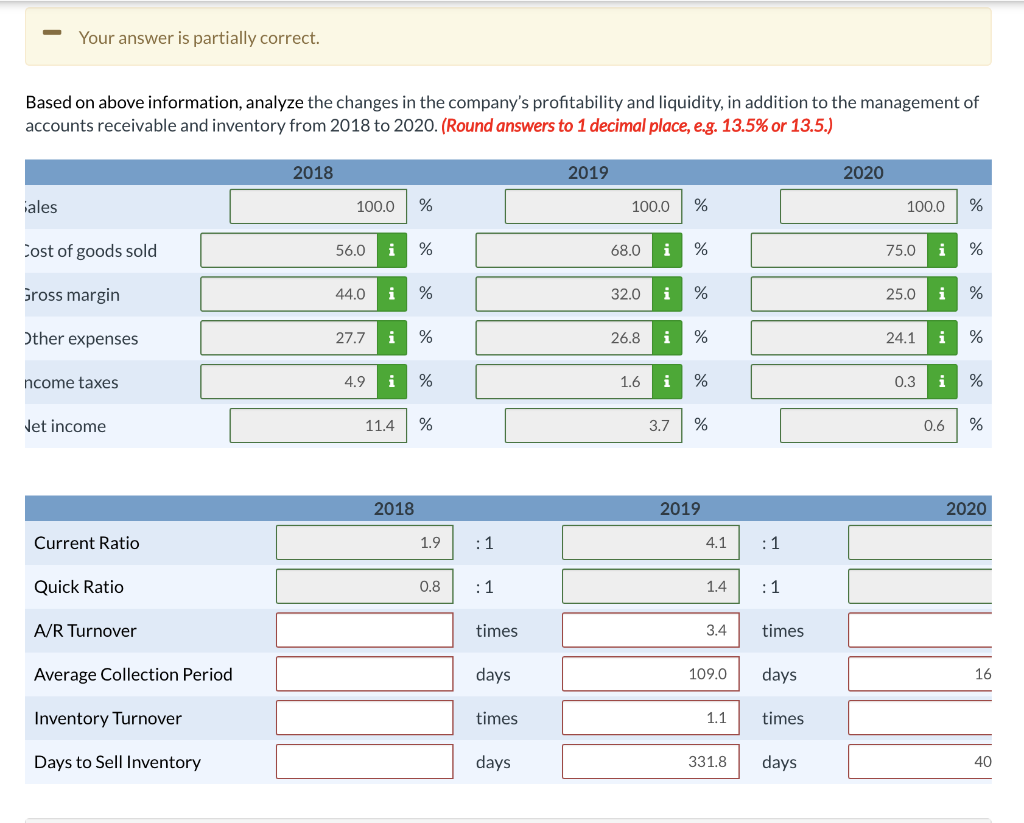
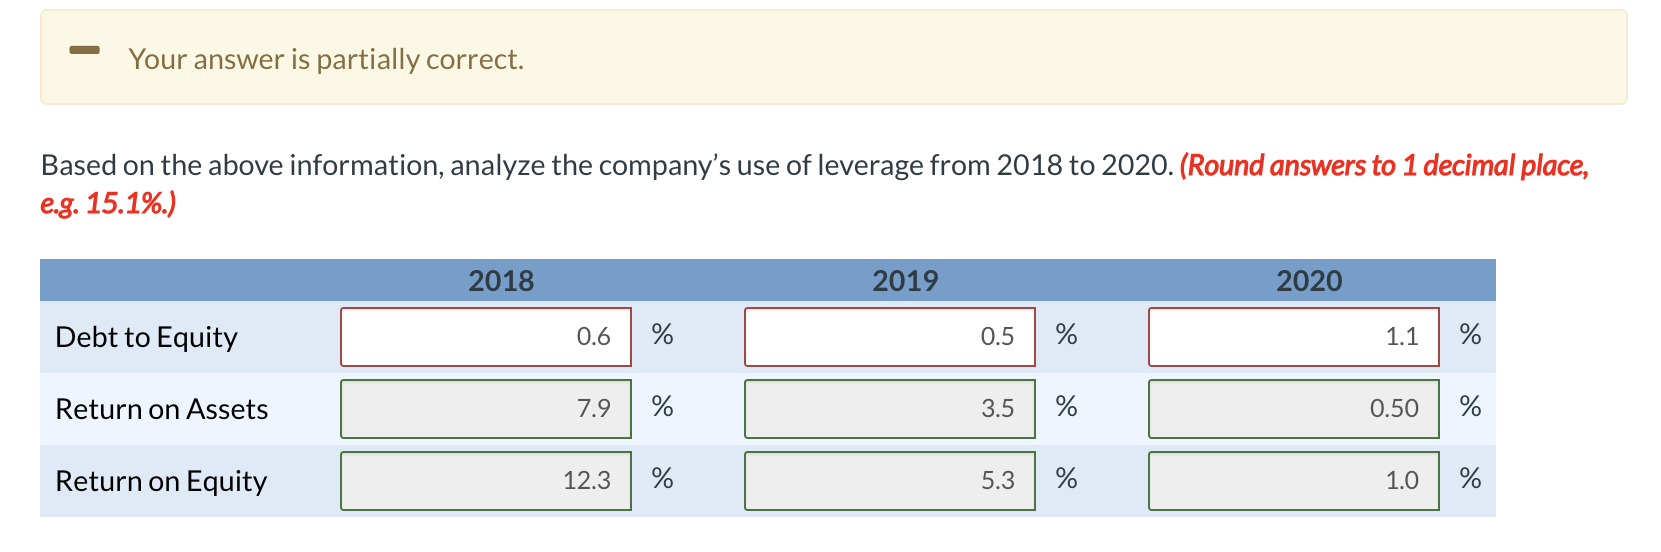
(Ratio analysis over time) The following information comes from the accounting records of Hercep Ltd. for the first three years of its existence: Need Help
(Ratio analysis over time) The following information comes from the accounting records of Hercep Ltd. for the first three years of its existence: Need Help ASAP!
Step by Step Solution
There are 3 Steps involved in it
Step: 1

Get Instant Access to Expert-Tailored Solutions
See step-by-step solutions with expert insights and AI powered tools for academic success
Step: 2

Step: 3
Ace Your Homework with AI
Get the answers you need in no time with our AI-driven, step-by-step assistance
Get Started