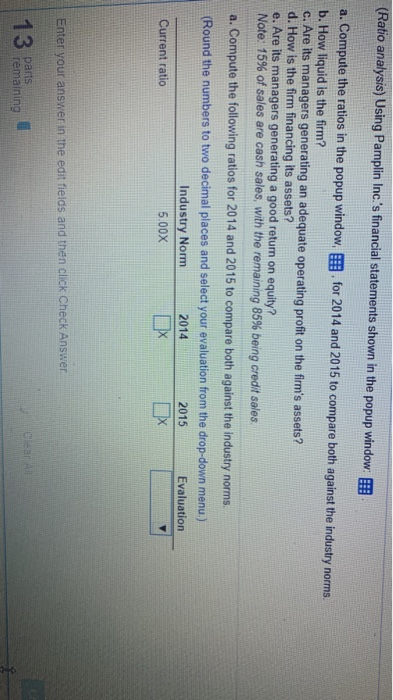
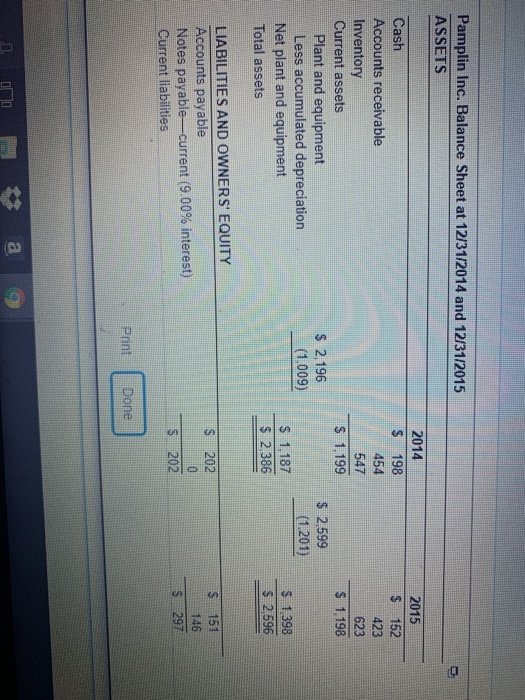
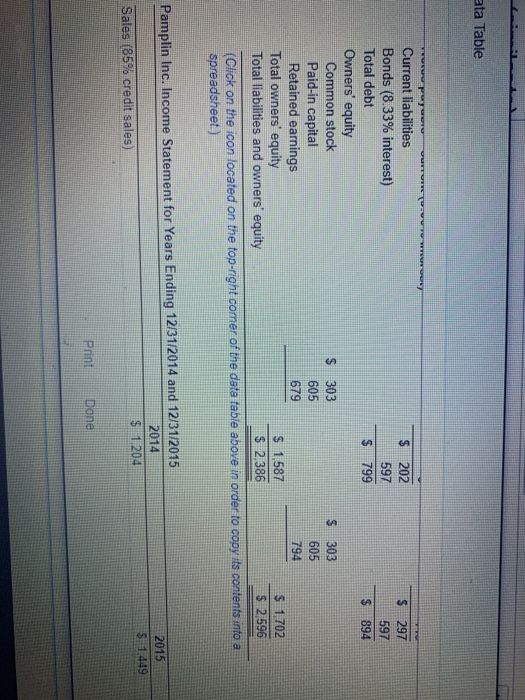
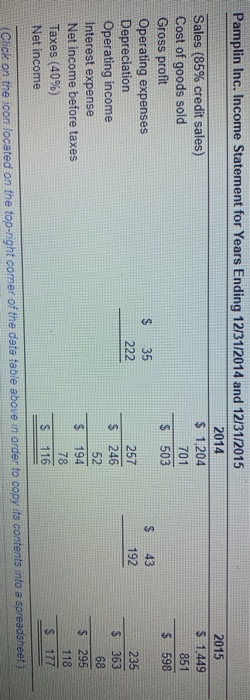
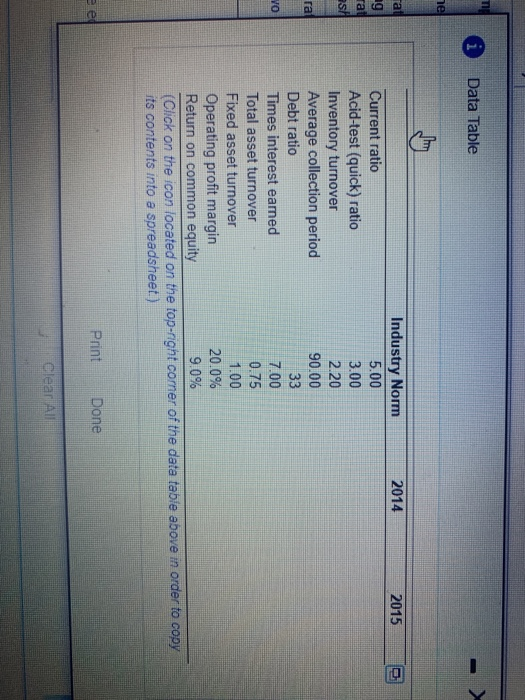
(Ratio analysis) Using Pamplin Inc.'s financial statements shown in the popup window a. Compute the ratios in the popup window, for 2014 and 2015 to compare both against the industry norms. b. How liquid is the firm? c. Are its managers generating an adequate operating profit on the firm's assets? d. How is the firm financing its assets? e. Are its managers generating a good return on equity? Note: 15% of sales are cash sales, with the remaining 85% being credit sales a. Compute the following ratios for 2014 and 2015 to compare both against the industry norms. (Round the numbers to two decimal places and select your evaluation from the drop-down menu.) Industry Norm 2014 2015 Evaluation Current ratio 5.00x IX Enter your answer in the edit fields and then click Check Answer. 13 remaining Pamplin Inc. Balance Sheet at 12/31/2014 and 12/31/2015 ASSETS 2015 152 2014 $ 198 454 547 S 1,199 423 623 $ 1.198 Cash Accounts receivable Inventory Current assets Plant and equipment Less accumulated depreciation Net plant and equipment Total assets $ 2.196 (1.009) $ 2.599 (1201) $ 1.187 $ 2.386 $ 1,398 $ 2.596 5202 LIABILITIES AND OWNERS' EQUITY Accounts payable Notes payable-current (9.00% interest) Current liabilities 146 297 $ 202 $ Print Done ] ata Table MW Current liabilities Bonds (8.33% interest) Total debt Owners' equity Common stock $ 303 303 Paid-in capital Retained earnings 679 794 Total owners' equity $ 1,587 $ 1702 Total liabilities and owners' equity $ 2.386 $ 2.596 (Click on the icon located on the top-right corner of the data table above in order to copy its contents into a spreadsheet) 605 605 Pamplin Inc. Income Statement for Years Ending 12/31/2014 and 12/31/2015 2014 Sales (85% credit sales) $ 1204 2015 $ 1.449 Print Done 2015 $ 1.449 851 $ 598 701 $ 43 Pamplin Inc. Income Statement for Years Ending 12/31/2014 and 12/31/2015 2014 Sales (85% credit sales) $ 1,204 Cost of goods sold Gross profit $ 503 Operating expenses $ 35 Depreciation Operating income Interest expense Net income before taxes Taxes (40%) Net income S 116 222 (Click on the icon located on the top-right comer of the deta table above in order to copy its contents into a spreadsheet) i Data Table 2.20 33 Industry Norm 2014 2015 Current ratio 5.00 Acid-test (quick) ratio 3.00 Inventory turnover Average collection period 90.00 Debt ratio Times interest eamed Total asset turnover 0.75 Fixed asset turnover 1.00 Operating profit margin 20.0% Return on common equity 9.0% (Click on the icon located on the top-right comer of the data table above in order to copy its contents into a spreadsheet) 7.00 Print Done Clear All (Ratio analysis) Using Pamplin Inc.'s financial statements shown in the popup window a. Compute the ratios in the popup window, for 2014 and 2015 to compare both against the industry norms. b. How liquid is the firm? c. Are its managers generating an adequate operating profit on the firm's assets? d. How is the firm financing its assets? e. Are its managers generating a good return on equity? Note: 15% of sales are cash sales, with the remaining 85% being credit sales a. Compute the following ratios for 2014 and 2015 to compare both against the industry norms. (Round the numbers to two decimal places and select your evaluation from the drop-down menu.) Industry Norm 2014 2015 Evaluation Current ratio 5.00x IX Enter your answer in the edit fields and then click Check Answer. 13 remaining Pamplin Inc. Balance Sheet at 12/31/2014 and 12/31/2015 ASSETS 2015 152 2014 $ 198 454 547 S 1,199 423 623 $ 1.198 Cash Accounts receivable Inventory Current assets Plant and equipment Less accumulated depreciation Net plant and equipment Total assets $ 2.196 (1.009) $ 2.599 (1201) $ 1.187 $ 2.386 $ 1,398 $ 2.596 5202 LIABILITIES AND OWNERS' EQUITY Accounts payable Notes payable-current (9.00% interest) Current liabilities 146 297 $ 202 $ Print Done ] ata Table MW Current liabilities Bonds (8.33% interest) Total debt Owners' equity Common stock $ 303 303 Paid-in capital Retained earnings 679 794 Total owners' equity $ 1,587 $ 1702 Total liabilities and owners' equity $ 2.386 $ 2.596 (Click on the icon located on the top-right corner of the data table above in order to copy its contents into a spreadsheet) 605 605 Pamplin Inc. Income Statement for Years Ending 12/31/2014 and 12/31/2015 2014 Sales (85% credit sales) $ 1204 2015 $ 1.449 Print Done 2015 $ 1.449 851 $ 598 701 $ 43 Pamplin Inc. Income Statement for Years Ending 12/31/2014 and 12/31/2015 2014 Sales (85% credit sales) $ 1,204 Cost of goods sold Gross profit $ 503 Operating expenses $ 35 Depreciation Operating income Interest expense Net income before taxes Taxes (40%) Net income S 116 222 (Click on the icon located on the top-right comer of the deta table above in order to copy its contents into a spreadsheet) i Data Table 2.20 33 Industry Norm 2014 2015 Current ratio 5.00 Acid-test (quick) ratio 3.00 Inventory turnover Average collection period 90.00 Debt ratio Times interest eamed Total asset turnover 0.75 Fixed asset turnover 1.00 Operating profit margin 20.0% Return on common equity 9.0% (Click on the icon located on the top-right comer of the data table above in order to copy its contents into a spreadsheet) 7.00 Print Done Clear All
