Answered step by step
Verified Expert Solution
Question
1 Approved Answer
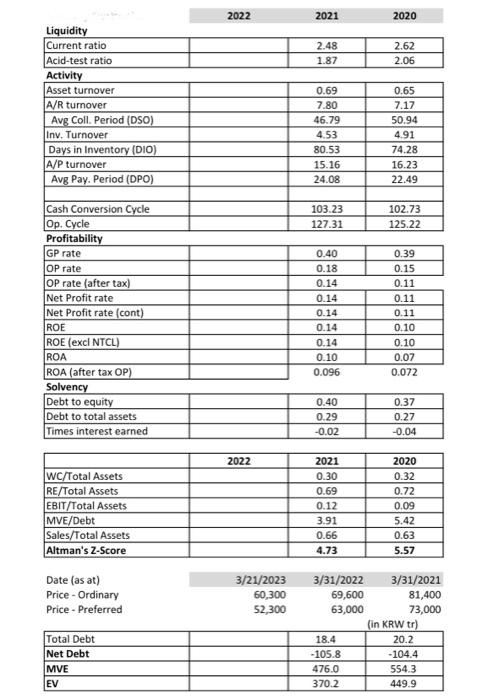
Ratio exercise: 2. Value of equity as at march 14,2023 3. Enterprise value 4. Current ratio 5. Acid-test ratio 6. Operating cycle in days 7.
Ratio exercise:
2. Value of equity as at march 14,2023
3. Enterprise value
4. Current ratio
5. Acid-test ratio
6. Operating cycle in days
7. Cash conversion cycle in days
8. Roe excluding
9. ROA
10. Debt to equity
11. Times interest earned
12. Altmans Z score

financial statement ->
https://images.samsung.com/is/content/samsung/assets/global/ir/docs/2022_con_quarter04_all.pdf
Samsung electronics financial statements
https://images.samsung.com/is/content/samsung/assets/global/ir/docs/2022_con_quarter04_all.pdf
Ratio exercise 

.
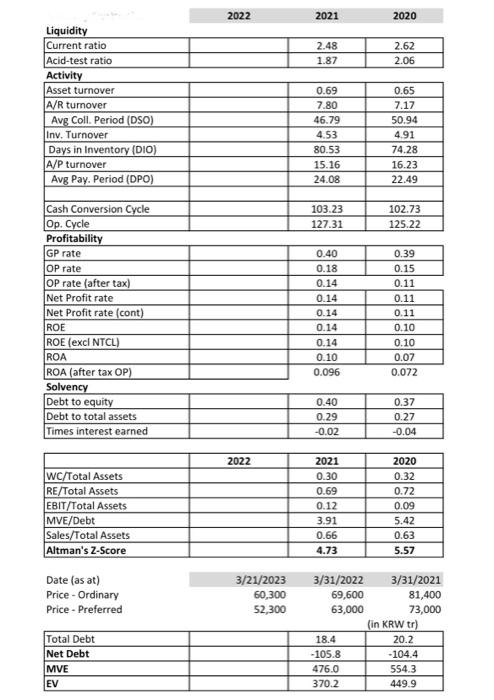
\begin{tabular}{l|l|l|l|} \cline { 2 - 4 } \multicolumn{3}{c}{2022} & \multicolumn{2}{l|}{2021} & 2020 \\ \cline { 2 - 4 } Liquidity & & 2.48 & 2.62 \\ \hline Current ratio & & 1.87 & 2.06 \\ \hline Acid-test ratio & \end{tabular} Activity Profitability Solvency \begin{tabular}{|l|c|c|c|} \hline Debt to equity & & 0.40 & 0.37 \\ \hline Debt to total assets & & 0.29 & 0.27 \\ \hline Times interest earned & & -0.02 & -0.04 \\ \hline \end{tabular} \begin{tabular}{|l|c|c|c|} \hline & 2022 & 2021 & 2020 \\ \hline WC/Total Assets & & 0.30 & 0.32 \\ \hline RE/Total Assets & & 0.69 & 0.72 \\ \hline EBIT/Total Assets & & 0.12 & 0.09 \\ \hline MVE/Debt & & 3.91 & 5.42 \\ \hline Sales/Total Assets & & 0.66 & 0.63 \\ \hline Altman's Z-Score & & 4.73 & 5.57 \\ \hline \end{tabular} Date (as at) Price-Ordinary Price - Preferred 3/21/202360,30052,3003/31/202269,60063,0003/31/202181,40073,000 (in KRW tr) \begin{tabular}{l|l|l|l|} \cline { 2 - 4 } \multicolumn{3}{c}{2022} & \multicolumn{2}{l|}{2021} & 2020 \\ \cline { 2 - 4 } Liquidity & & 2.48 & 2.62 \\ \hline Current ratio & & 1.87 & 2.06 \\ \hline Acid-test ratio & \end{tabular} Activity Profitability Solvency \begin{tabular}{|l|c|c|c|} \hline Debt to equity & & 0.40 & 0.37 \\ \hline Debt to total assets & & 0.29 & 0.27 \\ \hline Times interest earned & & -0.02 & -0.04 \\ \hline \end{tabular} \begin{tabular}{|l|c|c|c|} \hline & 2022 & 2021 & 2020 \\ \hline WC/Total Assets & & 0.30 & 0.32 \\ \hline RE/Total Assets & & 0.69 & 0.72 \\ \hline EBIT/Total Assets & & 0.12 & 0.09 \\ \hline MVE/Debt & & 3.91 & 5.42 \\ \hline Sales/Total Assets & & 0.66 & 0.63 \\ \hline Altman's Z-Score & & 4.73 & 5.57 \\ \hline \end{tabular} Date (as at) Price-Ordinary Price - Preferred 3/21/202360,30052,3003/31/202269,60063,0003/31/202181,40073,000 (in KRW tr) \begin{tabular}{l|l|l|l|} \cline { 2 - 4 } \multicolumn{3}{c}{2022} & \multicolumn{2}{l|}{2021} & 2020 \\ \cline { 2 - 4 } Liquidity & & 2.48 & 2.62 \\ \hline Current ratio & & 1.87 & 2.06 \\ \hline Acid-test ratio & \end{tabular} Activity Profitability Solvency \begin{tabular}{|l|c|c|c|} \hline Debt to equity & & 0.40 & 0.37 \\ \hline Debt to total assets & & 0.29 & 0.27 \\ \hline Times interest earned & & -0.02 & -0.04 \\ \hline \end{tabular} \begin{tabular}{|l|c|c|c|} \hline & 2022 & 2021 & 2020 \\ \hline WC/Total Assets & & 0.30 & 0.32 \\ \hline RE/Total Assets & & 0.69 & 0.72 \\ \hline EBIT/Total Assets & & 0.12 & 0.09 \\ \hline MVE/Debt & & 3.91 & 5.42 \\ \hline Sales/Total Assets & & 0.66 & 0.63 \\ \hline Altman's Z-Score & & 4.73 & 5.57 \\ \hline \end{tabular} Date (as at) Price-Ordinary Price - Preferred 3/21/202360,30052,3003/31/202269,60063,0003/31/202181,40073,000 (in KRW tr) \begin{tabular}{l|l|l|l|} \cline { 2 - 4 } \multicolumn{3}{c}{2022} & \multicolumn{2}{l|}{2021} & 2020 \\ \cline { 2 - 4 } Liquidity & & 2.48 & 2.62 \\ \hline Current ratio & & 1.87 & 2.06 \\ \hline Acid-test ratio & \end{tabular} Activity Profitability Solvency \begin{tabular}{|l|c|c|c|} \hline Debt to equity & & 0.40 & 0.37 \\ \hline Debt to total assets & & 0.29 & 0.27 \\ \hline Times interest earned & & -0.02 & -0.04 \\ \hline \end{tabular} \begin{tabular}{|l|c|c|c|} \hline & 2022 & 2021 & 2020 \\ \hline WC/Total Assets & & 0.30 & 0.32 \\ \hline RE/Total Assets & & 0.69 & 0.72 \\ \hline EBIT/Total Assets & & 0.12 & 0.09 \\ \hline MVE/Debt & & 3.91 & 5.42 \\ \hline Sales/Total Assets & & 0.66 & 0.63 \\ \hline Altman's Z-Score & & 4.73 & 5.57 \\ \hline \end{tabular} Date (as at) Price-Ordinary Price - Preferred 3/21/202360,30052,3003/31/202269,60063,0003/31/202181,40073,000 (in KRW tr) Step by Step Solution
There are 3 Steps involved in it
Step: 1

Get Instant Access to Expert-Tailored Solutions
See step-by-step solutions with expert insights and AI powered tools for academic success
Step: 2

Step: 3

Ace Your Homework with AI
Get the answers you need in no time with our AI-driven, step-by-step assistance
Get Started


