ratios
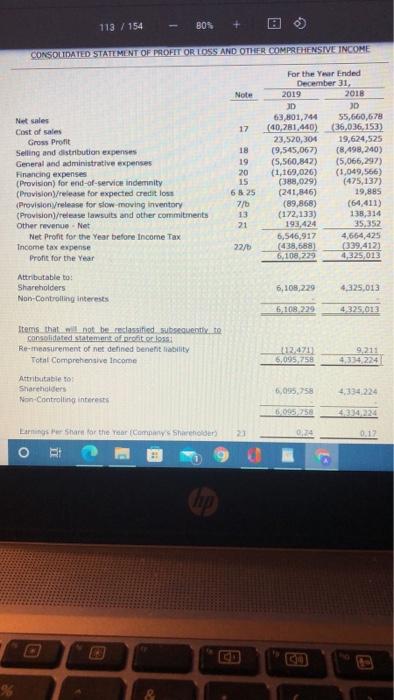
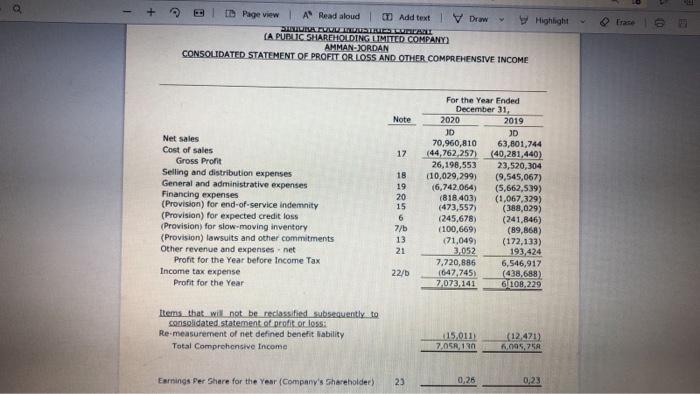
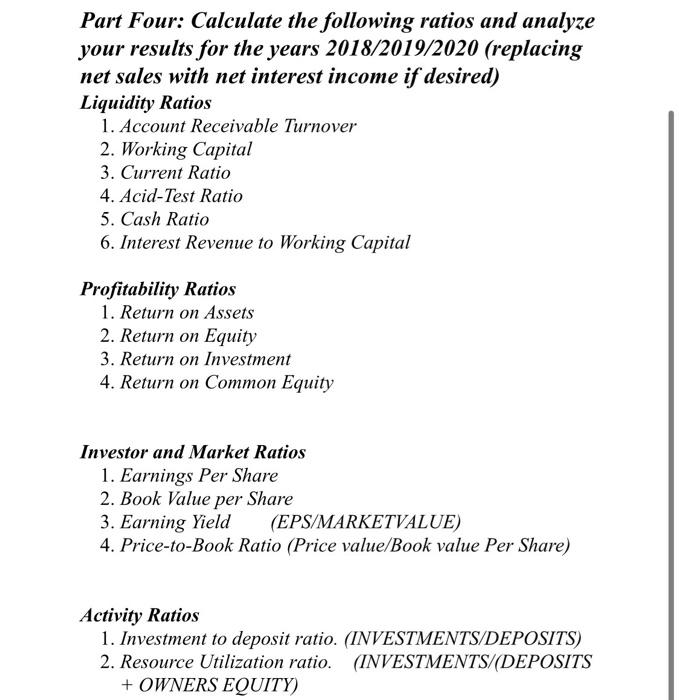
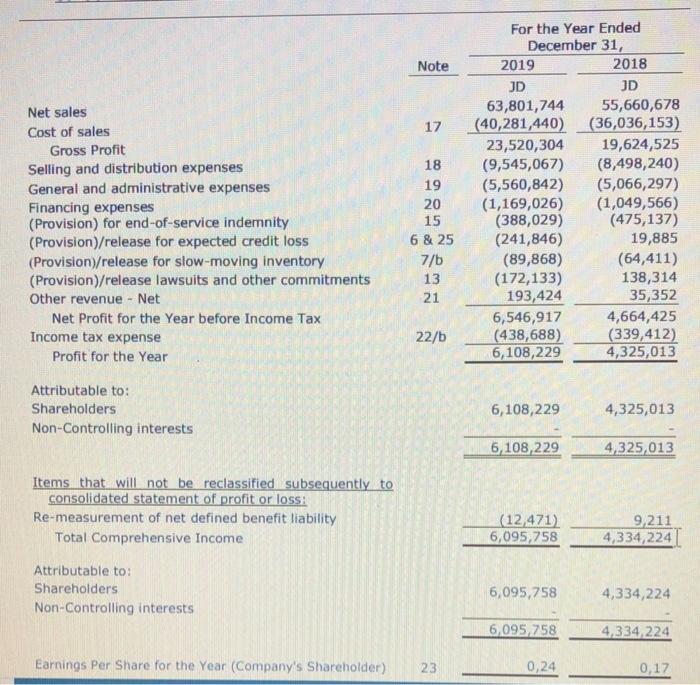
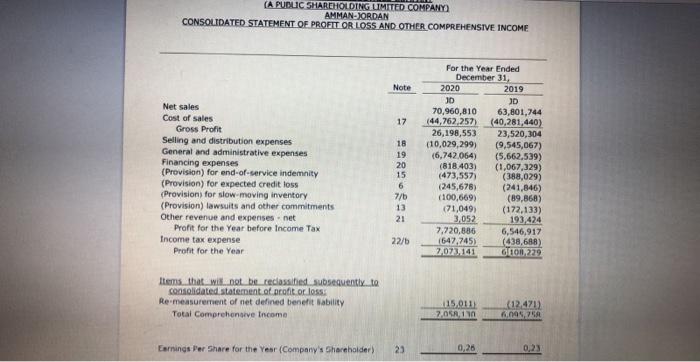
113 / 154 BON @ CONSOLIDATED STATEMENT OF PROFIT OR LOSS AND OTHER COMPREHENSIVE INCOME Note 17 Net sales Cost of sales Gross Profit Selling and distribution expenses General and administrative expenses Financing expenses (Provision for end-of-service indemnity (Provision/release for expected credit loss (Provision release for slow-moving inventory (Provision/release lawsuits and other commitments Other revenue - Net Net Profit for the Year before Income Tax Income tax expense Profit for the Year 18 19 20 15 6825 7/0 13 21 For the Year Ended December 31 2019 2018 3D 3D 63 801,744 55,660,678 (40,281,440) (36,036,153) 23.520,304 19,624,525 (9,545,067) (8.498,240) (5,560,842) (5,066,297) (1,169,026) (1.049,566) (388,029) (475,137 (241,846) 19,885 (89,868) (64,411) (172,133) 138,314 193,424 35,352 6,546,917 4,664,425 (438,688) (339.412) 6.108.229 4,325,013 22/ Attributable to: Shareholders Non-Controlling interests 6,108,229 4,325.013 6,109.229 4.325,012 Items that will not be reclassified subsequently to consolidated statement of profit or losse Re-measurement of net defined benefitability Total Comprehensive Income 112.471 5,095,758 4334 224 Attributable to Shareholders Non-Controlling interests 5,095,758 4,334224 5095,758 Laringer har for the rear Com Shareholder 23 0:24 0.17 o RI @ + Highlight TD Page view A Read aloud 0 Add text IV Draw ULIRELVL LLLUSTRE LURALI (A PUBLIC SHAREHOLDING LIMITED COMPANY AMMAN-JORDAN CONSOLIDATED STATEMENT OF PROFIT OR LOSS AND OTHER COMPREHENSIVE INCOME Note 17 Net sales Cost of sales Gross Profit Selling and distribution expenses General and administrative expenses Financing expenses (Provision for end-of-service indemnity (Provision) for expected credit loss (Provisions for slow moving inventory (Provision lawsuits and other commitments Other revenue and expenses.net Profit for the Year before Income Tax Income tax expense Profit for the Year 18 19 20 15 6 7/b 13 21 For the Year Ended December 31, 2020 2019 JD 3D 70,960,810 63,801,744 (44,762,257) (40,281,440) 26,198,553 23,520,304 (10,029,299) (9.545,067) (6,742064) (5,662,539) (818.403) (1,067,329) (473,557) (388,029) (245,678) (241,846) (100,669) (89,868) 71,049) (172,133) 3,052 193,424 7.720,886 6,546,917 1647,745) (438.688) 7,073,141 6 108,229 22/ tems that will not be reclassified subsequently to consolidated statement of profit or loss: Re-measurement of net defined benefit ability Total Comprehensive Income 415.001) 7.05R, 120 (12,421) 1,095,75 Earnings Per Share for the Year (Company's Shareholder) 23 0,26 0,23 Part Four: Calculate the following ratios and analyze your results for the years 2018/2019/2020 (replacing net sales with net interest income if desired) Liquidity Ratios 1. Account Receivable Turnover 2. Working Capital 3. Current Ratio 4. Acid-Test Ratio 5. Cash Ratio 6. Interest Revenue to Working Capital Profitability Ratios 1. Return on Assets 2. Return on Equity 3. Return on Investment 4. Return on Common Equity Investor and Market Ratios 1. Earnings Per Share 2. Book Value per Share 3. Earning Yield (EPS/MARKETVALUE) 4. Price-to-Book Ratio (Price value/Book value Per Share) Activity Ratios 1. Investment to deposit ratio. (INVESTMENTS/DEPOSITS) 2. Resource Utilization ratio. (INVESTMENTS/(DEPOSITS + OWNERS EQUITY) Part Four: Calculate the following ratios and analyze your results for the years 2018/2019/2020 (replacing net sales with net interest income if desired) Liquidity Ratios 1. Account Receivable Turnover 2. Working Capital 3. Current Ratio 4. Acid-Test Ratio 5. Cash Ratio 6. Interest Revenue to Working Capital Profitability Ratios 1. Return on Assets 2. Return on Equity 3. Return on Investment 4. Return on Common Equity Investor and Market Ratios 1. Earnings Per Share 2. Book Value per Share 3. Earning Yield (EPS/MARKETVALUE) 4. Price-to-Book Ratio (Price value/Book value Per Share) Activity Ratios 1. Investment to deposit ratio. (INVESTMENTS/DEPOSITS) 2. Resource Utilization ratio. (INVESTMENTS/(DEPOSITS + OWNERS EQUITY) Part Four: Calculate the following ratios and analyze your results for the years 2018/2019/2020 (replacing net sales with net interest income if desired) Liquidity Ratios 1. Account Receivable Turnover 2. Working Capital 3. Current Ratio 4. Acid-Test Ratio 5. Cash Ratio 6. Interest Revenue to Working Capital Profitability Ratios 1. Return on Assets 2. Return on Equity 3. Return on Investment 4. Return on Common Equity Investor and Market Ratios 1. Earnings Per Share 2. Book Value per Share 3. Earning Yield (EPS/MARKETVALUE) 4. Price-to-Book Ratio (Price value/Book value Per Share) Activity Ratios 1. Investment to deposit ratio. (INVESTMENTS/DEPOSITS) 2. Resource Utilization ratio. (INVESTMENTS/(DEPOSITS + OWNERS EQUITY) Note 17 Net sales Cost of sales Gross Profit Selling and distribution expenses General and administrative expenses Financing expenses (Provision) for end-of-service indemnity (Provision)/release for expected credit loss (Provision)/release for slow-moving inventory (Provision)/release lawsuits and other commitments Other revenue - Net Net Profit for the Year before Income Tax Income tax expense Profit for the Year 18 19 20 15 6 & 25 7/b 13 21 For the Year Ended December 31, 2019 2018 JD JD 63,801,744 55,660,678 (40,281,440) (36,036,153) 23,520,304 19,624,525 (9,545,067) (8,498,240) (5,560,842) (5,066,297) (1,169,026) (1,049,566) (388,029) (475,137) (241,846) 19,885 (89,868) (64,411) (172,133) 138,314 193,424 35,352 6,546,917 4,664,425 (438,688) (339,412) 6,108,229 4,325,013 22/b Attributable to: Shareholders Non-Controlling interests 6,108,229 4,325,013 6,108,229 4,325,013 Items that will not be reclassified subsequently to consolidated statement of profit or loss: Re-measurement of net defined benefit liability Total Comprehensive Income (12,471) 6,095,758 9,211 4,334,224 Attributable to: Shareholders Non-Controlling interests 6,095,758 4,334,224 6,095,758 4,334,224 Earnings Per Share for the Year (Company's Shareholder) 23 0,24 0,17 (A PUDUC SHAREHOLDING UIMITED COMPANY AMMAN-JORDAN CONSOLIDATED STATEMENT OF PROFIT OR LOSS AND OTHER COMPREHENSIVE INCOME Note 17 Net sales Cost of sales Gross Profit Selling and distribution expenses General and administrative expenses Financing expenses (Provision) for end-of-service indemnity (Provision) for expected credit loss (Provisions for slow moving inventory (Provision) lawsuits and other commitments Other revenue and expenses.net Profit for the Year before Income Tax Income tax expense Profit for the Year 18 19 20 15 6 7/5 13 21 For the Year Ended December 31 2020 2019 ID D 70,960,810 63,801,744 (44,762,257) (40,281,440) 26,198,553 23,520,304 (10,029,299) (9,545,067) (6,742,064) (5.662,539) (818.403) (1,067,329) (473,557) (388,029) (245,678) (241,846) (100,669) (89,868) (71,049) (172,133) 3,052 193,424 7,720,886 6,546,917 1647,745) (438,688) 2.073,141 GLOB.229 22/6 Items that will not be reclassified subsequently to consolidated statement of profit or loss Re measurement of net defined benefit ability Total Comprehensive Income 15.011 2.OKR 10 12.471) 0,76 Earnings Per Share for the Year (Company's Shareholder) 23 0,26 0,23 Part Four: Calculate the following ratios and analyze your results for the years 2018/2019/2020 (replacing net sales with net interest income if desired) Liquidity Ratios 1. Account Receivable Turnover 2. Working Capital 3. Current Ratio 4. Acid-Test Ratio 5. Cash Ratio 6. Interest Revenue to Working Capital Profitability Ratios 1. Return on Assets 2. Return on Equity 3. Return on Investment 4. Return on Common Equity Investor and Market Ratios 1. Earnings Per Share 2. Book Value per Share 3. Earning Yield (EPS/MARKETVALUE) 4. Price-to-Book Ratio (Price value/Book value Per Share) Activity Ratios 1. Investment to deposit ratio. (INVESTMENTS/DEPOSITS) 2. Resource Utilization ratio. (INVESTMENTS/(DEPOSITS + OWNERS EQUITY) 113 / 154 BON @ CONSOLIDATED STATEMENT OF PROFIT OR LOSS AND OTHER COMPREHENSIVE INCOME Note 17 Net sales Cost of sales Gross Profit Selling and distribution expenses General and administrative expenses Financing expenses (Provision for end-of-service indemnity (Provision/release for expected credit loss (Provision release for slow-moving inventory (Provision/release lawsuits and other commitments Other revenue - Net Net Profit for the Year before Income Tax Income tax expense Profit for the Year 18 19 20 15 6825 7/0 13 21 For the Year Ended December 31 2019 2018 3D 3D 63 801,744 55,660,678 (40,281,440) (36,036,153) 23.520,304 19,624,525 (9,545,067) (8.498,240) (5,560,842) (5,066,297) (1,169,026) (1.049,566) (388,029) (475,137 (241,846) 19,885 (89,868) (64,411) (172,133) 138,314 193,424 35,352 6,546,917 4,664,425 (438,688) (339.412) 6.108.229 4,325,013 22/ Attributable to: Shareholders Non-Controlling interests 6,108,229 4,325.013 6,109.229 4.325,012 Items that will not be reclassified subsequently to consolidated statement of profit or losse Re-measurement of net defined benefitability Total Comprehensive Income 112.471 5,095,758 4334 224 Attributable to Shareholders Non-Controlling interests 5,095,758 4,334224 5095,758 Laringer har for the rear Com Shareholder 23 0:24 0.17 o RI @ + Highlight TD Page view A Read aloud 0 Add text IV Draw ULIRELVL LLLUSTRE LURALI (A PUBLIC SHAREHOLDING LIMITED COMPANY AMMAN-JORDAN CONSOLIDATED STATEMENT OF PROFIT OR LOSS AND OTHER COMPREHENSIVE INCOME Note 17 Net sales Cost of sales Gross Profit Selling and distribution expenses General and administrative expenses Financing expenses (Provision for end-of-service indemnity (Provision) for expected credit loss (Provisions for slow moving inventory (Provision lawsuits and other commitments Other revenue and expenses.net Profit for the Year before Income Tax Income tax expense Profit for the Year 18 19 20 15 6 7/b 13 21 For the Year Ended December 31, 2020 2019 JD 3D 70,960,810 63,801,744 (44,762,257) (40,281,440) 26,198,553 23,520,304 (10,029,299) (9.545,067) (6,742064) (5,662,539) (818.403) (1,067,329) (473,557) (388,029) (245,678) (241,846) (100,669) (89,868) 71,049) (172,133) 3,052 193,424 7.720,886 6,546,917 1647,745) (438.688) 7,073,141 6 108,229 22/ tems that will not be reclassified subsequently to consolidated statement of profit or loss: Re-measurement of net defined benefit ability Total Comprehensive Income 415.001) 7.05R, 120 (12,421) 1,095,75 Earnings Per Share for the Year (Company's Shareholder) 23 0,26 0,23 Part Four: Calculate the following ratios and analyze your results for the years 2018/2019/2020 (replacing net sales with net interest income if desired) Liquidity Ratios 1. Account Receivable Turnover 2. Working Capital 3. Current Ratio 4. Acid-Test Ratio 5. Cash Ratio 6. Interest Revenue to Working Capital Profitability Ratios 1. Return on Assets 2. Return on Equity 3. Return on Investment 4. Return on Common Equity Investor and Market Ratios 1. Earnings Per Share 2. Book Value per Share 3. Earning Yield (EPS/MARKETVALUE) 4. Price-to-Book Ratio (Price value/Book value Per Share) Activity Ratios 1. Investment to deposit ratio. (INVESTMENTS/DEPOSITS) 2. Resource Utilization ratio. (INVESTMENTS/(DEPOSITS + OWNERS EQUITY) Part Four: Calculate the following ratios and analyze your results for the years 2018/2019/2020 (replacing net sales with net interest income if desired) Liquidity Ratios 1. Account Receivable Turnover 2. Working Capital 3. Current Ratio 4. Acid-Test Ratio 5. Cash Ratio 6. Interest Revenue to Working Capital Profitability Ratios 1. Return on Assets 2. Return on Equity 3. Return on Investment 4. Return on Common Equity Investor and Market Ratios 1. Earnings Per Share 2. Book Value per Share 3. Earning Yield (EPS/MARKETVALUE) 4. Price-to-Book Ratio (Price value/Book value Per Share) Activity Ratios 1. Investment to deposit ratio. (INVESTMENTS/DEPOSITS) 2. Resource Utilization ratio. (INVESTMENTS/(DEPOSITS + OWNERS EQUITY) Part Four: Calculate the following ratios and analyze your results for the years 2018/2019/2020 (replacing net sales with net interest income if desired) Liquidity Ratios 1. Account Receivable Turnover 2. Working Capital 3. Current Ratio 4. Acid-Test Ratio 5. Cash Ratio 6. Interest Revenue to Working Capital Profitability Ratios 1. Return on Assets 2. Return on Equity 3. Return on Investment 4. Return on Common Equity Investor and Market Ratios 1. Earnings Per Share 2. Book Value per Share 3. Earning Yield (EPS/MARKETVALUE) 4. Price-to-Book Ratio (Price value/Book value Per Share) Activity Ratios 1. Investment to deposit ratio. (INVESTMENTS/DEPOSITS) 2. Resource Utilization ratio. (INVESTMENTS/(DEPOSITS + OWNERS EQUITY) Note 17 Net sales Cost of sales Gross Profit Selling and distribution expenses General and administrative expenses Financing expenses (Provision) for end-of-service indemnity (Provision)/release for expected credit loss (Provision)/release for slow-moving inventory (Provision)/release lawsuits and other commitments Other revenue - Net Net Profit for the Year before Income Tax Income tax expense Profit for the Year 18 19 20 15 6 & 25 7/b 13 21 For the Year Ended December 31, 2019 2018 JD JD 63,801,744 55,660,678 (40,281,440) (36,036,153) 23,520,304 19,624,525 (9,545,067) (8,498,240) (5,560,842) (5,066,297) (1,169,026) (1,049,566) (388,029) (475,137) (241,846) 19,885 (89,868) (64,411) (172,133) 138,314 193,424 35,352 6,546,917 4,664,425 (438,688) (339,412) 6,108,229 4,325,013 22/b Attributable to: Shareholders Non-Controlling interests 6,108,229 4,325,013 6,108,229 4,325,013 Items that will not be reclassified subsequently to consolidated statement of profit or loss: Re-measurement of net defined benefit liability Total Comprehensive Income (12,471) 6,095,758 9,211 4,334,224 Attributable to: Shareholders Non-Controlling interests 6,095,758 4,334,224 6,095,758 4,334,224 Earnings Per Share for the Year (Company's Shareholder) 23 0,24 0,17 (A PUDUC SHAREHOLDING UIMITED COMPANY AMMAN-JORDAN CONSOLIDATED STATEMENT OF PROFIT OR LOSS AND OTHER COMPREHENSIVE INCOME Note 17 Net sales Cost of sales Gross Profit Selling and distribution expenses General and administrative expenses Financing expenses (Provision) for end-of-service indemnity (Provision) for expected credit loss (Provisions for slow moving inventory (Provision) lawsuits and other commitments Other revenue and expenses.net Profit for the Year before Income Tax Income tax expense Profit for the Year 18 19 20 15 6 7/5 13 21 For the Year Ended December 31 2020 2019 ID D 70,960,810 63,801,744 (44,762,257) (40,281,440) 26,198,553 23,520,304 (10,029,299) (9,545,067) (6,742,064) (5.662,539) (818.403) (1,067,329) (473,557) (388,029) (245,678) (241,846) (100,669) (89,868) (71,049) (172,133) 3,052 193,424 7,720,886 6,546,917 1647,745) (438,688) 2.073,141 GLOB.229 22/6 Items that will not be reclassified subsequently to consolidated statement of profit or loss Re measurement of net defined benefit ability Total Comprehensive Income 15.011 2.OKR 10 12.471) 0,76 Earnings Per Share for the Year (Company's Shareholder) 23 0,26 0,23 Part Four: Calculate the following ratios and analyze your results for the years 2018/2019/2020 (replacing net sales with net interest income if desired) Liquidity Ratios 1. Account Receivable Turnover 2. Working Capital 3. Current Ratio 4. Acid-Test Ratio 5. Cash Ratio 6. Interest Revenue to Working Capital Profitability Ratios 1. Return on Assets 2. Return on Equity 3. Return on Investment 4. Return on Common Equity Investor and Market Ratios 1. Earnings Per Share 2. Book Value per Share 3. Earning Yield (EPS/MARKETVALUE) 4. Price-to-Book Ratio (Price value/Book value Per Share) Activity Ratios 1. Investment to deposit ratio. (INVESTMENTS/DEPOSITS) 2. Resource Utilization ratio. (INVESTMENTS/(DEPOSITS + OWNERS EQUITY)