

Question
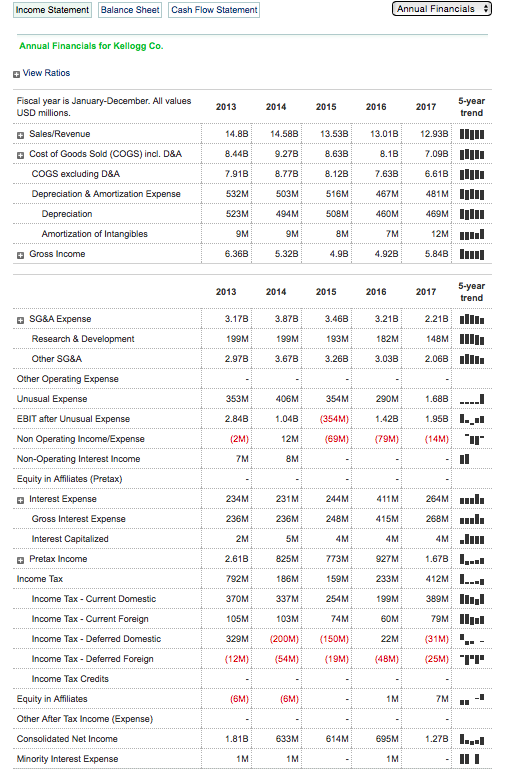
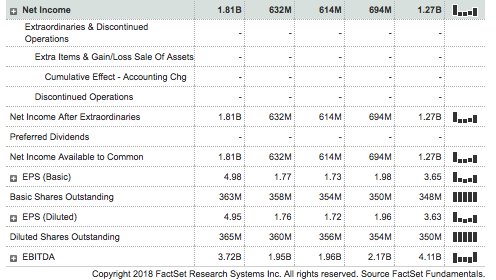
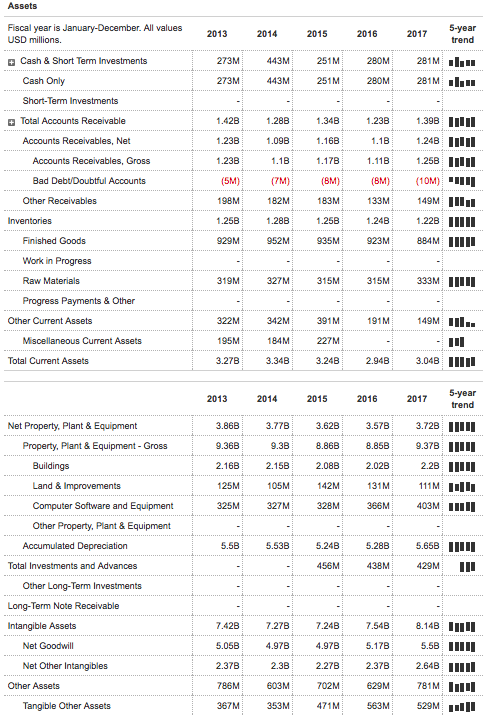
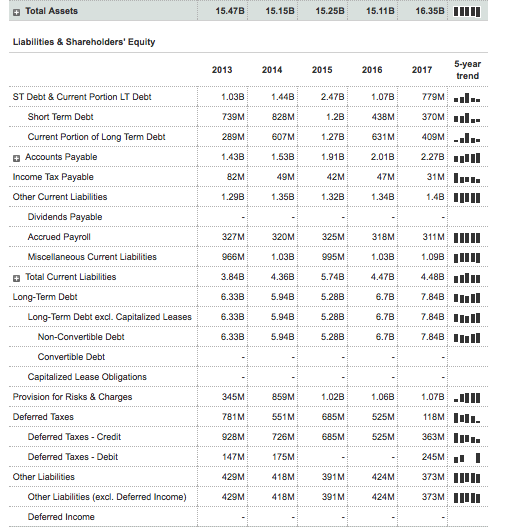
Ratios: Five Years of Financial Statements Calculate the ratios (in the below table under the Kellogg's heading) from the FIVE YEARS of financial statements below.
Ratios: Five Years of Financial Statements
Calculate the ratios (in the below table under the Kellogg's heading) from the FIVE YEARS of financial statements below.
| Financial diagnostic categories | Kelloggs |
|
|
|
| 1.) Liquidity of short-term assets | -Current ratio -Cash ratio -Quick ratio |
|
|
|
| 2.) Long-term debt-paying ability | -Debt ratio -Debt-equity ratio -Times interest earned |
|
|
|
| 3.) Profitability |
|
|
| -Net income/sales (profit margin) -Net income/assets (ROA) -Net income/shareholder equity (ROE) |
|
|
|
| 4.) Asset utilization/ management efficiency | -Total asset turnover -Inventory turnover measures -Accounts receivable turnover |
|
|
|
| 5.) Market measures | -Price/earnings ratio -Earnings per common share -Dividend payout |
|
|
|
Income statement
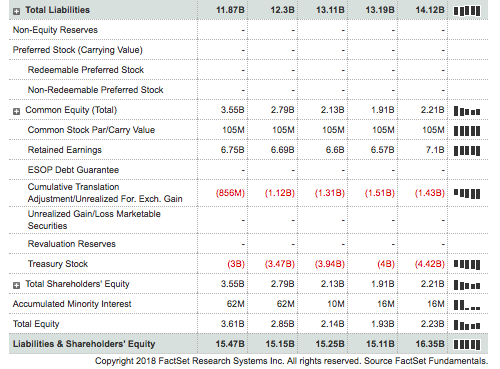
Balance Sheet
Cash Flow Statement
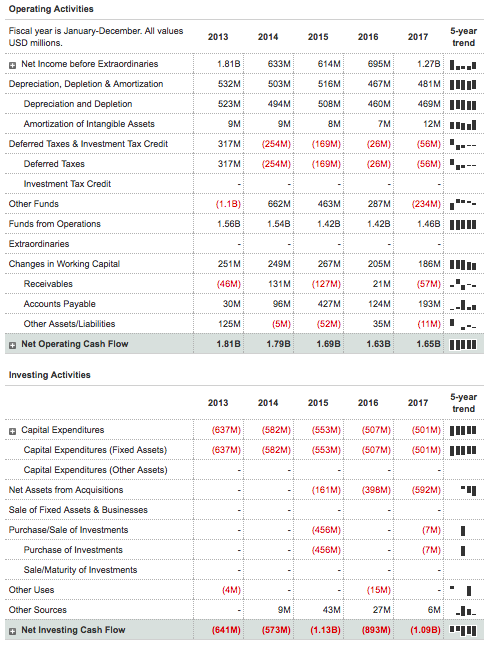
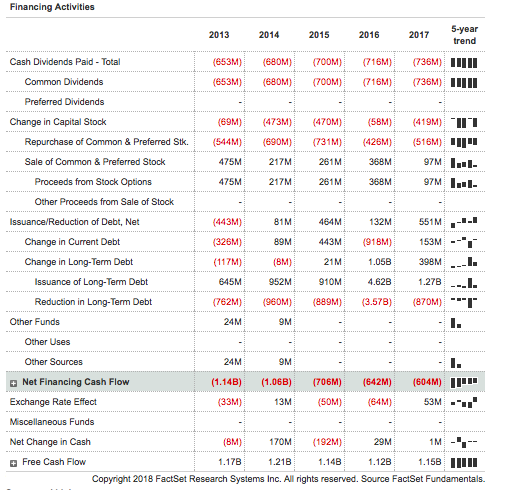
Income Statement Balance Sheet Cash Flow Statement Annual Financials Annual Financials for Kellogg Co. View Ratios Fiscal year is January-December. All values USD millions. 20132014 2017 5-year 16 14.88 14.588 13.538 13.018 12.938???? Cost of Goods Sold (COGS) incl. D&A 8.44B 9.27B 8.1B 7.098II 7.918 8.77B8.12B7.6386.61III 532M 503M 516M 467M 481MIIII COGS excluding D&A Depreciation 523M 494M 508M 460M 469M Amortization of Intangibles 2M Gross Income 6.368 498 4.928 5.84B1ml 16 2017 5-year SG&A Expense .17B3.87B3.463.21 2.218lI 199M 99M 193M82M 148M IIII 3.03B 2.068II Other SG&A Other Operating Expense Unusual Expense EBIT after Unusual Expense Non Operating Income/Expense Non-Operating Interest Income Equity in Affiliates (Pretax) 3.67B 406M 354M 290M 2.84B 1.048 354M 1.428.98..il - 12M (69M): (79M): (14M) 234M 244M 411M 264Ml Interest Expense Gross Interest Expense Interest Capitalized Pretax Income 15M 268M 4M 1111 927M 1.678 I... 186M 412M.. Income Tax 233M Income Tax Current Domestic Income Tax Current Foreign Income Tax Deferred Domestic Income Tax- Deferred Foreign Income Tax Credits 370M 337M 254M 99M 389MIII 105M 329M (200M (150M) (12M (54M)(19M)(48M) 25MTI 103M 79MI 22M (31M) Equity in Affiliates Other After Tax Income (Expense) Consolidated Net Income Minority Interest Expense 614M 695M 1.27B
Step by Step Solution
There are 3 Steps involved in it
Step: 1

Get Instant Access to Expert-Tailored Solutions
See step-by-step solutions with expert insights and AI powered tools for academic success
Step: 2

Step: 3
Ace Your Homework with AI
Get the answers you need in no time with our AI-driven, step-by-step assistance
Get Started
Foreign Investment And Spillovers
Authors: Magnus Blomstrom
1st Edition
1138025976,1317685121