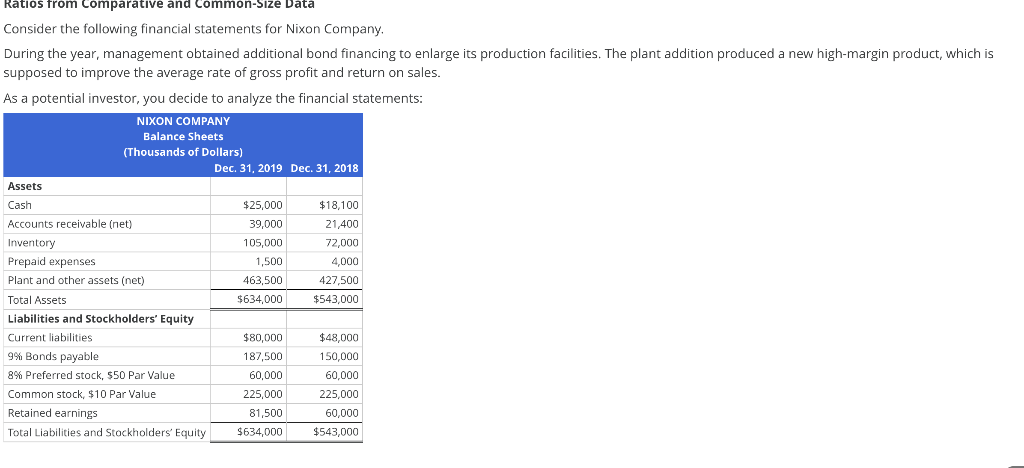
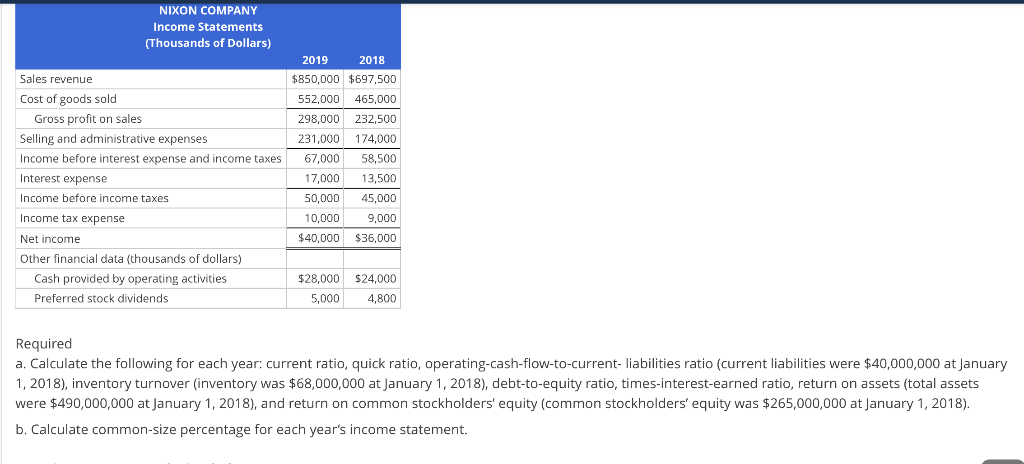
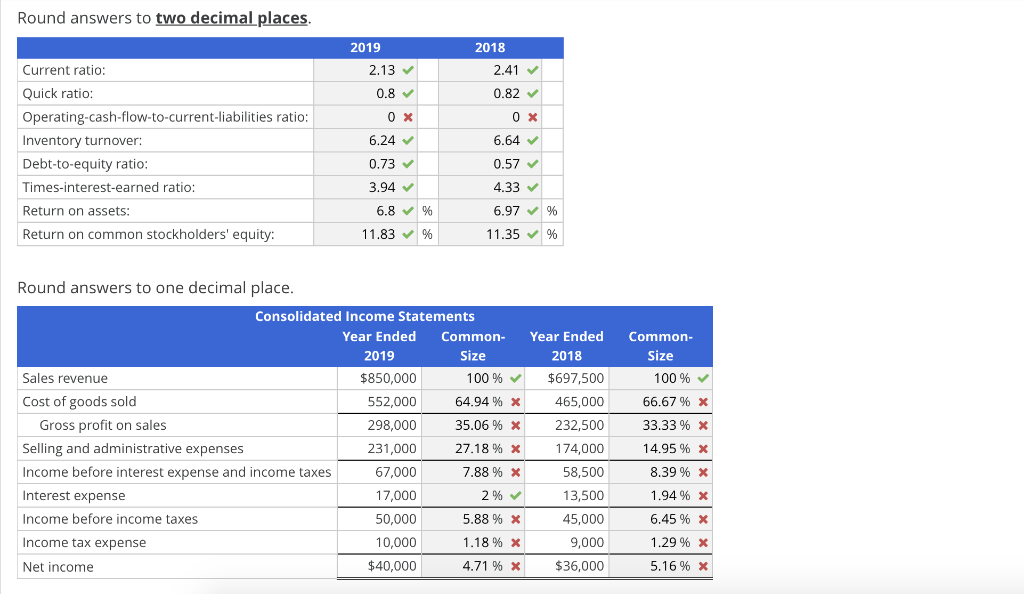
Ratios from Comparative and common-Size Data Consider the following financial statements for Nixon Company, During the year, management obtained additional bond financing to enlarge its production facilities. The plant addition produced a new high-margin product, which is supposed to improve the average rate of gross profit and return on sales. As a potential investor, you decide to analyze the financial statements: NIXON COMPANY Balance Sheets (Thousands of Dollars) Dec 31, 2019 Dec. 31, 2018 Assets Cash $25,000 $18,100 Accounts receivable (net) 39,000 21,400 Inventory 105,000 72,000 Prepaid expenses 1,500 4,000 Plant and other assets (net) 463,500 427,500 Total Assets $634,000 $543,000 Liabilities and Stockholders' Equity Current liabilities $80,000 $ $48,000 9% Bonds payable 187,500 150,000 8% Preferred stock, $50 Par Value 60,000 60,000 Common stock, $10 Par Value 225,000 225,000 Retained earnings 81,500 60,000 Total Liabilities and Stockholders' Equity $634,000 $543,000 NIXON COMPANY Income Statements (Thousands of Dollars) Sales revenue Cost of goods sold Gross profit on sales Selling and administrative expenses Income before interest expense and income taxes Interest expense Income before income taxes Income tax expense 2019 2018 $850,000 $697,500 552,000 465,000 298,000 232,500 231,000 174,000 67,000 58,500 17,000 13,500 50,000 45,000 10,000 9,000 $40,000 $36,000 Net income Other financial data (thousands of dollars) Cash provided by operating activities Preferred stock dividends $28,000 $24,000 5,000 4,800 Required a. Calculate the following for each year: current ratio, quick ratio, operating-cash-flow-to-current- liabilities ratio (current liabilities were $40,000,000 at January 1, 2018), inventory turnover (inventory was $68,000,000 at January 1, 2018), debt-to-equity ratio, times-interest-earned ratio, return on assets (total assets were $490,000,000 at January 1, 2018), and return on common stockholders' equity (common stockholders' equity was $265,000,000 at January 1, 2018). b. Calculate common-size percentage for each year's income statement. Round answers to two decimal places 2019 2018 Current ratio: 2.13 2.41 0.8 0.82 OX 0 X 6.24 6.64 Quick ratio: Operating-cash-flow-to-current-liabilities ratio: Inventory turnover: Debt-to-equity ratio: Times-interest-earned ratio: Return on assets: Return on common stockholders' equity: 0.73 0.57 4.33 3.94 6.8% 6.97 % 11.83 % 11.35% Round answers to one decimal place. Consolidated Income Statements Year Ended Common- Year Ended 2019 Size 2018 Sales revenue $850,000 100 % $697,500 Cost of goods sold 552,000 64.94% X 465,000 Gross profit on sales 298,000 35.06 % x 232,500 Selling and administrative expenses 231,000 27.18% x 174,000 Income before interest expense and income taxes 67,000 7.88 % x 58,500 Interest expense 17,000 2% 13,500 Income before income taxes 50,000 5.88 % x 45,000 Income tax expense 10,000 1.18 % x 9,000 Net income $40,000 4.71 % x $36,000 Common- Size 100 % 66.67 % x 33.33 % x 14.95 % X 8.39 % X 1.94% X 6.45 % x 1.29 % X 5.16 % x