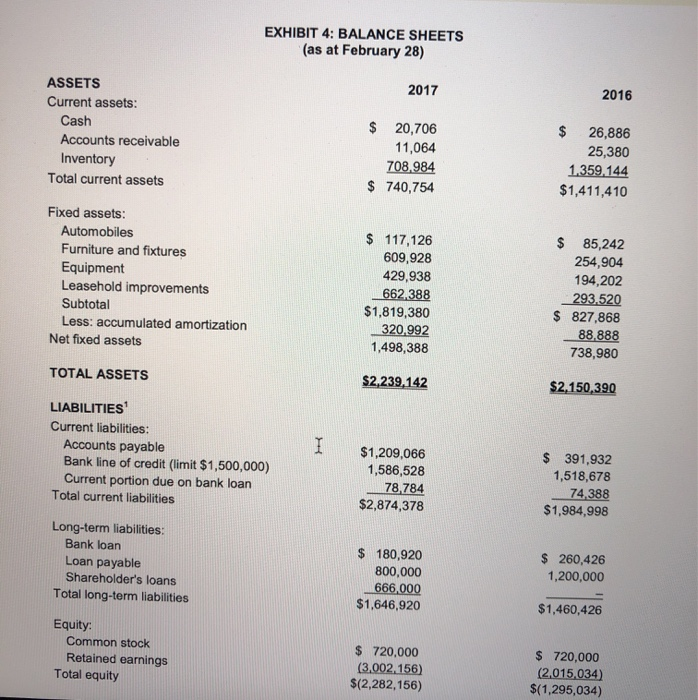
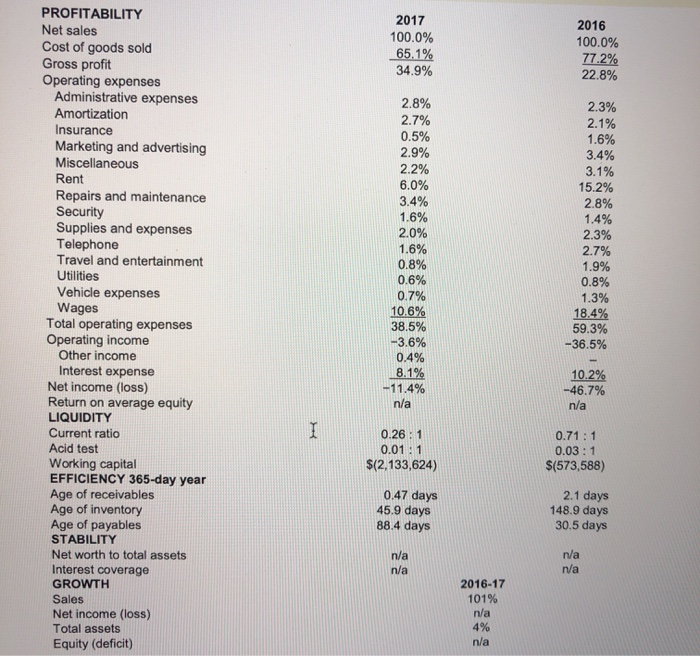
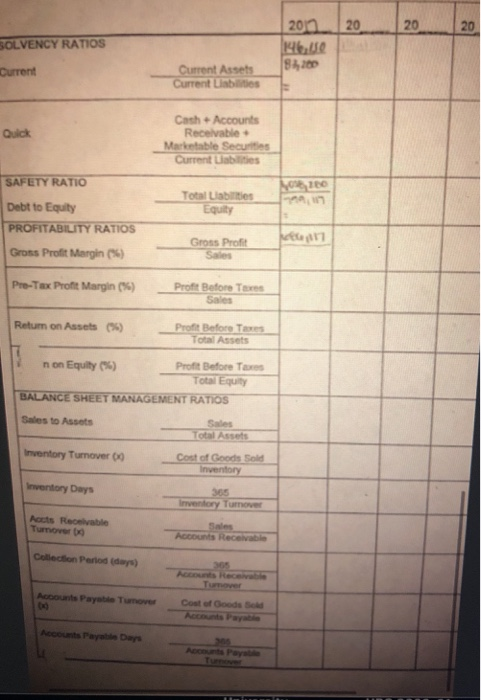
Ratios needed for 2017 and 2016

EXHIBIT 4: BALANCE SHEETS (as at February 28) 2017 2016 ASSETS Current assets: Cash Accounts receivable Inventory Total current assets $ 20,706 11,064 708,984 $ 740,754 $ 26,886 25,380 1.359,144 $1,411,410 Fixed assets: Automobiles Furniture and fixtures Equipment Leasehold improvements Subtotal Less: accumulated amortization Net fixed assets $ 117,126 609,928 429,938 662,388 $1,819,380 320,992 1,498,388 $ 85,242 254,904 194,202 293.520 $ 827,868 88,888 738,980 TOTAL ASSETS $2,239,142 $2,150,390 LIABILITIES Current liabilities: Accounts payable Bank line of credit (limit $1,500,000) Current portion due on bank loan Total current liabilities $1,209,066 1,586,528 78,784 $2,874,378 $ 391,932 1,518,678 74,388 $1,984,998 Long-term liabilities: Bank loan Loan payable Shareholder's loans Total long-term liabilities $ 260,426 1,200,000 $ 180,920 800,000 666,000 $1,646,920 $1,460,426 Equity: Common stock Retained earnings Total equity $ 720,000 (3.002.156) $(2,282,156) $ 720,000 (2,015.034) $(1,295,034) 2017 100.0% 65.1% 34.9% 2016 100.0% 77.2% 22.8% 2.3% 2.1% 3.4% PROFITABILITY Net sales Cost of goods sold Gross profit Operating expenses Administrative expenses Amortization Insurance Marketing and advertising Miscellaneous Rent Repairs and maintenance Security Supplies and expenses Telephone Travel and entertainment Utilities Vehicle expenses Wages Total operating expenses Operating income Other income Interest expense Net income (loss) Return on average equity LIQUIDITY Current ratio Acid test Working capital EFFICIENCY 365-day year Age of receivables Age of inventory Age of payables STABILITY Net worth to total assets Interest coverage GROWTH Sales Net income (loss) Total assets Equity (deficit) 2.8% 2.7% 0.5% 2.9% 2.2% 6.0% 1.6% 2.0% 1.6% 0.8% 0.6% 0.7% 10.6% 38.5% -3.6% 0.4% 1.6% 3.4% 3.1% 15.2% 2.8% 1.4% 2.3% 2.7% 1.9% 0.8% 1.3% 18.4% 59.3% -36.5% 8.1% -11.4% n/a 10.2% -46.7% n/a 0.26 : 1 0.01 : 1 $(2,133,624) 0.71 : 1 0.03 : 1 $(573,588) 0.47 days 45.9 days 88.4 days 2.1 days 148.9 days 30.5 days n/a n/a n/a 2016-17 101% n/a 4% n/a SOLVENCY RATIOS 20020 146.0 80 Current Current Assets Current Liabilities Quick Cash Accounts Receivable Marketable Securities Current Liabilities NI SAFETY RATIO Debt to Equity PROFITABILITY RATIOS Total Labrities Equity Gross Profit M17 Gross Profit Margin (6) Pre-Tex Profit Margin (5) Profit Before Tres Retum on Assets (55) Prof Before Teres Total Assets non Equity (*) Profit Before Taxes Total Equity BALANCE SHEET MANAGEMENT RATIOS Sales to Assets Sales Total Assets Inventory Turnover 00 Cost of Goods Sold Inventory Inventory Days 365 Inventory Turnover Acts Receivable Turnover Accounts Receivable Collection Period (day) Account Payot Tuove cost of Goods Account Pay Day


