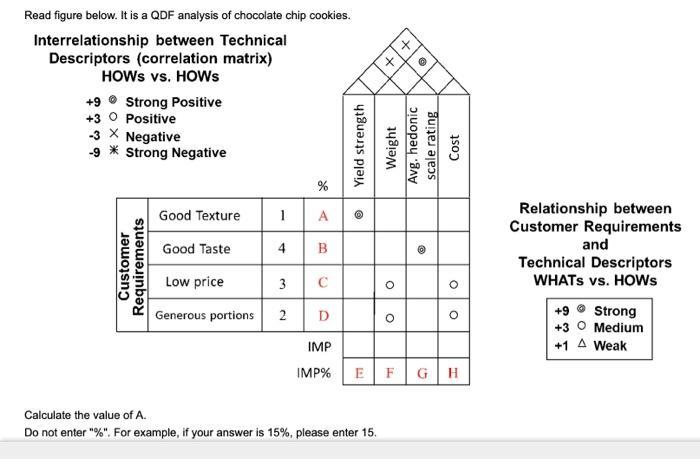
Read figure below. It is a QDF analysis of chocolate chip cookies. Interrelationship between Technical Descriptors (correlation matrix) HOWS vs. HOWS +9 Strong Positive


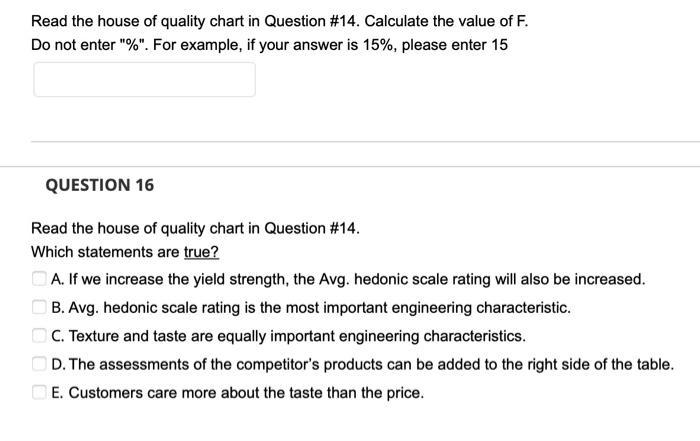
Read figure below. It is a QDF analysis of chocolate chip cookies. Interrelationship between Technical Descriptors (correlation matrix) HOWS vs. HOWS +9 Strong Positive Positive +3 -3 X Negative -9 * Strong Negative Customer Requirements Good Texture Good Taste Low price Generous portions 1 4 3 2 de % A B D @ IMP IMP% E x Yield strength Weight Avg. hedonic scale rating Cost Calculate the value of A. Do not enter "%". For example, if your answer is 15%, please enter 15. O it O O O FGH Relationship between Customer Requirements and Technical Descriptors WHATS vs. HOWS +9 Strong +30 Medium +1 A Weak Read the house of quality chart in Question #14. Calculate the value of F. Do not enter "%". For example, if your answer is 15%, please enter 15 QUESTION 16 Read the house of quality chart in Question #14. Which statements are true? A. If we increase the yield strength, the Avg. hedonic scale rating will also be increased. B. Avg. hedonic scale rating is the most important engineering characteristic. C. Texture and taste are equally important engineering characteristics. D. The assessments of the competitor's products can be added to the right side of the table. E. Customers care more about the taste than the price.
Step by Step Solution
3.58 Rating (179 Votes )
There are 3 Steps involved in it
Step: 1
The detailed answer for the above question is provided below Question 15 What is the value of A A is the relationship strength between Customer Requir...
See step-by-step solutions with expert insights and AI powered tools for academic success
Step: 2

Step: 3

Ace Your Homework with AI
Get the answers you need in no time with our AI-driven, step-by-step assistance
Get Started


