Read the attached case study on Dollar General, and answer the following questions.
- What opportunities does Dollar General highlight as differentiation strategy to boost growth?
- What was the main factor that apparently contributed to the increase in the firms operating profit between 2010 and 2011?
- What are some of the threats that could prevent Dollar General from achieving its vision of growth?
- What financial concerns have been expressed in the case?
- Do you believe that Dollar General was able to pay its short-term or current obligations in 2010 and 2011? Explain.
- Why do you think the company became so indebted, and what could you recommend as a viable alternative to debt?
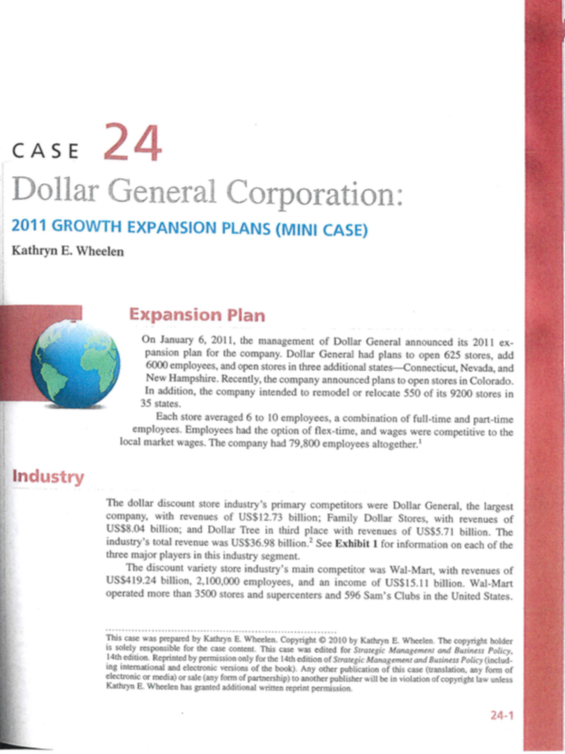
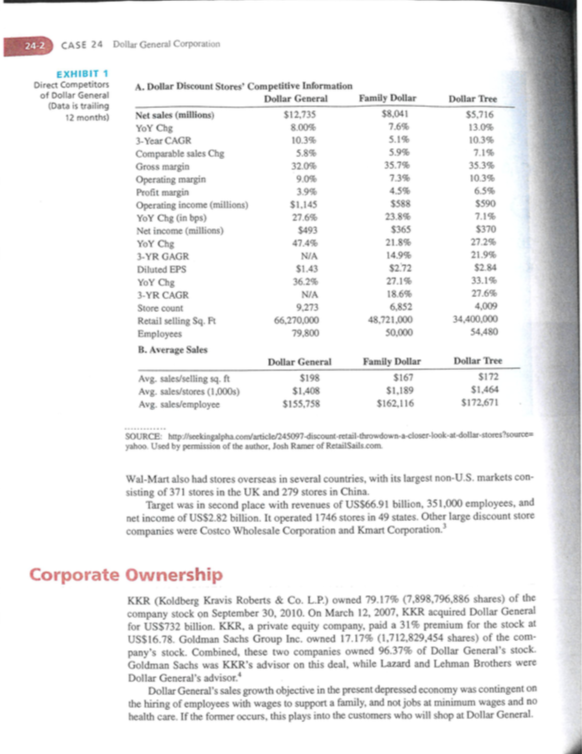
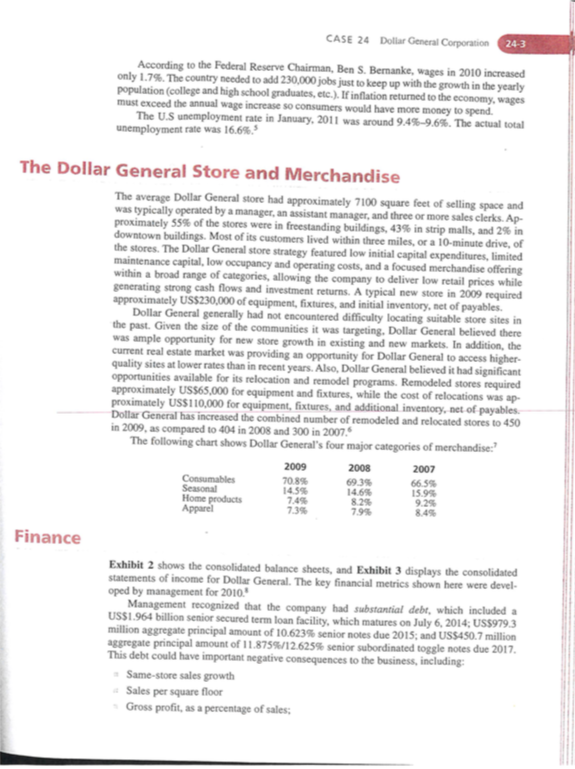
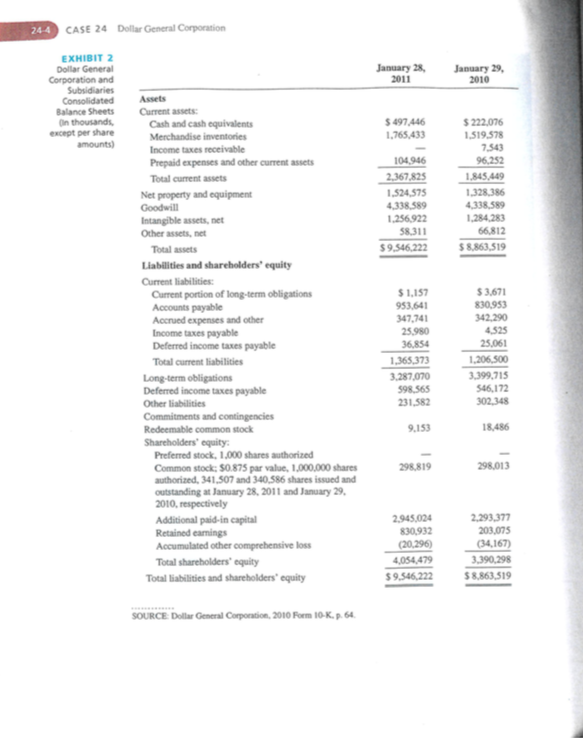
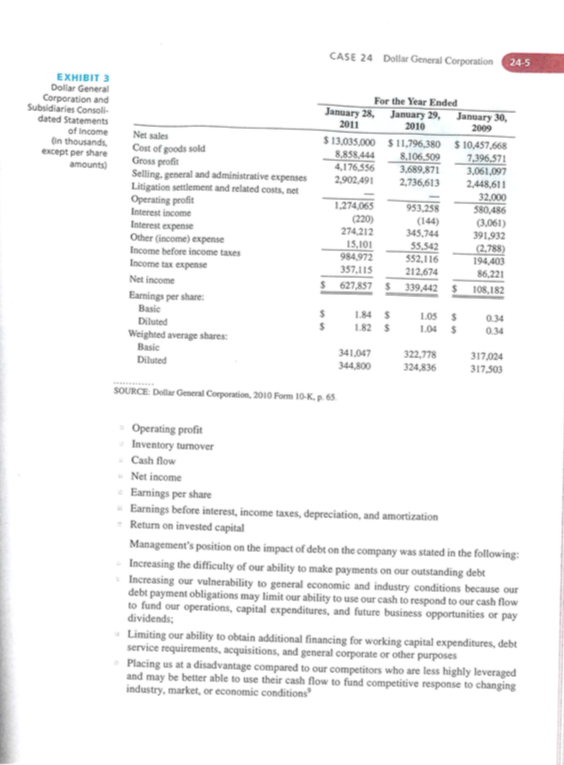
CASE 24 Dollar General Corporation: 2011 GROWTH EXPANSION PLANS (MINI CASE) Kathryn E. Wheelen Expansion Plan On January 6, 2011, the management of Dollar General announced its 2011 ex. pansion plan for the company. Dollar General had plans to open 625 stores, add 6000 employees, and open stores in three additional states-Connecticut, Nevada, and New Hampshire. Recently, the company announced plans to open stores in Colorado In addition, the company intended to remodel or relocate 550 of its 9200 stores in 35 states Each store averaged 6 to 10 employees, a combination of full-time and part-time employees. Employees had the option of flex-time, and wages were competitive to the local market wages. The company had 79,800 employees altogether! Industry The dollar discount store industry's primary competitors were Dollar General, the largest company, with revenues of US$12.73 billion; Family Dollar Stores, with revenues of US$8.04 billion and Dollar Tree in third place with revenues of US$5.71 billion. The industry's total revenue was US$36.98 billion. See Exhibit 1 for information on each of the three major players in this industry segment. The discount variety store industry's main competitor was Wal-Mart, with revenues of US$419.24 billion, 2,100,000 employees, and an income of US$15.11 billion. Wal-Mart operated more than 3500 stores and supercenters and 596 Sam's Clubs in the United States. This case was prepared by Kathryn E. Wheten. Copyright 2010 by Kathryn E. Where. The copyright holder is solely responsible for the case content. This case was edited for Strategic Management and Business Policy 14th edition Reprinted by permission only for the 16th edition of Strategic Management and Business Policy include ing international and electronic versions of the book). Any other publication of this case station, any form of electronic or media or sale (any form of partnership to another publisher will be in violation of copyright lawless Kathryn E. Where has granted to a written reprint permission 24-1 242 CASE 24 Dollar General Corporation EXHIBIT 1 Direct Competitors of Dollar General (Data is trailing 12 months) A. Dollar Discount Stores Competitive Information Dollar General Net sales (millions) $12,735 YoY Chg 8.00% 3-Year CAGR 10.39 Comparable sales Che 5.89 Gross margin 32.09 Operating margin 9.0 Profit margin 3.95 Operating income (millions) $1.145 YoY Chg (in bps) 27.6% Net income (millions) $493 YoY Che 47.45 3-YR GAGR NA Diluted EPS $1.43 YoY che 36.29 3-YR CAGR Store count 9.273 Retail selling Sq. 66,270,000 Employees 79,800 B. Average Sales Dollar General Avg, sale/selling sq.ft $198 Avg, sales/stores (1.000) $1,408 Avg, sales/employee $155,758 Family Dollar $8,041 7.6% 5.19 5.9% 35.79 7.39 4.5% $588 23.8% $365 21.8% 14.99 $2.72 27.15 18.6% 6,852 48,721,000 50.000 Dollar Tree $5,716 13.05 10.35 7.15 35.39 10.39 65 $590 7.15 $370 27.25 21.99 $2.84 33.15 27.6% 4,009 34,400.000 54.480 NA Family Dollar $167 $1,189 $162,116 Dollar Tree $172 $1,464 $172,671 SOURCE: Mpekingalpha.com/article/245097 discount cetail chrowdown-a-closer look at-dollar-stores source yahoo Used by permission of the thor, Josh Ramer of Retail Sails.com Wal-Mart also had stores overseas in several countries, with its largest non-U.S. markets con- sisting of 371 stores in the UK and 279 stores in China. Target was in second place with revenues of US$66.91 billion, 351,000 employees, and net income of US$2.82 billion. It operated 1746 stores in 49 states. Other large discount store companies were Costco Wholesale Corporation and Kmart Corporation.' Corporate Ownership KKR (Koldberg Kravis Roberts & Co. L.P.) owned 79.17% (7,898,796,886 shares) of the company stock on September 30, 2010. On March 12, 2007, KKR acquired Dollar General for US$732 billion. KKR, a private equity company, paid a 31% premium for the stock at US$16.78. Goldman Sachs Group Inc. owned 17.17% (1,712,829,454 shares) of the com pany's stock. Combined, these two companies owned 96,37% of Dollar General's stock. Goldman Sachs was KKR's advisor on this deal, while Lazard and Lehman Brothers were Dollar General's advisor. Dollar General's sales growth objective in the present depressed economy was contingent on the hiring of employees with wages to support a family, and not jobs at minimum wages and no health care. If the former occurs, this plays into the customers who will shop at Dollar General CASE 24 Dollar General Corporation 24-3 According to the Federal Reserve Chairman, Ben S. Beranke, wages in 2010 increased only 1.7%. The country needed to add 230,000 jobs just to keep up with the growth in the yearly population (college and high school graduates, etc.). If inflation returned to the economy, wages must exceed the annual wage increase so consumers would have more money to spend. The U.S unemployment rate in January, 2011 was around 94%-9,6%. The actual total unemployment rate was 16.6%.5 The Dollar General Store and Merchandise The average Dollar General store had approximately 7100 square feet of selling space and was typically operated by a manager, an assistant manager, and three or more sales clerks. Ap- proximately 55% of the stores were in freestanding buildings, 43% in strip malls, and 2% in downtown buildings. Most of its customers lived within three miles, or a 10-minute drive, of the stores. The Dollar General store strategy featured low initial capital expenditures, limited maintenance capital, low occupancy and operating costs, and a focused merchandise offering within a broad range of categories, allowing the company to deliver low retail prices while generating strong cash flows and investment returns. A typical new store in 2009 required approximately US$230,000 of equipment, fixtures, and initial inventory, net of payables. Dollar General generally had not encountered difficulty locating suitable store sites in the past. Given the size of the communities it was targeting, Dollar General believed there was ample opportunity for new store growth in existing and new markets. In addition, the current real estate market was providing an opportunity for Dollar General to access higher quality sites at lower rates than in recent years. Also, Dollar General believed it had significant opportunities available for its relocation and remodel programs. Remodeled stores required approximately US$65,000 for equipment and fixtures, while the cost of relocations was ap- proximately US$110,000 for equipment, fixtures, and additional inventory, net of payables Dollar General has increased the combined number of remodeled and relocated stores to 450 in 2009, as compared to 404 in 2008 and 300 in 2007. The following chart shows Dollar General's four major categories of merchandise: 2009 2008 2007 Consumables 70.89 69.39 66.59 Seasonal 14.59 14.6% 15.99 Home products 7.45 8.25 9.25 Apparel 7.39 795 8.45 Finance Exhibit 2 shows the consolidated balance sheets, and Exhibit 3 displays the consolidated statements of income for Dollar General. The key financial metrics shown here were devel oped by management for 2010, Management recognized that the company had substantial debt, which included a US$1.964 billion senior secured term loan facility, which matures on July 6, 2014; US$9793 million aggregate principal amount of 10.623% senior notes due 2015; and US$450.7 million aggregate principal amount of 11.875%/12.625% senior subordinated toggle notes due 2017 This debt could have important negative consequences to the business, including: Same-store sales growth Sales per square floor Gross profit, as a percentage of sales: 244 CASE 24 Dollar General Corporation January 28, 2011 January 29, 2010 EXHIBIT 2 Dollar General Corporation and Subsidiaries Consolidated Balance Sheets On thousands except per share amounts) $ 497.446 1,765,433 104.946 2,367,825 1,524,575 4,338.589 1.256.922 58,311 59.546.222 $ 222,076 1.519.578 7.543 96.252 1.845.449 1,328,386 4,338.589 1.284,283 66.812 $8.863,519 Assets Current assets: Cash and cash equivalents Merchandise inventories Income taxes receivable Prepaid expenses and other current assets Total current assets Net property and equipment Goodwill Intangible assets, net Other assets, net Total assets Liabilities and shareholders' equity Current liabilities: Current portion of long-term obligations Accounts payable Accrued expenses and other Income taxes payable Deferred income taxes payable Total current liabilities Long-term obligations Deferred income taxes payable Other liabilities Commitments and contingencies Redeemable common stock Shareholders' equity Preferred stock, 1.000 shares authorized Common stock: 50.875 par value, 1.000.000 shares authorized, 341,507 and 340.586 shares issued and outstanding at January 28, 2011 and January 29, 2010, respectively Additional paid in capital Retained earnings Accumulated other comprehensive loss Total shareholders' equity Total liabilities and shareholders' equity $ 1,157 953.641 347,741 25.980 36,854 1,365,373 3.287,070 598.565 231.582 $3,671 830,953 342.290 4.525 25,061 1,206,500 3.399,715 546,172 302.348 9.153 18.486 298,819 298,013 2.945,024 830,932 (20.296 4,054,479 $9.546,222 2.293,377 203.075 (34.167) 3,390,298 58,863,519 SOURCE: Dollar General Corporation, 2010 Form 10-K. 3. 64. CASE 24 Dollar General Corporation 24-5 EXHIBIT 3 Dollar General Corporation and Subsidiaries Consell dated Statements of income On thousands except per share amounts) Net sales Cost of goods sold Gross profit Selling, general and administrative expenses Litigation settlement and related costs, net Operating profit Interest income Interest expense Other (income) expense Income before income taxes Income tax expense Net income Earnings per share Basic Diluted Weighted average shares Basic Diluted For the Year Ended January 28, January 29, January 30, 2011 2010 2009 $ 13,035,000 $11.796,380 $10,457,668 8.858.444 8.106.509 7,396,571 4.176.556 3.689.871 3,061,097 2,902.491 2,736,613 2.448.611 32.000 1.274,065 953.258 580.486 (220) (144) (3.061) 274.212 345.744 391.932 15.101 55.542 (2.788) 984.972 552.116 194,400 357.115 212,674 86,221 $ 627,857 $ 339.442 $ 108,182 $ 1845 1.82 5 1.055 1.045 0.34 034 341,047 344.800 322,778 324,836 317,024 317.500 SOURCE: Dollar General Corporation, 2010 Form 10-K.2.65 Operating profit Inventory turnover Cash flow Net income Earnings per share Earnings before interest, income taxes, depreciation, and amortization Return on invested capital Management's position on the impact of debt on the company was stated in the following: Increasing the difficulty of our ability to make payments on our outstanding debt Increasing our vulnerability to general economic and industry conditions because our debt payment obligations may limit our ability to use our cash to respond to our cash flow to fund our operations, capital expenditures, and future business opportunities or pay dividends; Limiting our ability to obtain additional financing for working capital expenditures, debt service requirements, acquisitions, and general corporate or other purposes Placing us at a disadvantage compared to our competitors who are less highly leveraged and may be better able to use their cash flow to fund competitive response to changing industry, market, or economic conditions CASE 24 Dollar General Corporation: 2011 GROWTH EXPANSION PLANS (MINI CASE) Kathryn E. Wheelen Expansion Plan On January 6, 2011, the management of Dollar General announced its 2011 ex. pansion plan for the company. Dollar General had plans to open 625 stores, add 6000 employees, and open stores in three additional states-Connecticut, Nevada, and New Hampshire. Recently, the company announced plans to open stores in Colorado In addition, the company intended to remodel or relocate 550 of its 9200 stores in 35 states Each store averaged 6 to 10 employees, a combination of full-time and part-time employees. Employees had the option of flex-time, and wages were competitive to the local market wages. The company had 79,800 employees altogether! Industry The dollar discount store industry's primary competitors were Dollar General, the largest company, with revenues of US$12.73 billion; Family Dollar Stores, with revenues of US$8.04 billion and Dollar Tree in third place with revenues of US$5.71 billion. The industry's total revenue was US$36.98 billion. See Exhibit 1 for information on each of the three major players in this industry segment. The discount variety store industry's main competitor was Wal-Mart, with revenues of US$419.24 billion, 2,100,000 employees, and an income of US$15.11 billion. Wal-Mart operated more than 3500 stores and supercenters and 596 Sam's Clubs in the United States. This case was prepared by Kathryn E. Wheten. Copyright 2010 by Kathryn E. Where. The copyright holder is solely responsible for the case content. This case was edited for Strategic Management and Business Policy 14th edition Reprinted by permission only for the 16th edition of Strategic Management and Business Policy include ing international and electronic versions of the book). Any other publication of this case station, any form of electronic or media or sale (any form of partnership to another publisher will be in violation of copyright lawless Kathryn E. Where has granted to a written reprint permission 24-1 242 CASE 24 Dollar General Corporation EXHIBIT 1 Direct Competitors of Dollar General (Data is trailing 12 months) A. Dollar Discount Stores Competitive Information Dollar General Net sales (millions) $12,735 YoY Chg 8.00% 3-Year CAGR 10.39 Comparable sales Che 5.89 Gross margin 32.09 Operating margin 9.0 Profit margin 3.95 Operating income (millions) $1.145 YoY Chg (in bps) 27.6% Net income (millions) $493 YoY Che 47.45 3-YR GAGR NA Diluted EPS $1.43 YoY che 36.29 3-YR CAGR Store count 9.273 Retail selling Sq. 66,270,000 Employees 79,800 B. Average Sales Dollar General Avg, sale/selling sq.ft $198 Avg, sales/stores (1.000) $1,408 Avg, sales/employee $155,758 Family Dollar $8,041 7.6% 5.19 5.9% 35.79 7.39 4.5% $588 23.8% $365 21.8% 14.99 $2.72 27.15 18.6% 6,852 48,721,000 50.000 Dollar Tree $5,716 13.05 10.35 7.15 35.39 10.39 65 $590 7.15 $370 27.25 21.99 $2.84 33.15 27.6% 4,009 34,400.000 54.480 NA Family Dollar $167 $1,189 $162,116 Dollar Tree $172 $1,464 $172,671 SOURCE: Mpekingalpha.com/article/245097 discount cetail chrowdown-a-closer look at-dollar-stores source yahoo Used by permission of the thor, Josh Ramer of Retail Sails.com Wal-Mart also had stores overseas in several countries, with its largest non-U.S. markets con- sisting of 371 stores in the UK and 279 stores in China. Target was in second place with revenues of US$66.91 billion, 351,000 employees, and net income of US$2.82 billion. It operated 1746 stores in 49 states. Other large discount store companies were Costco Wholesale Corporation and Kmart Corporation.' Corporate Ownership KKR (Koldberg Kravis Roberts & Co. L.P.) owned 79.17% (7,898,796,886 shares) of the company stock on September 30, 2010. On March 12, 2007, KKR acquired Dollar General for US$732 billion. KKR, a private equity company, paid a 31% premium for the stock at US$16.78. Goldman Sachs Group Inc. owned 17.17% (1,712,829,454 shares) of the com pany's stock. Combined, these two companies owned 96,37% of Dollar General's stock. Goldman Sachs was KKR's advisor on this deal, while Lazard and Lehman Brothers were Dollar General's advisor. Dollar General's sales growth objective in the present depressed economy was contingent on the hiring of employees with wages to support a family, and not jobs at minimum wages and no health care. If the former occurs, this plays into the customers who will shop at Dollar General CASE 24 Dollar General Corporation 24-3 According to the Federal Reserve Chairman, Ben S. Beranke, wages in 2010 increased only 1.7%. The country needed to add 230,000 jobs just to keep up with the growth in the yearly population (college and high school graduates, etc.). If inflation returned to the economy, wages must exceed the annual wage increase so consumers would have more money to spend. The U.S unemployment rate in January, 2011 was around 94%-9,6%. The actual total unemployment rate was 16.6%.5 The Dollar General Store and Merchandise The average Dollar General store had approximately 7100 square feet of selling space and was typically operated by a manager, an assistant manager, and three or more sales clerks. Ap- proximately 55% of the stores were in freestanding buildings, 43% in strip malls, and 2% in downtown buildings. Most of its customers lived within three miles, or a 10-minute drive, of the stores. The Dollar General store strategy featured low initial capital expenditures, limited maintenance capital, low occupancy and operating costs, and a focused merchandise offering within a broad range of categories, allowing the company to deliver low retail prices while generating strong cash flows and investment returns. A typical new store in 2009 required approximately US$230,000 of equipment, fixtures, and initial inventory, net of payables. Dollar General generally had not encountered difficulty locating suitable store sites in the past. Given the size of the communities it was targeting, Dollar General believed there was ample opportunity for new store growth in existing and new markets. In addition, the current real estate market was providing an opportunity for Dollar General to access higher quality sites at lower rates than in recent years. Also, Dollar General believed it had significant opportunities available for its relocation and remodel programs. Remodeled stores required approximately US$65,000 for equipment and fixtures, while the cost of relocations was ap- proximately US$110,000 for equipment, fixtures, and additional inventory, net of payables Dollar General has increased the combined number of remodeled and relocated stores to 450 in 2009, as compared to 404 in 2008 and 300 in 2007. The following chart shows Dollar General's four major categories of merchandise: 2009 2008 2007 Consumables 70.89 69.39 66.59 Seasonal 14.59 14.6% 15.99 Home products 7.45 8.25 9.25 Apparel 7.39 795 8.45 Finance Exhibit 2 shows the consolidated balance sheets, and Exhibit 3 displays the consolidated statements of income for Dollar General. The key financial metrics shown here were devel oped by management for 2010, Management recognized that the company had substantial debt, which included a US$1.964 billion senior secured term loan facility, which matures on July 6, 2014; US$9793 million aggregate principal amount of 10.623% senior notes due 2015; and US$450.7 million aggregate principal amount of 11.875%/12.625% senior subordinated toggle notes due 2017 This debt could have important negative consequences to the business, including: Same-store sales growth Sales per square floor Gross profit, as a percentage of sales: 244 CASE 24 Dollar General Corporation January 28, 2011 January 29, 2010 EXHIBIT 2 Dollar General Corporation and Subsidiaries Consolidated Balance Sheets On thousands except per share amounts) $ 497.446 1,765,433 104.946 2,367,825 1,524,575 4,338.589 1.256.922 58,311 59.546.222 $ 222,076 1.519.578 7.543 96.252 1.845.449 1,328,386 4,338.589 1.284,283 66.812 $8.863,519 Assets Current assets: Cash and cash equivalents Merchandise inventories Income taxes receivable Prepaid expenses and other current assets Total current assets Net property and equipment Goodwill Intangible assets, net Other assets, net Total assets Liabilities and shareholders' equity Current liabilities: Current portion of long-term obligations Accounts payable Accrued expenses and other Income taxes payable Deferred income taxes payable Total current liabilities Long-term obligations Deferred income taxes payable Other liabilities Commitments and contingencies Redeemable common stock Shareholders' equity Preferred stock, 1.000 shares authorized Common stock: 50.875 par value, 1.000.000 shares authorized, 341,507 and 340.586 shares issued and outstanding at January 28, 2011 and January 29, 2010, respectively Additional paid in capital Retained earnings Accumulated other comprehensive loss Total shareholders' equity Total liabilities and shareholders' equity $ 1,157 953.641 347,741 25.980 36,854 1,365,373 3.287,070 598.565 231.582 $3,671 830,953 342.290 4.525 25,061 1,206,500 3.399,715 546,172 302.348 9.153 18.486 298,819 298,013 2.945,024 830,932 (20.296 4,054,479 $9.546,222 2.293,377 203.075 (34.167) 3,390,298 58,863,519 SOURCE: Dollar General Corporation, 2010 Form 10-K. 3. 64. CASE 24 Dollar General Corporation 24-5 EXHIBIT 3 Dollar General Corporation and Subsidiaries Consell dated Statements of income On thousands except per share amounts) Net sales Cost of goods sold Gross profit Selling, general and administrative expenses Litigation settlement and related costs, net Operating profit Interest income Interest expense Other (income) expense Income before income taxes Income tax expense Net income Earnings per share Basic Diluted Weighted average shares Basic Diluted For the Year Ended January 28, January 29, January 30, 2011 2010 2009 $ 13,035,000 $11.796,380 $10,457,668 8.858.444 8.106.509 7,396,571 4.176.556 3.689.871 3,061,097 2,902.491 2,736,613 2.448.611 32.000 1.274,065 953.258 580.486 (220) (144) (3.061) 274.212 345.744 391.932 15.101 55.542 (2.788) 984.972 552.116 194,400 357.115 212,674 86,221 $ 627,857 $ 339.442 $ 108,182 $ 1845 1.82 5 1.055 1.045 0.34 034 341,047 344.800 322,778 324,836 317,024 317.500 SOURCE: Dollar General Corporation, 2010 Form 10-K.2.65 Operating profit Inventory turnover Cash flow Net income Earnings per share Earnings before interest, income taxes, depreciation, and amortization Return on invested capital Management's position on the impact of debt on the company was stated in the following: Increasing the difficulty of our ability to make payments on our outstanding debt Increasing our vulnerability to general economic and industry conditions because our debt payment obligations may limit our ability to use our cash to respond to our cash flow to fund our operations, capital expenditures, and future business opportunities or pay dividends; Limiting our ability to obtain additional financing for working capital expenditures, debt service requirements, acquisitions, and general corporate or other purposes Placing us at a disadvantage compared to our competitors who are less highly leveraged and may be better able to use their cash flow to fund competitive response to changing industry, market, or economic conditions


