

Question
read the case, look at the table I provided and please answer question #1 PART A AND PART B PLEASE. explain what the answer mean
read the case, look at the table I provided and please answer question #1 PART A AND PART B PLEASE. explain what the answer mean ans the use and purpose of it please. I will give thumbs up. pls give right answer....also for question #1 the part B do not use Excel and do it on paper and do statistics on paper and give answer pls. thank u very much.
zoom into the pics of u can't see em.
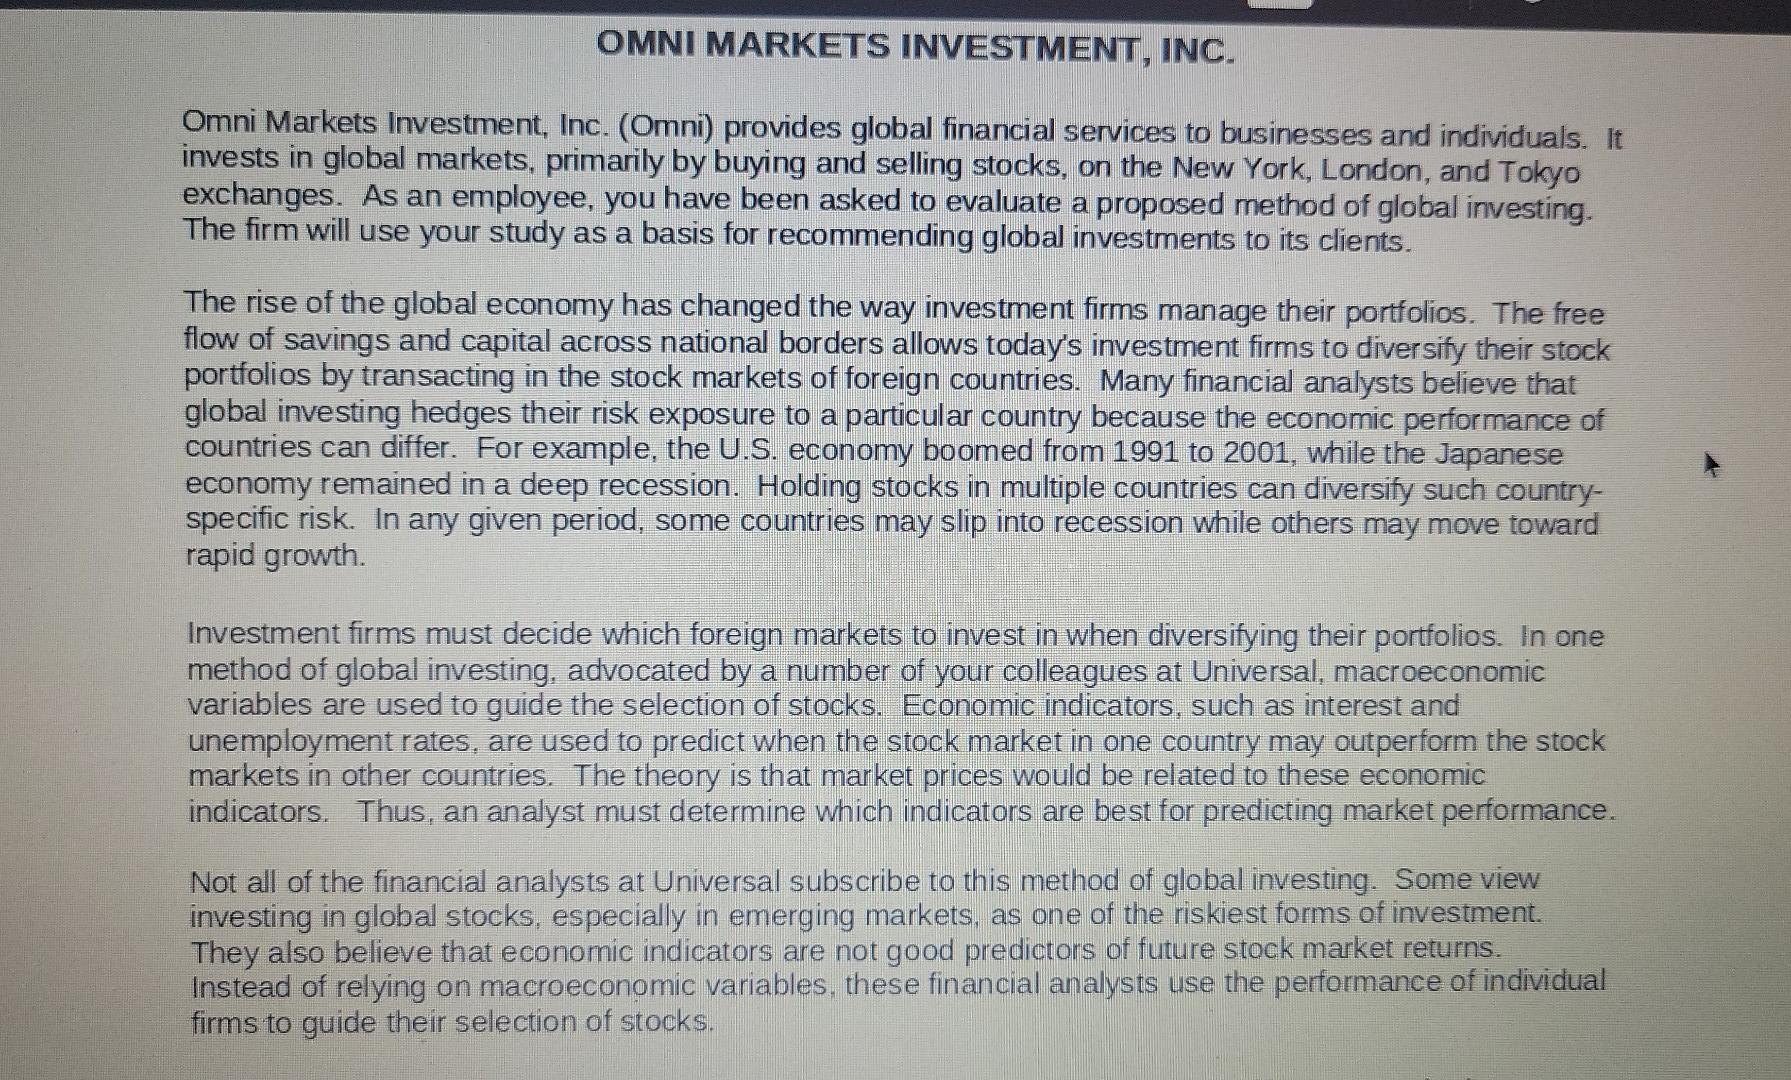
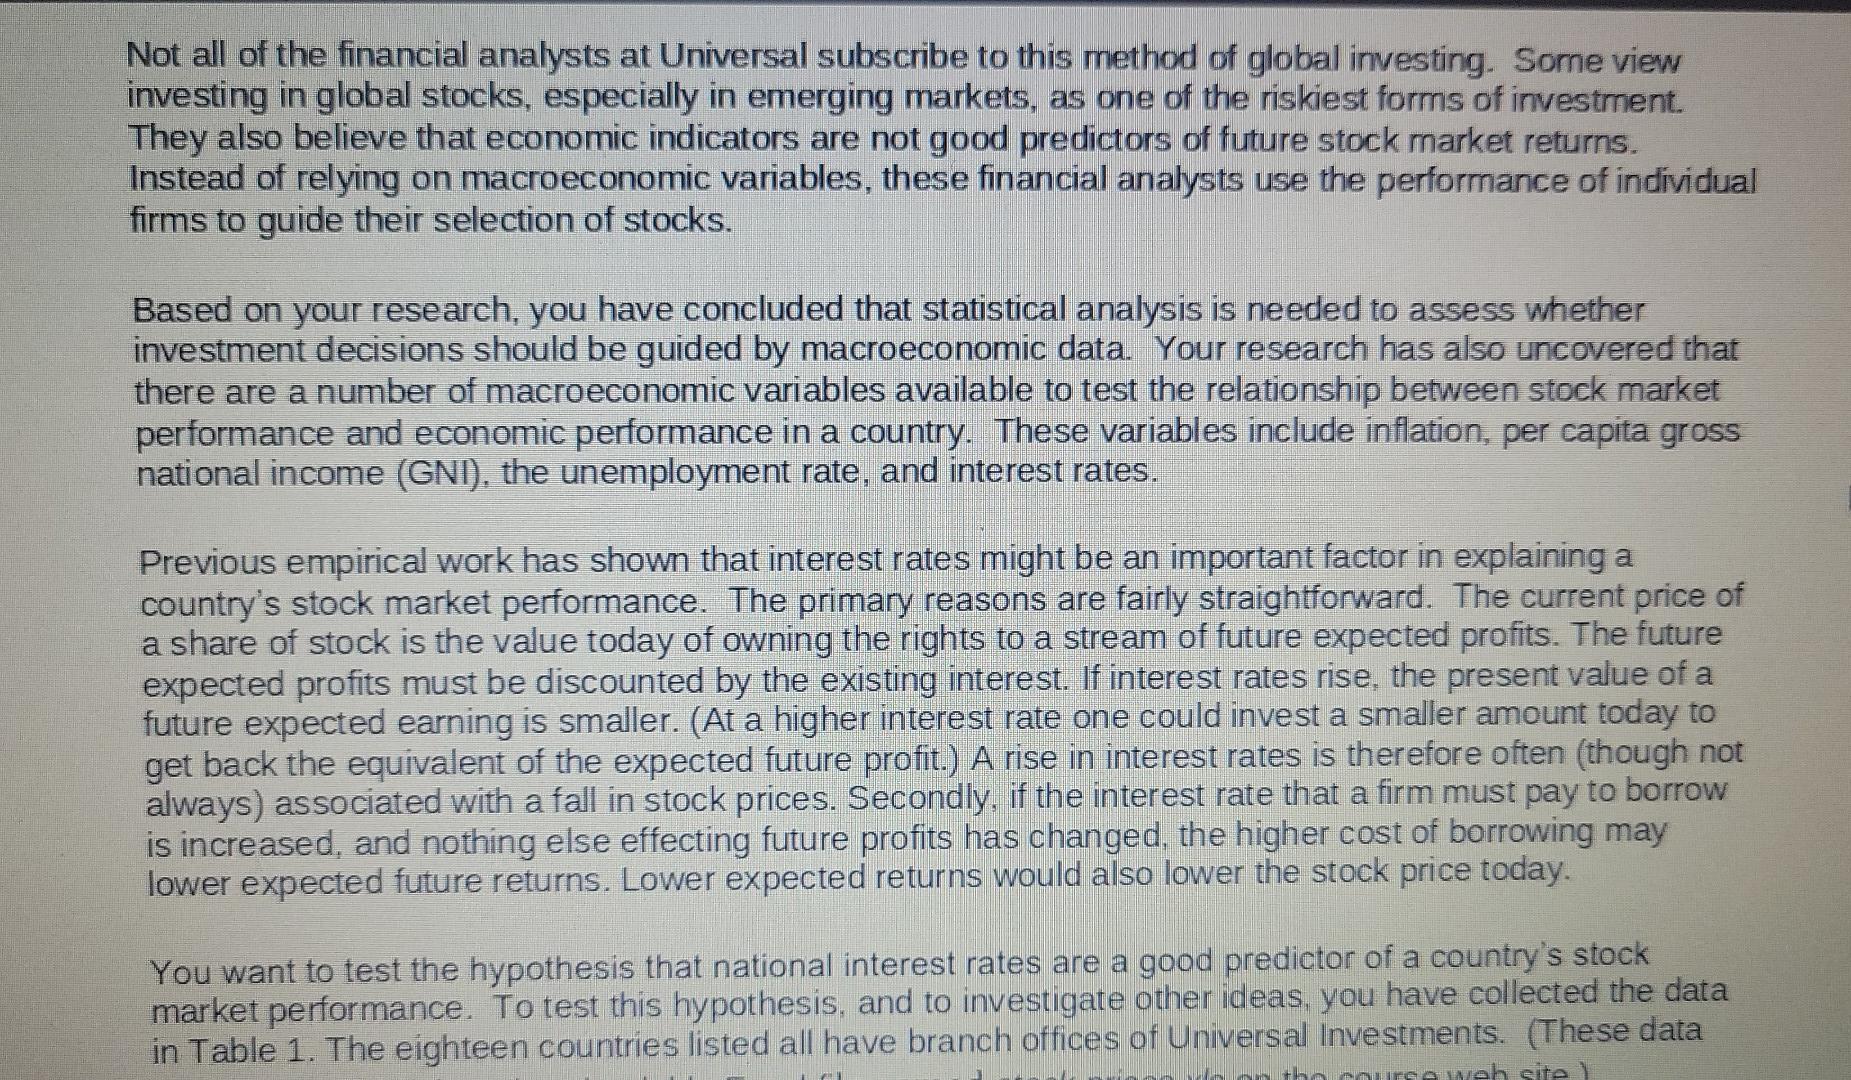
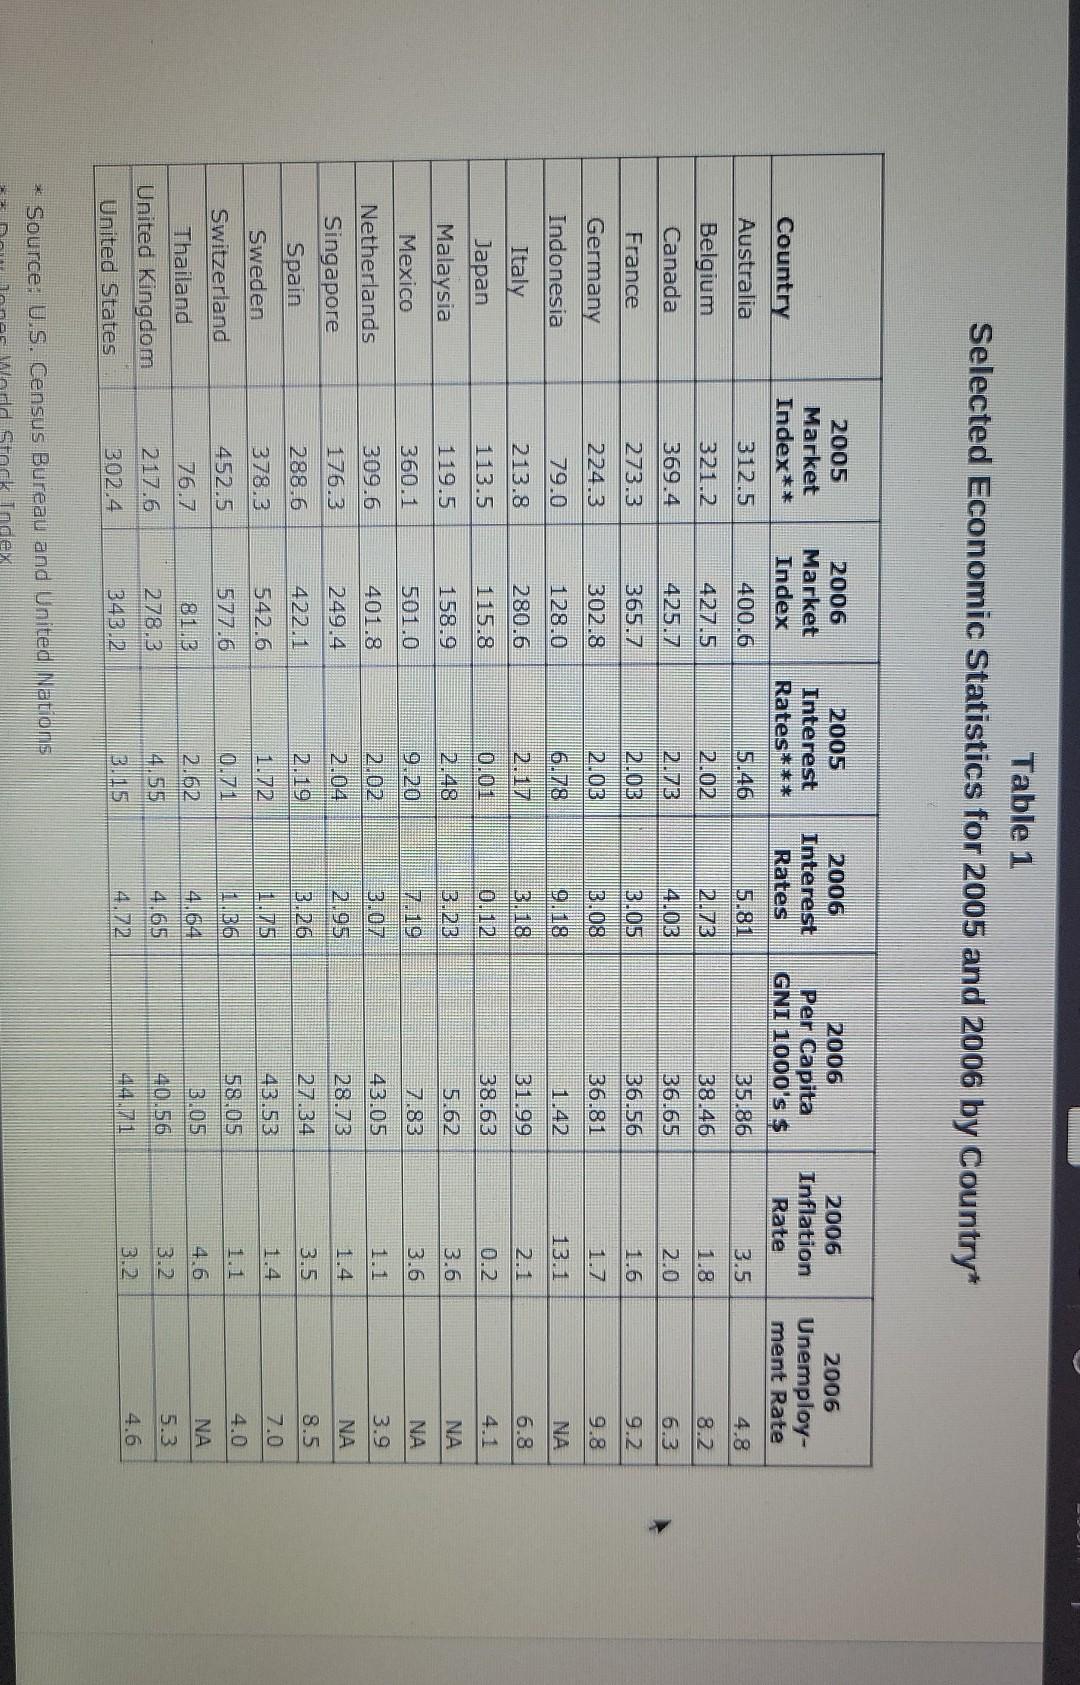
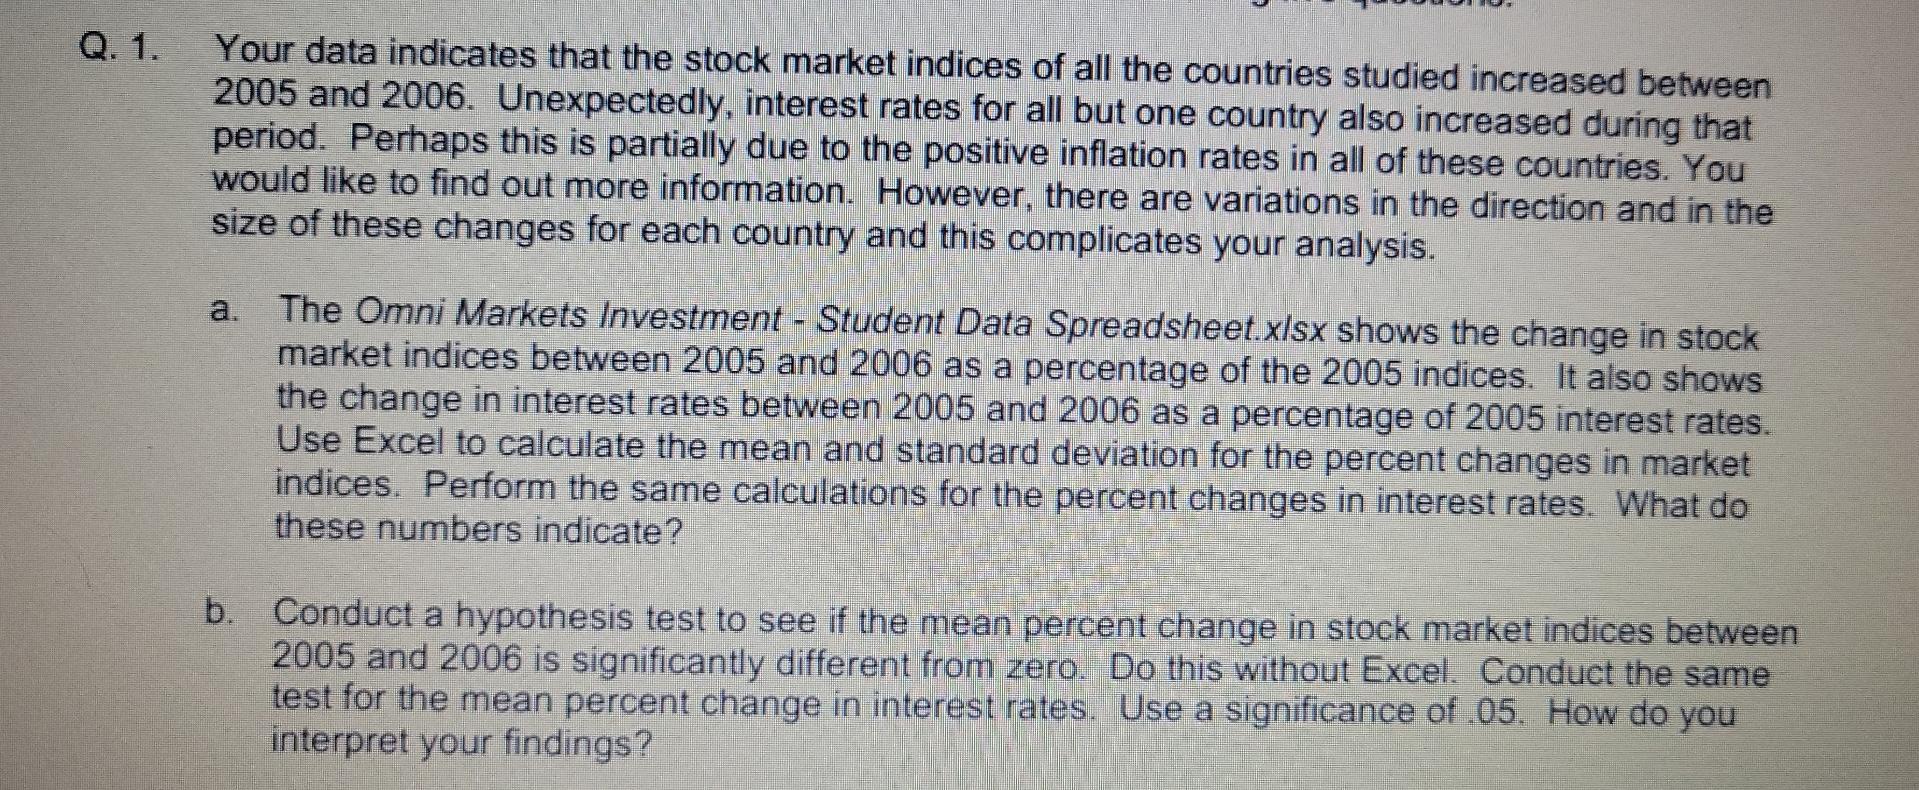
OMNI MARKETS INVESTMENT, INC. Omni Markets Investment, Inc. (Omni) provides global financial services to businesses and individuals. It invests in global markets, primarily by buying and selling stocks, on the New York, London, and Tokyo exchanges. As an employee, you have been asked to evaluate a proposed method of global investing. The firm will use your study as a basis for recommending global investments to its clients. The rise of the global economy has changed the way investment firms manage their portfolios. The free flow of savings and capital across national borders allows today's investment firms to diversify their stock portfolios by transacting in the stock markets of foreign countries. Many financial analysts believe that global investing hedges their risk exposure to a particular country because the economic performance of countries can differ. For example, the U.S. economy boomed from 1991 to 2001, while the Japanese economy remained in a deep recession. Holding stocks in multiple countries can diversity such country- specific risk. In any given period, some countries may slip into recession while others may move toward rapid growth Investment firms must decide which foreign markets to invest in when diversifying their portfolios. In one method of global investing, advocated by a number of your colleagues at Universal, macroeconomic variables are used to guide the selection of stocks. Economic indicators, such as interest and unemployment rates, are used to predict when the stock market in one country may outperform the stock markets in other countries. The theory is that market prices would be related to these economic indicators. Thus, an analyst must determine which indicators are best for predicting market performance. Not all of the financial analysts at Universal subscribe to this method of global investing. Some view investing in global stocks, especially in emerging markets, as one of the riskiest forms of investment. They also believe that economic indicators are not good predictors of future stock market returns. Instead of relying on macroeconomic variables, these financial analysts use the performance of individual firms to guide their selection of stocks. Not all of the financial analysts at Universal subscribe to this method of global investing. Some view investing in global stocks, especially in emerging markets, as one of the riskiest forms of investment. They also believe that economic indicators are not good predictors of future stock market returns. Instead of relying on macroeconomic variables, these financial analysts use the performance of individual firms to guide their selection of stocks. Based on your research, you have concluded that statistical analysis is needed to assess whether investment decisions should be guided by macroeconomic data. Your research has also uncovered that there are a number of macroeconomic variables available to test the relationship between stock market performance and economic performance in a country. These variables include inflation, per capita gross national income (GNT), the unemployment rate, and interest rates. Previous empirical work has shown that interest rates might be an important factor in explaining a country's stock market performance. The primary reasons are fairly straightforward. The current price of a share of stock is the value today of owning the rights to a stream of future expected profits. The future expected profits must be discounted by the existing interest. If interest rates rise, the present value of a future expected earning is smaller. (At a higher interest rate one could invest a smaller amount today to get back the equivalent of the expected future profit.) A rise in interest rates is therefore often though not always) associated with a fall in stock prices. Secondly, if the interest rate that a firm must pay to borrow is increased, and nothing else effecting future profits has changed, the higher cost of borrowing may lower expected future returns. Lower expected returns would also lower the stock price today. You want to test the hypothesis that national interest rates are a good predictor of a country's stock market performance. To test this hypothesis, and to investigate other ideas, you have collected the data in Table 1. The eighteen countries listed all have branch offices of Universal Investments. (These data the course web site ) Table 1 Selected Economic Statistics for 2005 and 2006 by Country* 2005 Market Index** 2006 Market Index 2005 Interest Rates*** 2006 Interest Rates 2006 Per Capita GNI 1000's $ 2006 Inflation Rate 2006 Unemploy- ment Rate Country Australia 312.5 400.6 5.46 5.81 3.5 4.8 35.86 38.46 321.2 427.5 2.02 2.73 1.8 8.2 Belgium Canada 369.4 425.7 2.73 410B 36.65 2.0 6.3 France 273.3 365.7 20 3.05 36.56 1.6 9.2 224.3 302.8 2.03 3.08 36.81 1.7 9.8 Germany Indonesia 79.0 128.0 6.78 9118 1.42 13.1 NA 213.8 280.6 2.17 3.18 31.99 2.1 6.8 113.5 115.8 0.01 0.12 38.63 0.2 4.1 Italy Japan Malaysia Mexico 119.5 158.9 2.48 3.2B 5.62 3.6 NA 360.1 501.0 9.20 7.19 7.83 3.6 NA 401.8 Netherlands 2.02 3.07 1.1 3.9 309.6 176.3 43.05 28.73 2.04 249.4 2195 NA 1.4 Singapore Spain Sweden 2.19 422.1 288.6 8.5 3.5 3.26 27.34 7.0 542.6 378.3 1.4 43.53 1072 1.75 11.06 4.0 1.1 452.5 58.05 577.6 071 BOS 81.3 NA 4.6 Switzerland Thailand United Kingdom United States 76.7 217.6 4.64 4.65 3.2 40.56 2.62 4.55 3.15 5.3 278.3 4.6 3.2 44.71 4.72 2432 302.4 * Source: U.S. Census Bureau and United Nations Stock Index Q.1. Your data indicates that the stock market indices of all the countries studied increased between 2005 and 2006. Unexpectedly, interest rates for all but one country also increased during that period. Perhaps this is partially due to the positive inflation rates in all of these countries. You would like to find out more information. However, there are variations in the direction and in the size of these changes for each country and this complicates your analysis. The Omni Markets Investment - Student Data Spreadsheet.xlsx shows the change in stock market indices between 2005 and 2006 as a percentage of the 2005 indices. It also shows the change in interest rates between 2005 and 2006 as a percentage of 2005 interest rates. Use Excel to calculate the mean and standard deviation for the percent changes in market indices. Perform the same calculations for the percent changes in interest rates. What do these numbers indicate? b. Conduct a hypothesis test to see if the mean percent change in stock market indices between 2005 and 2006 is significantly different from zero. Do this without Excel. Conduct the same test for the mean percent change in interest rates. Use a significance of .05. How do you interpret your findings? OMNI MARKETS INVESTMENT, INC. Omni Markets Investment, Inc. (Omni) provides global financial services to businesses and individuals. It invests in global markets, primarily by buying and selling stocks, on the New York, London, and Tokyo exchanges. As an employee, you have been asked to evaluate a proposed method of global investing. The firm will use your study as a basis for recommending global investments to its clients. The rise of the global economy has changed the way investment firms manage their portfolios. The free flow of savings and capital across national borders allows today's investment firms to diversify their stock portfolios by transacting in the stock markets of foreign countries. Many financial analysts believe that global investing hedges their risk exposure to a particular country because the economic performance of countries can differ. For example, the U.S. economy boomed from 1991 to 2001, while the Japanese economy remained in a deep recession. Holding stocks in multiple countries can diversity such country- specific risk. In any given period, some countries may slip into recession while others may move toward rapid growth Investment firms must decide which foreign markets to invest in when diversifying their portfolios. In one method of global investing, advocated by a number of your colleagues at Universal, macroeconomic variables are used to guide the selection of stocks. Economic indicators, such as interest and unemployment rates, are used to predict when the stock market in one country may outperform the stock markets in other countries. The theory is that market prices would be related to these economic indicators. Thus, an analyst must determine which indicators are best for predicting market performance. Not all of the financial analysts at Universal subscribe to this method of global investing. Some view investing in global stocks, especially in emerging markets, as one of the riskiest forms of investment. They also believe that economic indicators are not good predictors of future stock market returns. Instead of relying on macroeconomic variables, these financial analysts use the performance of individual firms to guide their selection of stocks. Not all of the financial analysts at Universal subscribe to this method of global investing. Some view investing in global stocks, especially in emerging markets, as one of the riskiest forms of investment. They also believe that economic indicators are not good predictors of future stock market returns. Instead of relying on macroeconomic variables, these financial analysts use the performance of individual firms to guide their selection of stocks. Based on your research, you have concluded that statistical analysis is needed to assess whether investment decisions should be guided by macroeconomic data. Your research has also uncovered that there are a number of macroeconomic variables available to test the relationship between stock market performance and economic performance in a country. These variables include inflation, per capita gross national income (GNT), the unemployment rate, and interest rates. Previous empirical work has shown that interest rates might be an important factor in explaining a country's stock market performance. The primary reasons are fairly straightforward. The current price of a share of stock is the value today of owning the rights to a stream of future expected profits. The future expected profits must be discounted by the existing interest. If interest rates rise, the present value of a future expected earning is smaller. (At a higher interest rate one could invest a smaller amount today to get back the equivalent of the expected future profit.) A rise in interest rates is therefore often though not always) associated with a fall in stock prices. Secondly, if the interest rate that a firm must pay to borrow is increased, and nothing else effecting future profits has changed, the higher cost of borrowing may lower expected future returns. Lower expected returns would also lower the stock price today. You want to test the hypothesis that national interest rates are a good predictor of a country's stock market performance. To test this hypothesis, and to investigate other ideas, you have collected the data in Table 1. The eighteen countries listed all have branch offices of Universal Investments. (These data the course web site ) Table 1 Selected Economic Statistics for 2005 and 2006 by Country* 2005 Market Index** 2006 Market Index 2005 Interest Rates*** 2006 Interest Rates 2006 Per Capita GNI 1000's $ 2006 Inflation Rate 2006 Unemploy- ment Rate Country Australia 312.5 400.6 5.46 5.81 3.5 4.8 35.86 38.46 321.2 427.5 2.02 2.73 1.8 8.2 Belgium Canada 369.4 425.7 2.73 410B 36.65 2.0 6.3 France 273.3 365.7 20 3.05 36.56 1.6 9.2 224.3 302.8 2.03 3.08 36.81 1.7 9.8 Germany Indonesia 79.0 128.0 6.78 9118 1.42 13.1 NA 213.8 280.6 2.17 3.18 31.99 2.1 6.8 113.5 115.8 0.01 0.12 38.63 0.2 4.1 Italy Japan Malaysia Mexico 119.5 158.9 2.48 3.2B 5.62 3.6 NA 360.1 501.0 9.20 7.19 7.83 3.6 NA 401.8 Netherlands 2.02 3.07 1.1 3.9 309.6 176.3 43.05 28.73 2.04 249.4 2195 NA 1.4 Singapore Spain Sweden 2.19 422.1 288.6 8.5 3.5 3.26 27.34 7.0 542.6 378.3 1.4 43.53 1072 1.75 11.06 4.0 1.1 452.5 58.05 577.6 071 BOS 81.3 NA 4.6 Switzerland Thailand United Kingdom United States 76.7 217.6 4.64 4.65 3.2 40.56 2.62 4.55 3.15 5.3 278.3 4.6 3.2 44.71 4.72 2432 302.4 * Source: U.S. Census Bureau and United Nations Stock Index Q.1. Your data indicates that the stock market indices of all the countries studied increased between 2005 and 2006. Unexpectedly, interest rates for all but one country also increased during that period. Perhaps this is partially due to the positive inflation rates in all of these countries. You would like to find out more information. However, there are variations in the direction and in the size of these changes for each country and this complicates your analysis. The Omni Markets Investment - Student Data Spreadsheet.xlsx shows the change in stock market indices between 2005 and 2006 as a percentage of the 2005 indices. It also shows the change in interest rates between 2005 and 2006 as a percentage of 2005 interest rates. Use Excel to calculate the mean and standard deviation for the percent changes in market indices. Perform the same calculations for the percent changes in interest rates. What do these numbers indicate? b. Conduct a hypothesis test to see if the mean percent change in stock market indices between 2005 and 2006 is significantly different from zero. Do this without Excel. Conduct the same test for the mean percent change in interest rates. Use a significance of .05. How do you interpret your findingsStep by Step Solution
There are 3 Steps involved in it
Step: 1

Get Instant Access to Expert-Tailored Solutions
See step-by-step solutions with expert insights and AI powered tools for academic success
Step: 2

Step: 3
Ace Your Homework with AI
Get the answers you need in no time with our AI-driven, step-by-step assistance
Get Started
Digital Finance Bits And Bytes The Road Ahead
Authors: Vasant Chintaman Joshi
1st Edition