Read the case study and answer these questions
- To establish a baseline for future improvements, CRC Industries have collected data from four categories of failure, what are they?
- What does cost of quality means? Why it is important?
- CRC Industries used Quality Incident Database to track Quality incidents that they catch and correct prior to shipping Product, what are these quality incidents?
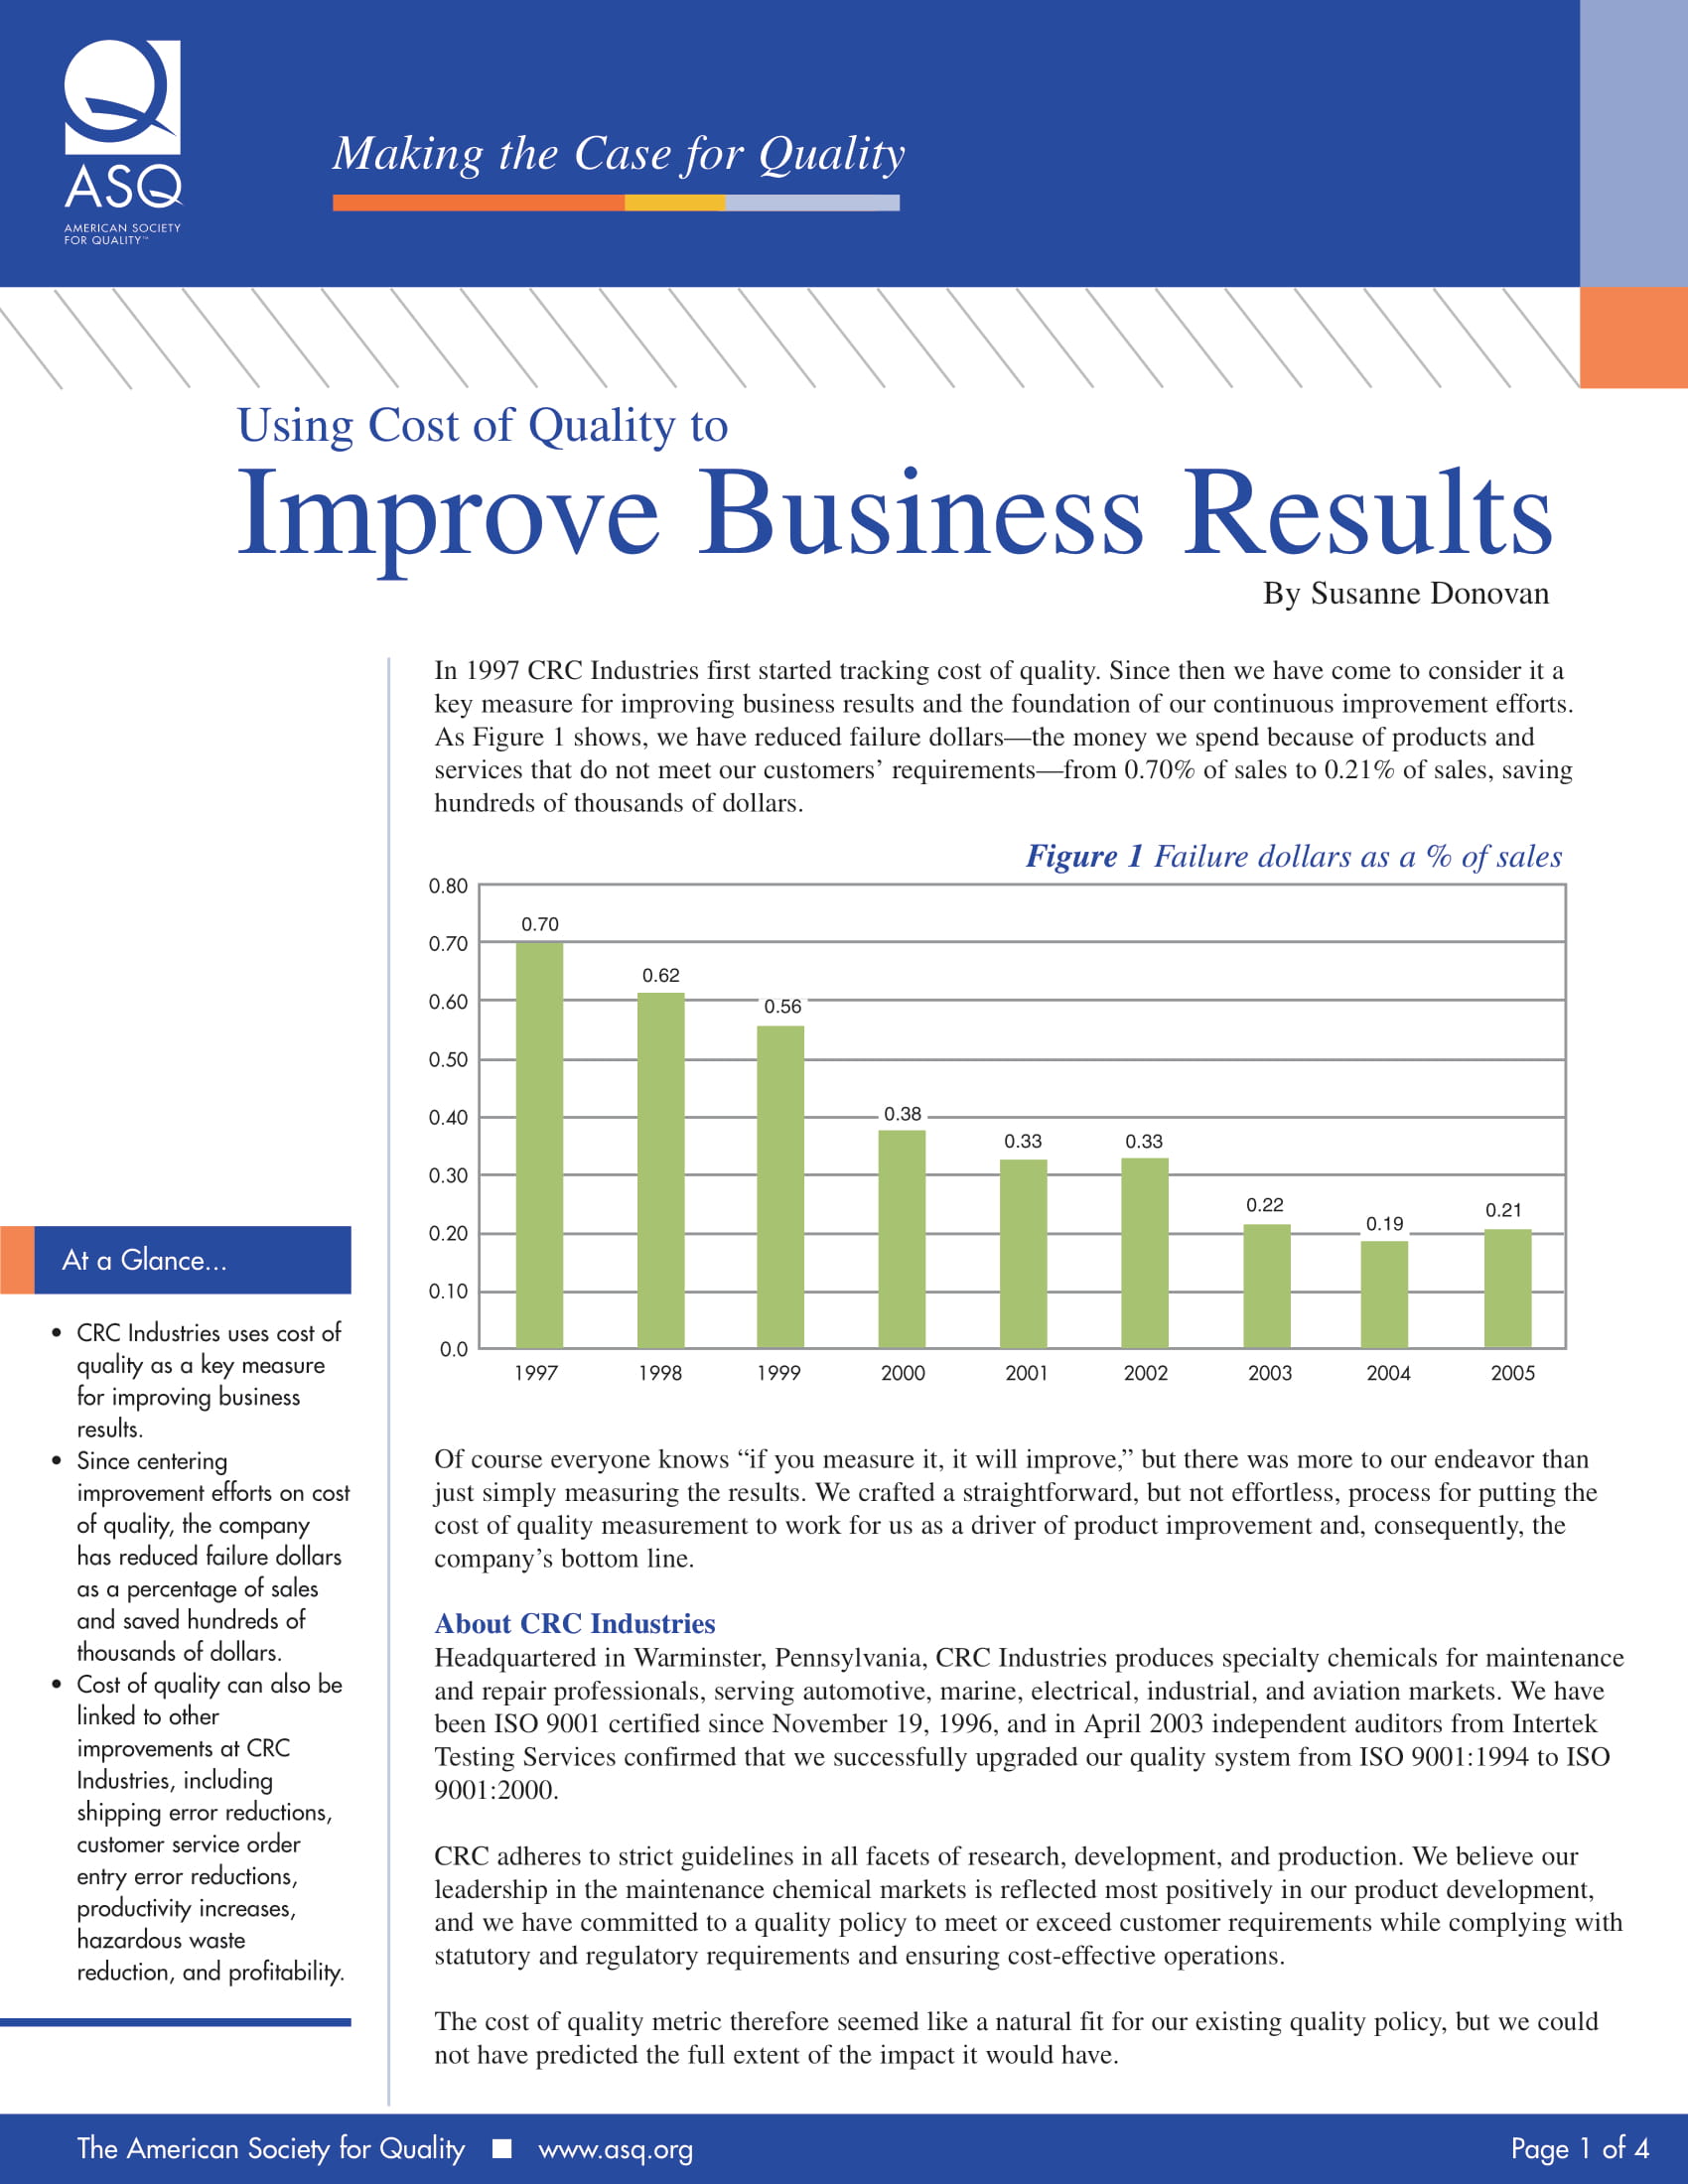
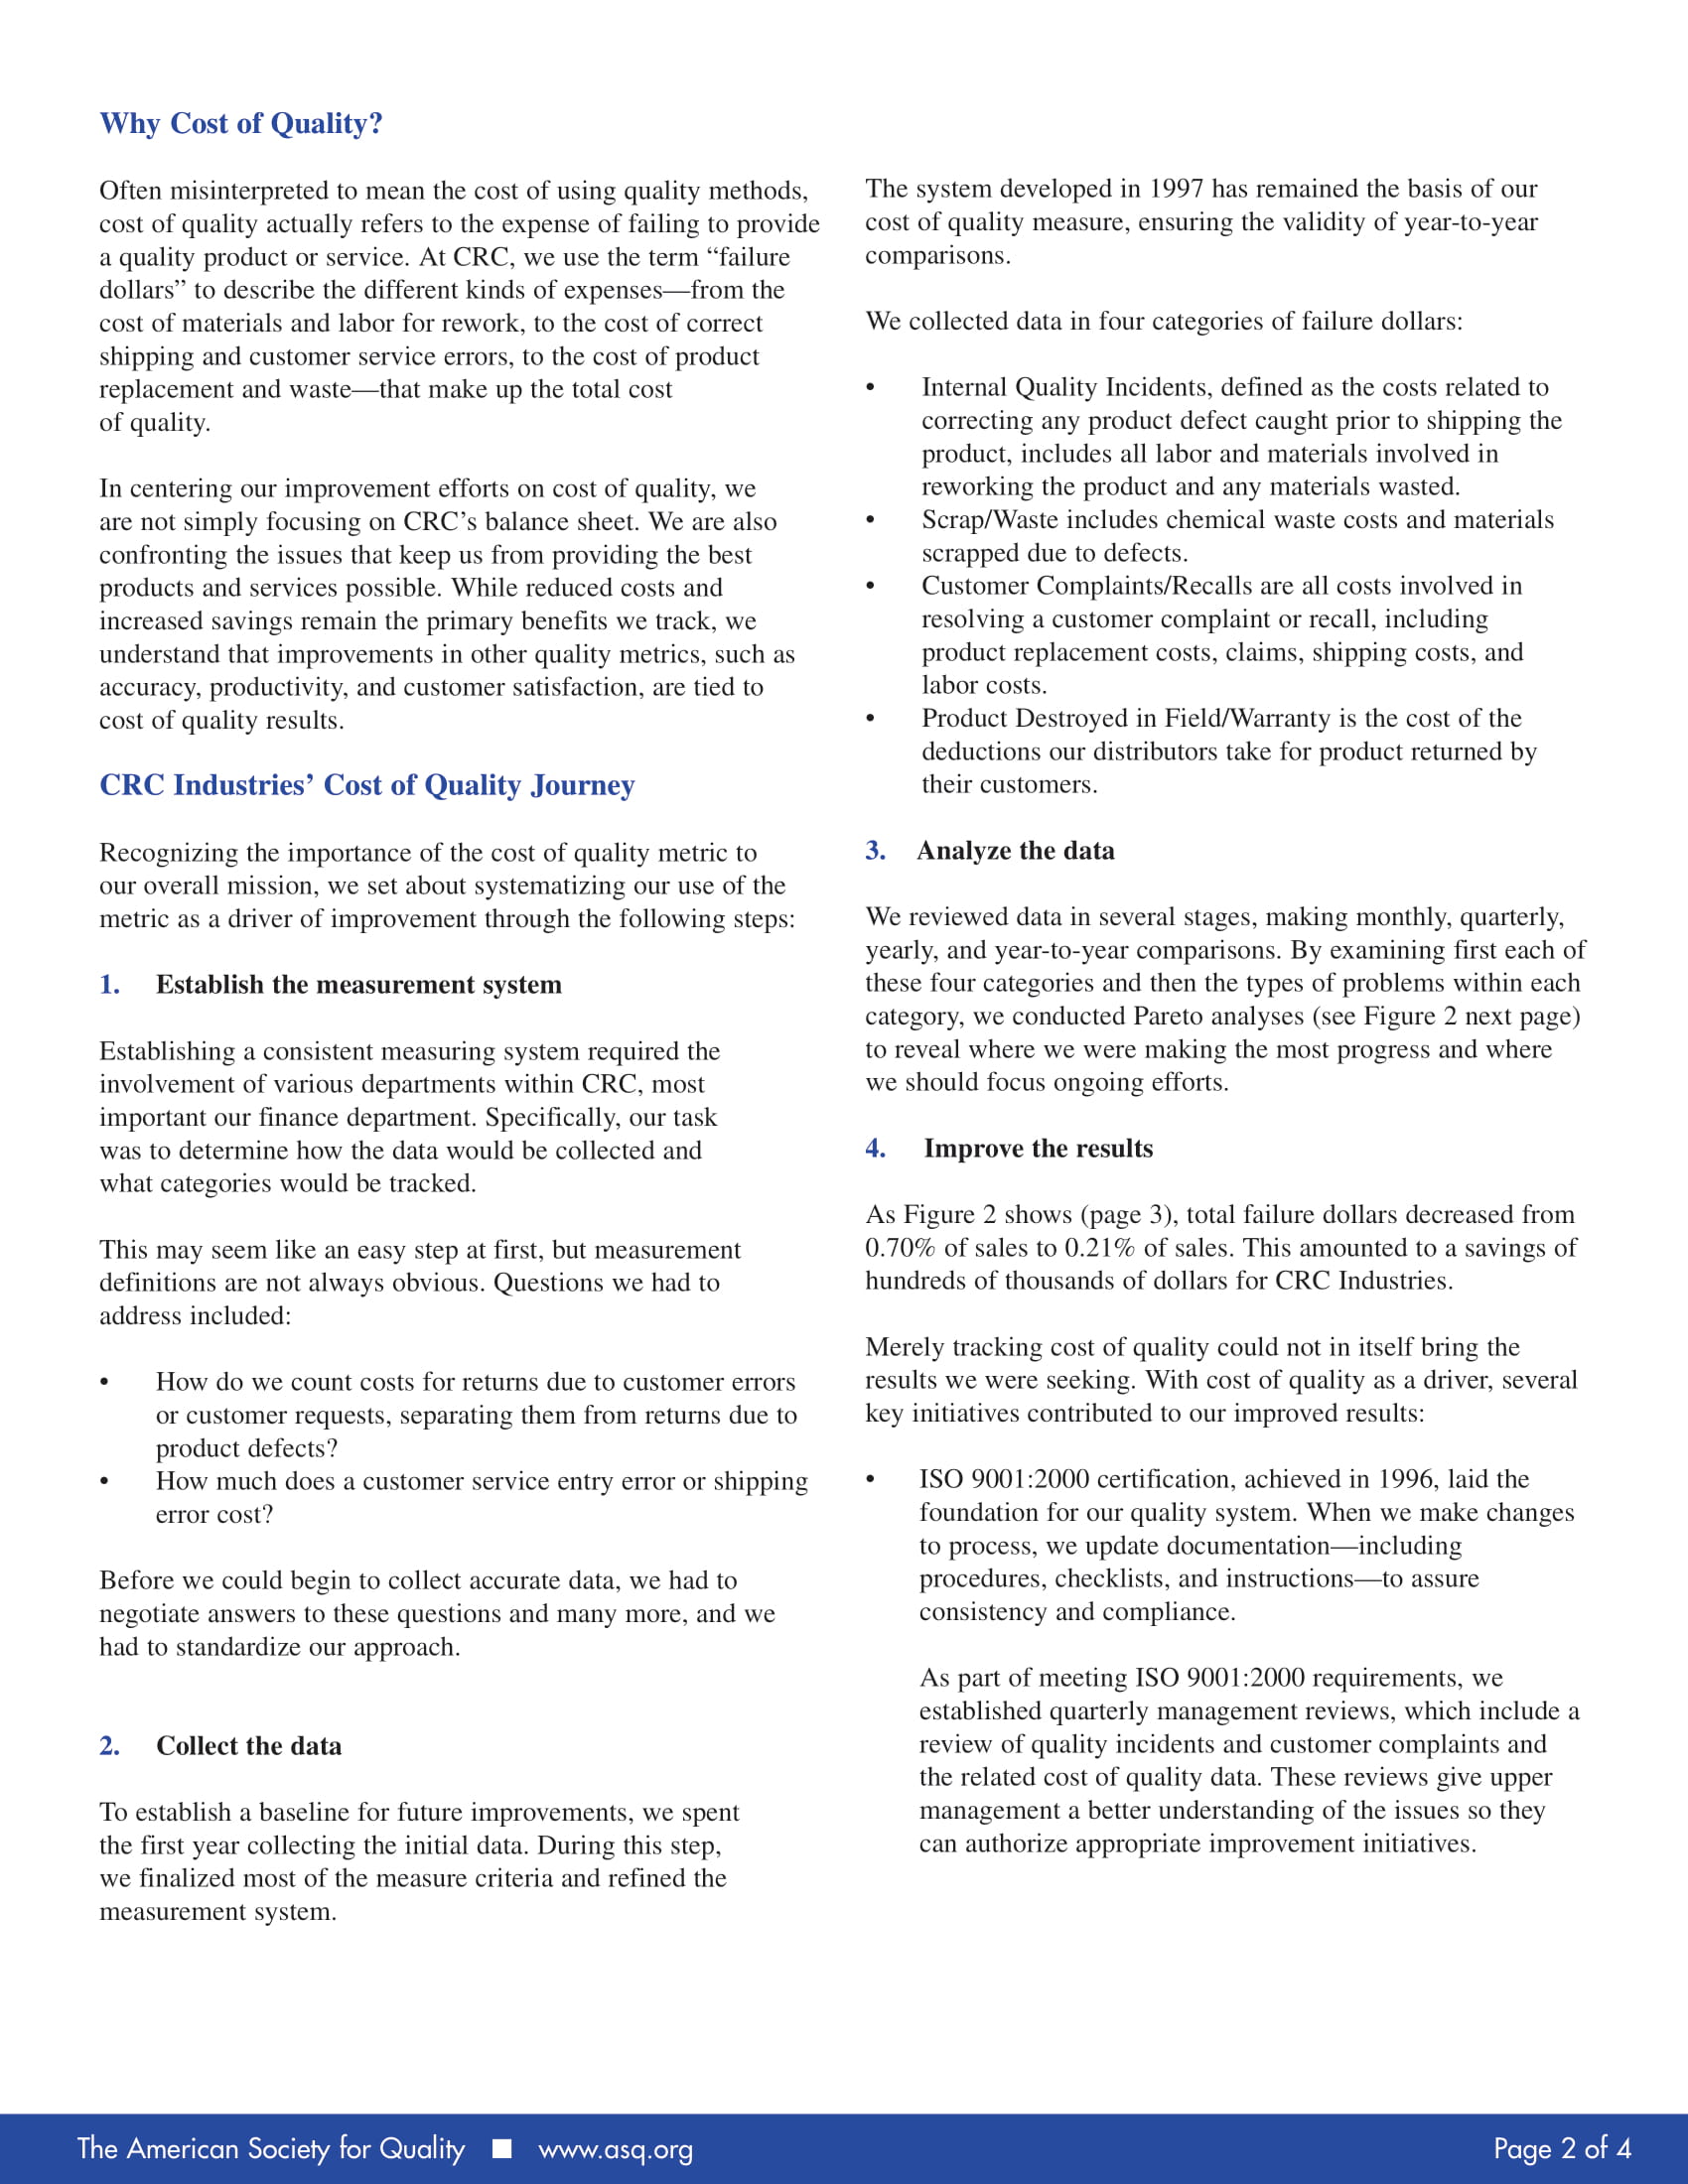
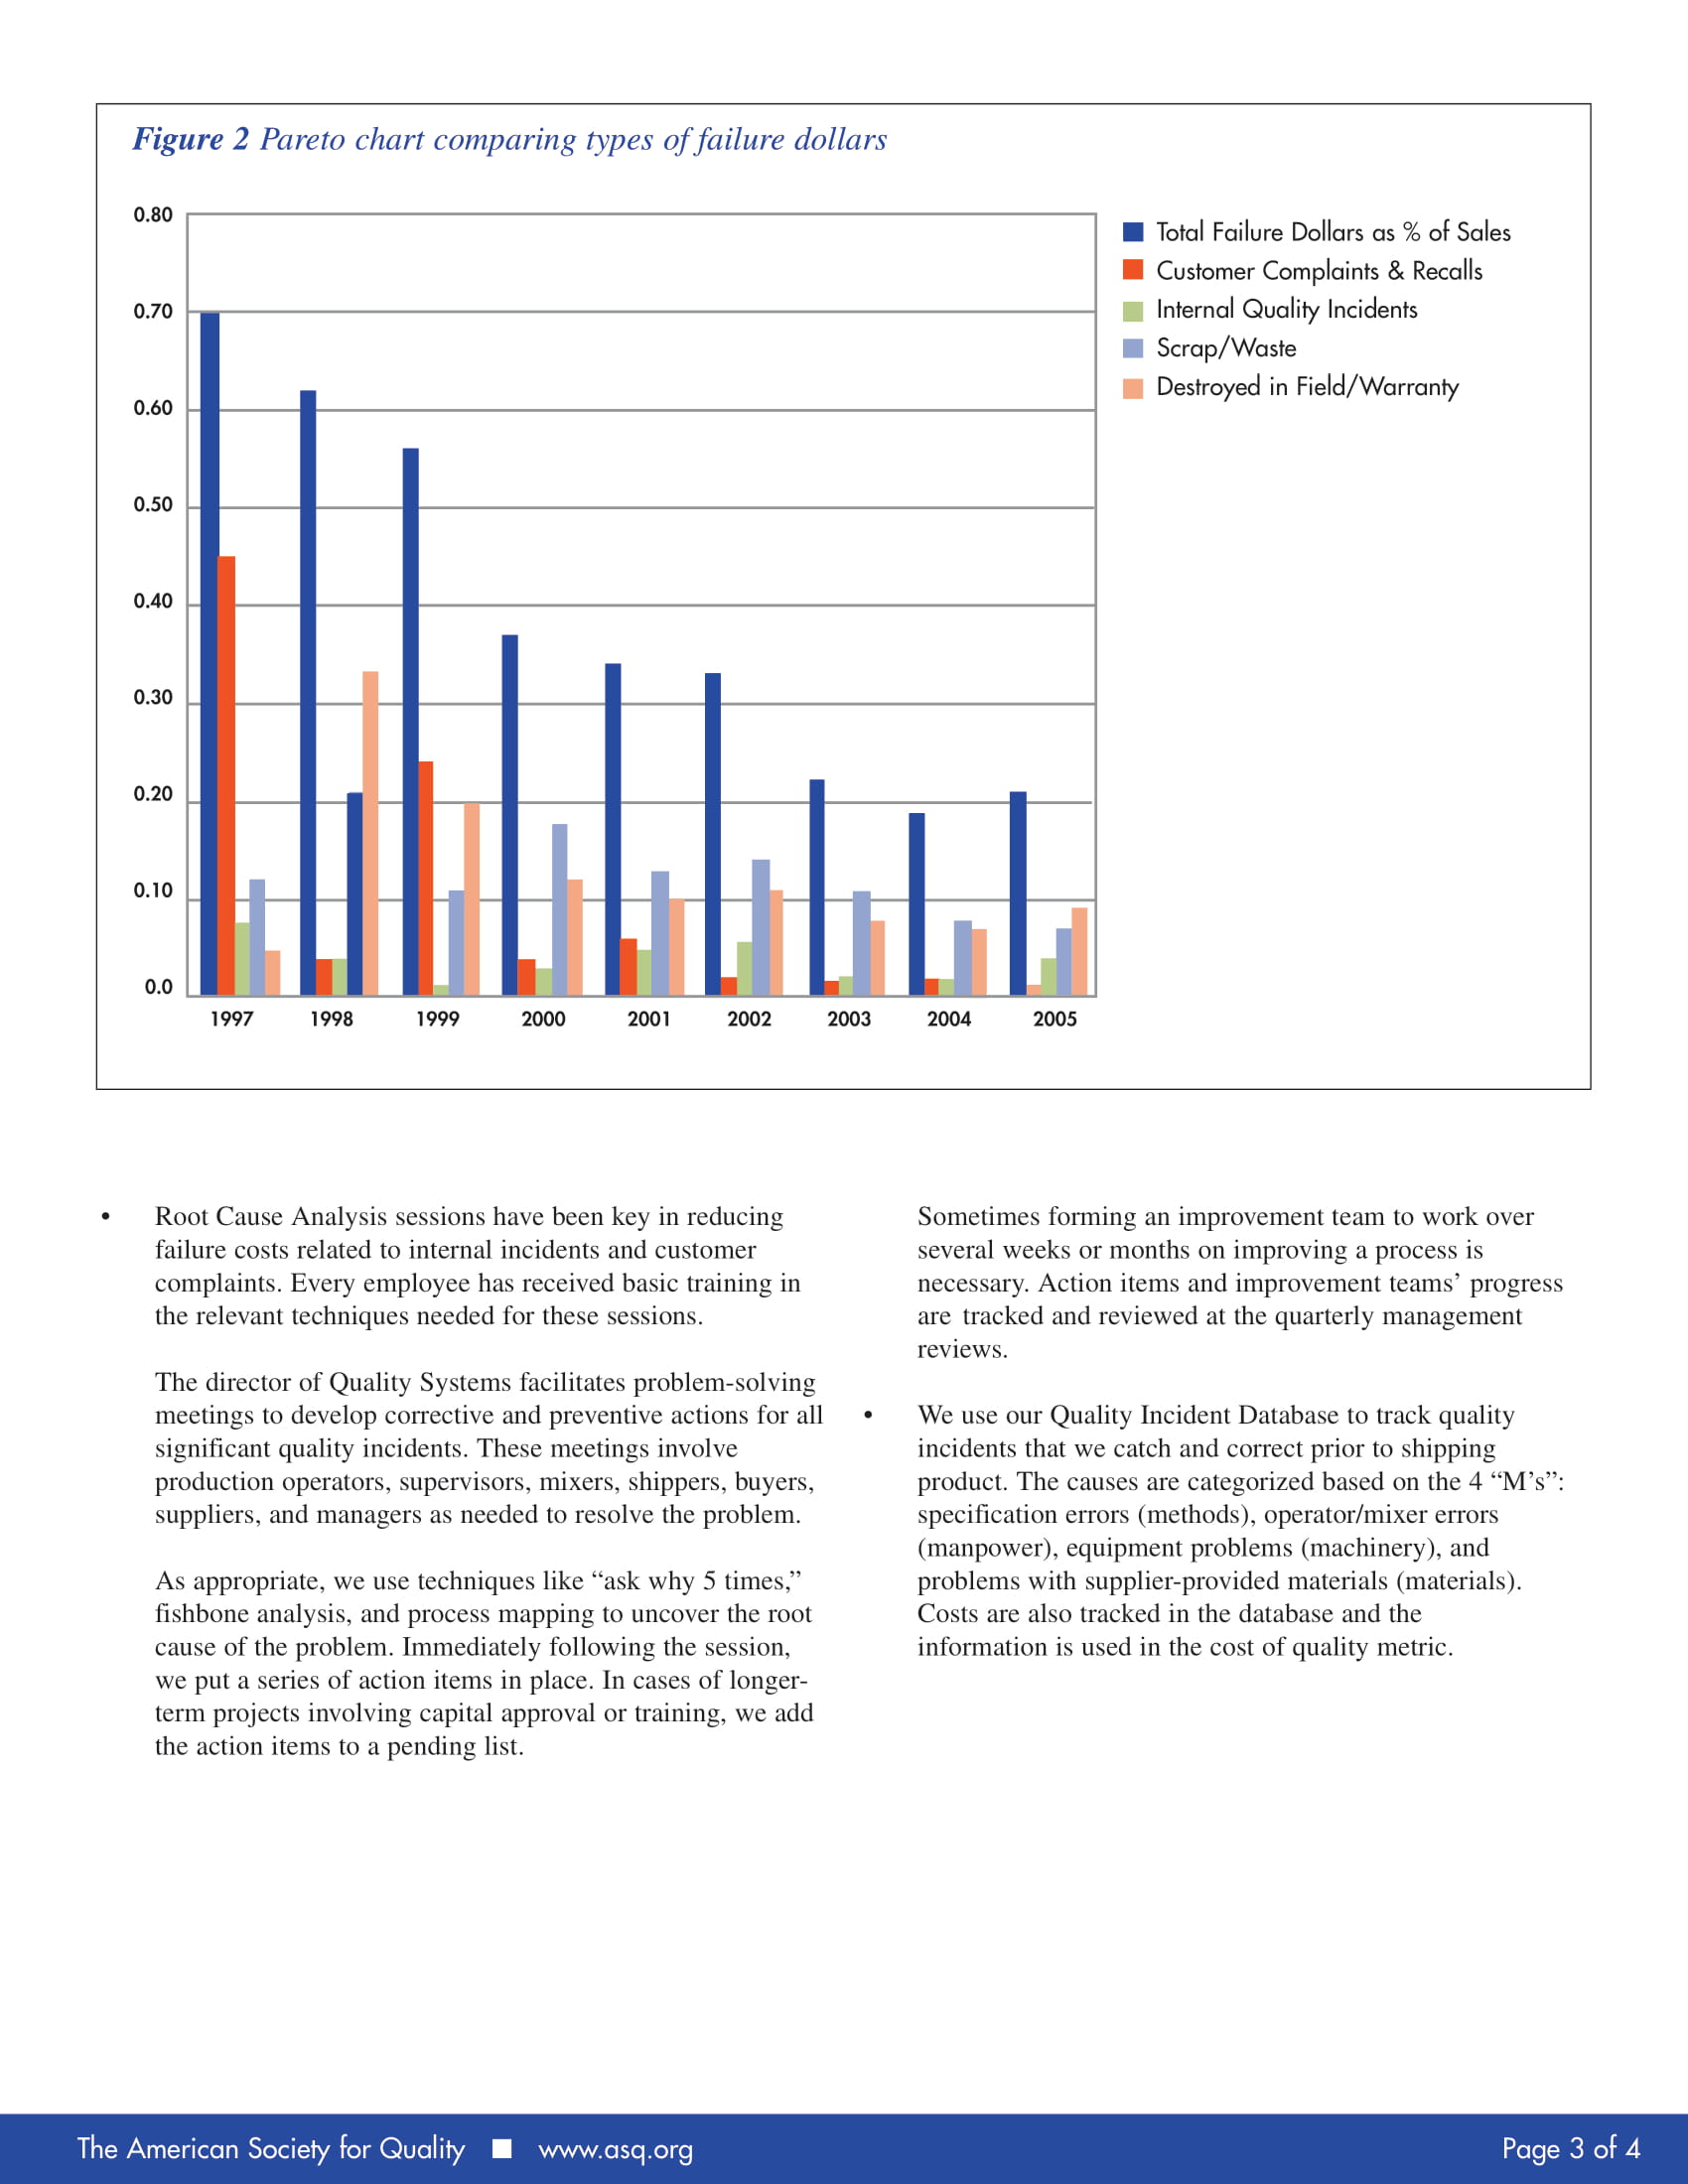
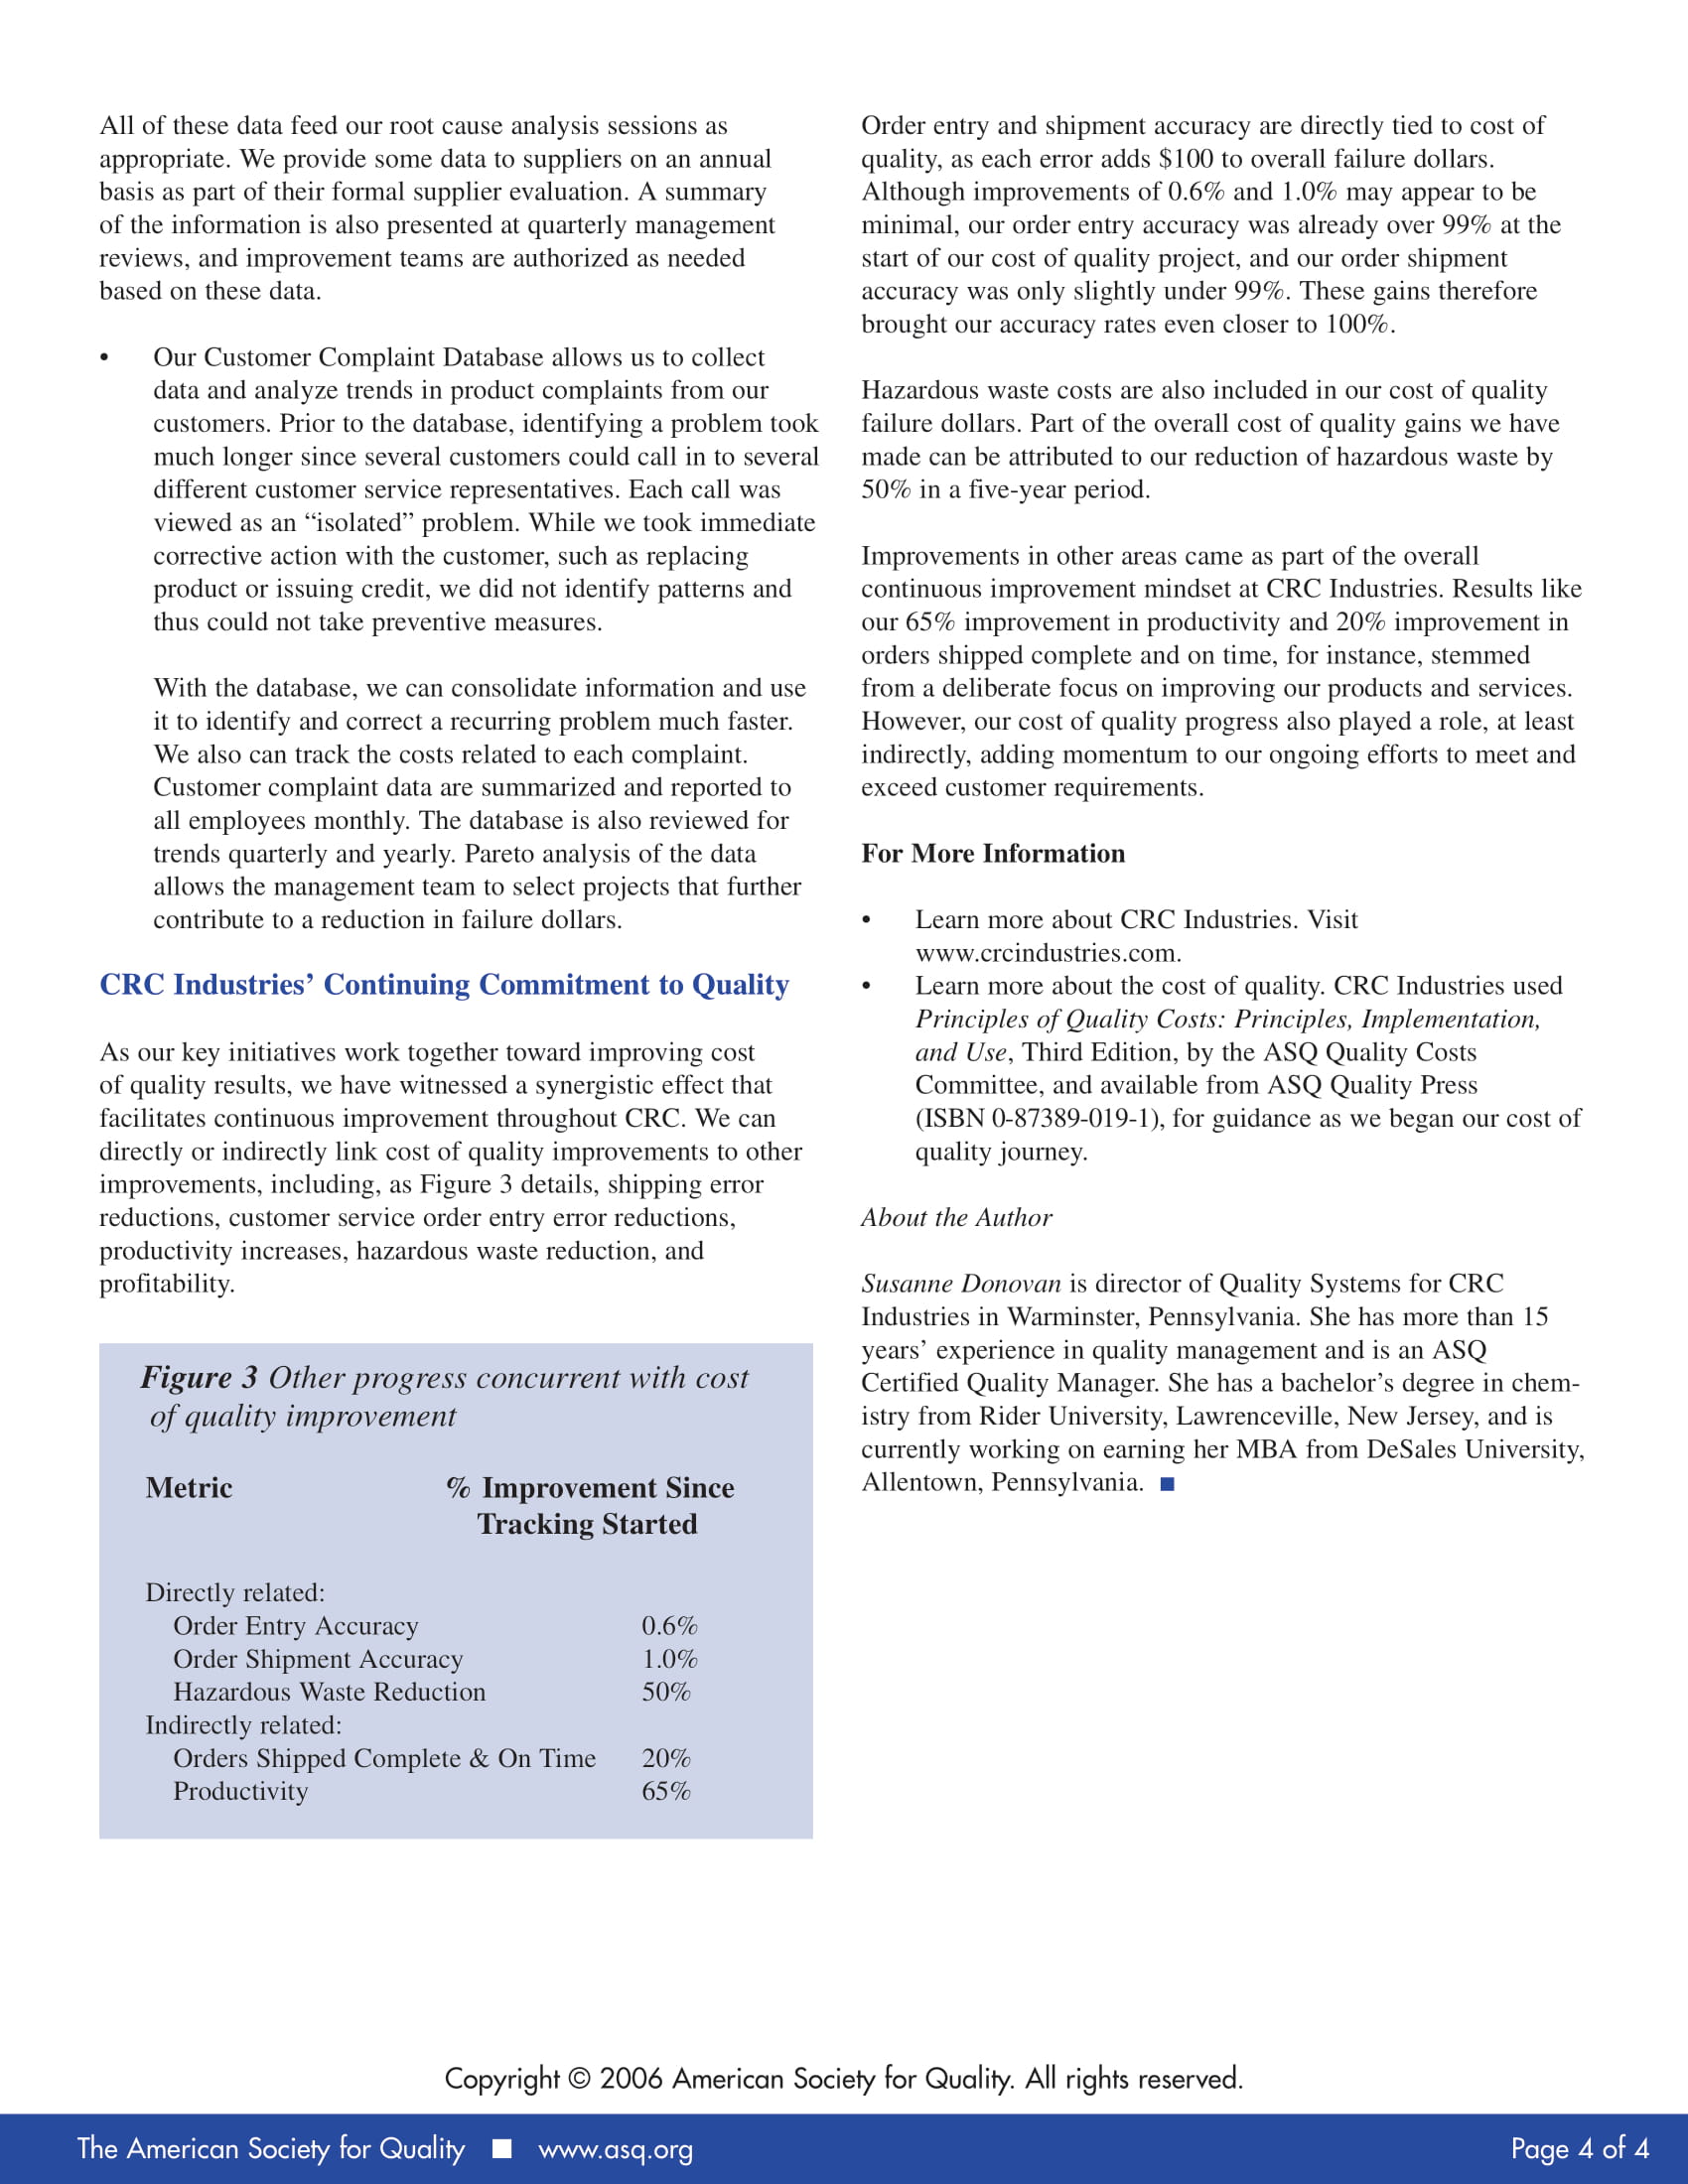
9 A39. Making the Casefbr Quality \\\\\\\\\\\\\\\\\\\\\\\\\\\\\\\\\\\\\\\\\\\\ Using Cost of Quality to Improve Business Results At a Glance... - CRC Industries uses cost of quality as a key measure for improving business results. - Since centering improvement efforts on cost of quality, the company has reduced failure dollars as a percentage of sales and saved hundreds of thousands of dollars. ' Cost of quality can also be linked to other improvements at CRC Industries, including shipping error reductions, customer service order entry error reductions, productivity increases, hazardous waste reduction, and profitability. The American Society for Quality I www.ctsqorg By Susanne Donovan In 1997 CRC Industries rst started tracking cost of quality. Since then We have come to consider it a key measure for improving business results and the foundation of our continuous improvement efforts. As Figure 1 shows, we have reduced failure dollarsthe money we spend because of products and services that do not meet our customers' requirementsfrom 0.70% of sales to 0.21% of sales, saving hundreds of thousands of dollars. Figure 1 Failure dollars as a % of sales 1997 l 998 I 999 2000 2001 2002 2003 2004 2005 Of course everyone knows \"if you measure it, it will improve,\" but there was more to our endeavor than just simply measuring the results. We crafted a straightforward, but not effortless, process for putting the cost of quality measurement to work for us as a driver of product improvement and, consequently, the company's bottom line. About CRC Industries Headquartered in Warminster, Pennsylvania, CRC Industries produces specialty chemicals for maintenance and repair professionals, serving automotive, marine, electrical, industrial, and aviation markets. We have been ISO 9001 certied since November 19, 1996, and in April 2003 independent auditors from Intertek Testing Services continued that we successfully upgraded our quality system from ISO 9001:1994 to ISO 9001:2000. CRC adheres to strict guidelines in all facets of research, development, and production. We believe our leadership in the maintenance chemical markets is reflected most positively in our product development, and we have committed to a quality policy to meet or exceed customer requirements while complying with statutory and regulatory requirements and ensuring cost-effective operations. The cost of quality metric therefore seemed like a natural t for our existing quality policy, but we could not have predicted the full extent of the impact it would have. Page l of 4 Why Cost of Quality? Often misinterpreted to mean the cost of using quality methods, cost of quality actually refers to the expense of failing to provide a quality product or service. At CRC, we use the term \"failure dollars\" to describe the different kinds of expensesfrom the cost of materials and labor for rework, to the cost of correct shipping and customer service errors, to the cost of product replacement and wastethat make up the total cost of quality. In centering our improvement efforts on cost of quality, we are not simply focusing on CRC's balance sheet. We are also confronting the issues that keep us from providing the best products and services possible. While reduced costs and increased savings remain the primary benets we track, we understand that improvements in other quality metrics, such as accuracy, productivity. and customer satisfaction, are tied to cost of quality results. CRC Industries' Cost of Quality Journey Recognizing the importance of the cost of quality metric to our overall mission, we set about systematizing our use of the metric as a driver of improvement through the following steps: 1. Establish the measurement system Establishing a consistent measuring system required the involvement of various departments within CRC, most important our nance department. Specically, our task was to determine how the data would be collected and what categories would be tracked. This may seem like an easy step at rst, but measurement definitions are not always obvious. Questions we had to address included: - How do we count costs for returns due to customer errors or customer requests, separating them from returns due to product defects? How much does a customer service entry error or shipping error cost? Before we could begin to collect accurate data, we had to negotiate answers to these questions and many more, and we had to standardize our approach. 2. Collect the data To establish a baseline for future improvements, we spent the first year collecting the initial data. During this step, we nalized most of the measure criteria and rened the measurement system. The American Society For Quality I www.ctsqerg The system developed in 1997 has remained the basis of our cost of quality measure, ensuring the validity of yearto-year comparisons. We collected data in four categories of failure dollars: - Internal Quality Incidents, dened as the costs related to correcting any product defect caught prior to shipping the product, includes all labor and materials involved in reworking the product and any materials wasted. - Scrap/Waste includes chemical waste costs and materials scrapped due to defects. - Customer Complaints/Recalls are all costs involved in resolving a customer complaint or recall, including product replacement costs, claims, shipping costs, and labor costs. - Product Destroyed in Fieldearranty is the cost of the deductions our distributors take for product returned by their customers. 3. Analyze the data We reviewed data in several stages, making monthly, quarterly, yearly, and year-to-year comparisons. By examining rst each of these four categories and then the types of problems within each category, we conducted Pareto analyses (see Figure 2 next page) to reveal where we were making the most progress and where we should focus ongoing efforts. 4. Improve the results As Figure 2 shows (page 3), total failure dollars decreased from 0.70% of sales to 0.21% of sales. This amounted to a savings of hundreds of thousands of dollars for CRC Industries. Merely tracking cost of quality could not in itself bring the results we were seeking. With cost of quality as a driver, several key initiatives contributed to our improved results: - ISO 9001:2000 certication, achieved in 1996, laid the foundation for our quality system. When we make changes to process, we update documentationincluding procedures, checklists, and instructionsto assure consistency and compliance. As part of meeting ISO 9001:2000 requirements, we established quarterly management reviews, which include a review of quality incidents and customer complaints and the related cost of quality data. These reviews give upper management a better understanding of the issues so they can authorize appropriate improvement initiatives. Page 2 of 4 Figure 2 Pareto chart comparing types of failure dollars 0.70 I Total Failure Dollars as % of Sales I Customer Complaints & Recalls I Internal Quality Incidents 0.60 0.50 0.40 0.30 0.20 0.10 0.0 Root Cause Analysis sessions have been key in reducing failure costs related to internal incidents and customer complaints. Every employee has received basic training in the relevant techniques needed for these sessions. The director of Quality Systems facilitates problemsolving meetings to develop corrective and preventive actions for all signicant quality incidents. These meetings involve production operators, supervisors, mixers, shippers, buyers, suppliers, and managers as needed to resolve the problem. As appropriate, we use techniques like \"ask why 5 times,\" shbone analysis, and process mapping to uncover the root cause of the problem. Immediately following the session, we put a series of action items in place. In cases of longer term projects involving capital approval or training, we add the action items to a pending list. The American Society For Quality I www.ctsqorg I Scrap/Waste I Destroyed in Field/Warranty 2004 2005 Sometimes forming an improvement team to work over several weeks or months on improving a process is necessary. Action items and improvement teams' progress are tracked and reviewed at the quarterly management reviews. We use our Quality Incident Database to track quality incidents that we catch and correct prior to shipping product. The causes are categorized based on the 4 \"M's\": specication errors (methods), operator/mixer errors (manpower), equipment problems (machinery), and problems with supplierprovided materials (materials). Costs are also tracked in the database and the information is used in the cost of quality metric. Page 3 of 4 All of these data feed our root cause analysis sessions as appropriate. We provide some data to suppliers on an annual basis as part of their formal supplier evaluation. A summary of the information is also presented at quarterly management reviews, and improvement teams are authorized as needed based on these data. 0 Our Customer Complaint Database allows us to collect data and analyze trends in product complaints from our customers. Prior to the database, identifying a problem took much longer since several customers could call in to several different customer service representatives. Each call was viewed as an \"isolated\" problem. While we took immediate corrective action with the customer, such as replacing product or issuing credit, we did not identify patterns and thus could not take preventive measures. With the database, we can consolidate information and use it to identify and correct a recurring problem much faster. We also can track the costs related to each complaint. Customer complaint data are summarized and reported to all employees monthly. The database is also reviewed for trends quarterly and yearly. Pareto analysis of the data allows the management team to select projects that further contribute to a reduction in failure dollars. CRC Industries' Continuing Commitment to Quality As our key initiatives work together toward improving cost of quality results, we have witnessed a synergistic effect that facilitates continuous improvement throughout CRC. We can directly or indirectly link cost of quality improvements to other improvements, including, as Figure 3 details, shipping error reductions, customer service order entry error reductions, productivity increases, hazardous waste reduction, and protability. Figure 3 Other progress concurrent with cos-t of quality improvement Metric % Improvement Since Thanking Started Directly related: Order Entry Accuracy 0.6% Order Shipment Accuracy 1.0% Hazardous Waste Reduction 50% Indirectly related: Orders Shipped Complete &. On Time 20% Productivity 65% Order entry and shipment accuracy are directly tied to cost of quality, as each error adds $100 to overall failure dollars. Although improvements of 0.6% and 1.0% may appear to be minimal, our order entry accuracy was already over 99% at the start of our cost of quality project, and our order shipment accuracy was only slightly under 99%. These gains therefore brought our accuracy rates even closer to 100%. Hazardous waste costs are also included in our cost of quality failure dollars. Part of the overall cost of quality gains we have made can be attributed to our reduction of hazardous waste by 50% in a ve-year period. Improvements in other areas came as part of the overall continuous improvement mindset at CRC Industries. Results like our 65% improvement in productivity and 20% improvement in orders shipped complete and on time, for instance, stemmed from a deliberate focus on improving our products and services. However, our cost of quality progress also played a role, at least indirectly, adding momentum to our ongoing efforts to meet and exceed customer requirements. For More Information - Learn more about CRC Industries. Visit www.crcindustries.com. - Learn more about the cost of quality. CRC Industries used Principles of Quality Costs: Principles, Implementation, and Use, Third Edition, by the ASQ Quality Costs Committee, and available from ASQ Quality Press (ISBN 0-87389019-1), for guidance as we began our cost of quality journey. About the Author Susanne Donovan is director of Quality Systems for CRC Industries in Warminster, Pennsylvania. She has more than 15 years' experience in quality management and is an ASQ Certied Quality Manager. She has a bachelor's degree in chem istry from Rider University, Lawrenceville, New Jersey, and is currently working on eaming her MBA from DeSales University, Allentown, Pennsylvania. I Copyright 2006 American Society for Quality. All rights reserved. The American Society for Quality I wwwosqorg Page 4 of 4
