 Read the financial statements of KOGAN LTD from the annual report and write a report after completing following tasks:
1. Provide a brief of the company (Name, year of establishment, history, background, the product/service they deal in)? Select the latest year for review.
2. Looking at the contents page and flicking through the report, which sections dominate the report?
3. Referring to the directors report section, list three or four main directors along with a brief summary of directors report.
4. Who are the auditors? What is the auditors opinion? Provide a brief summary of auditors report after referring the auditors report section.
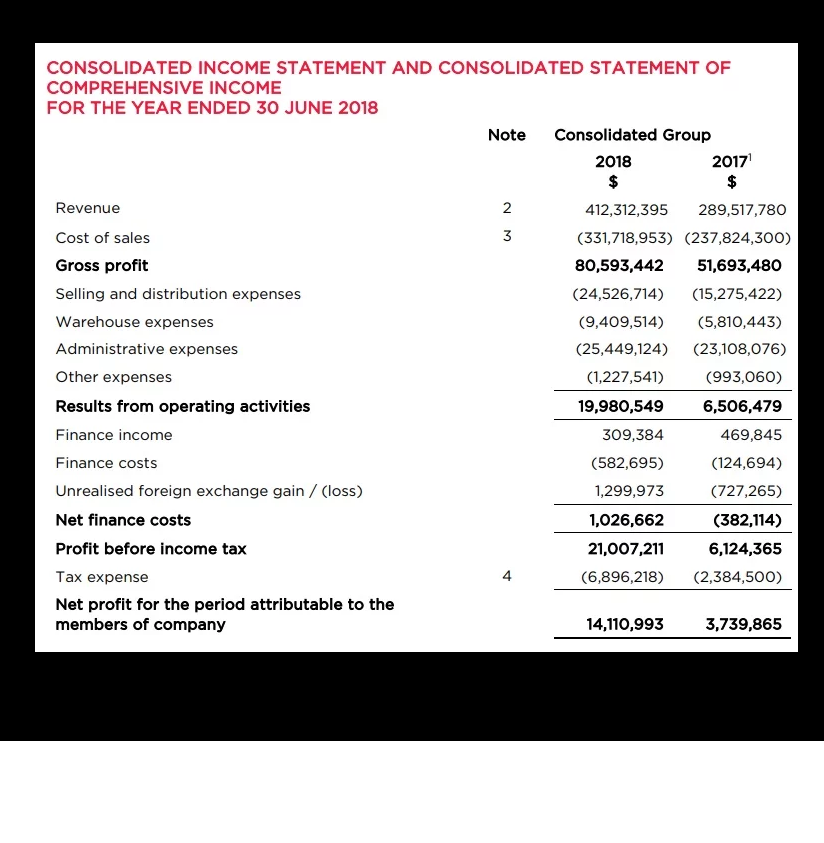
5. Have sales increased or decreased (compare the year you have selected with that of the previous/preceding one)? Comment on the reasons for the change in the sales.
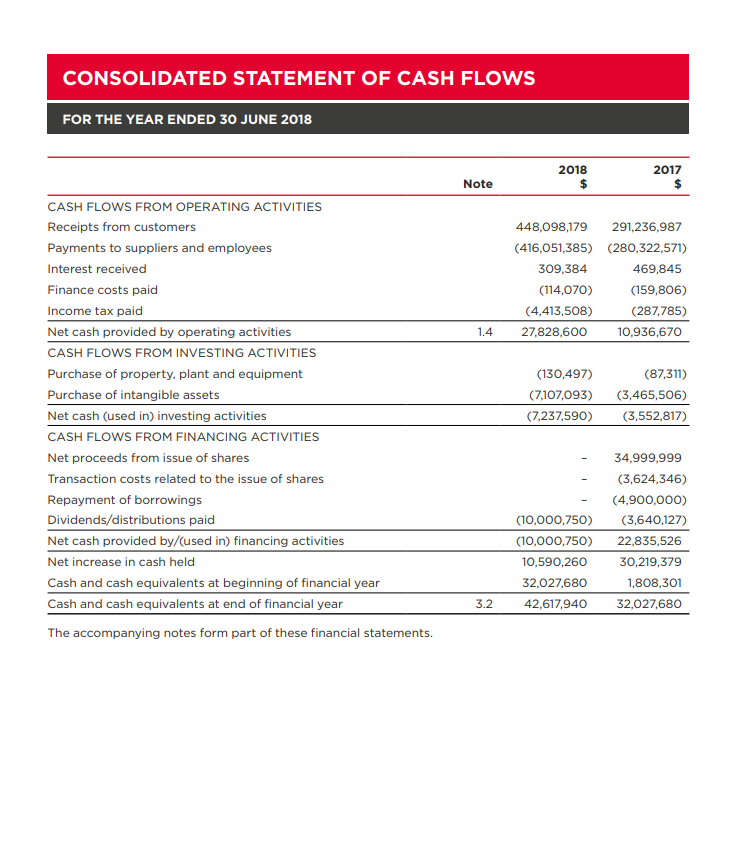
6. What is the net cash inflow (outflow) from operating activities? (See the companys cash flow statement). How has the companys net cash inflow changed from the previous year in terms of money and in terms of percentage?
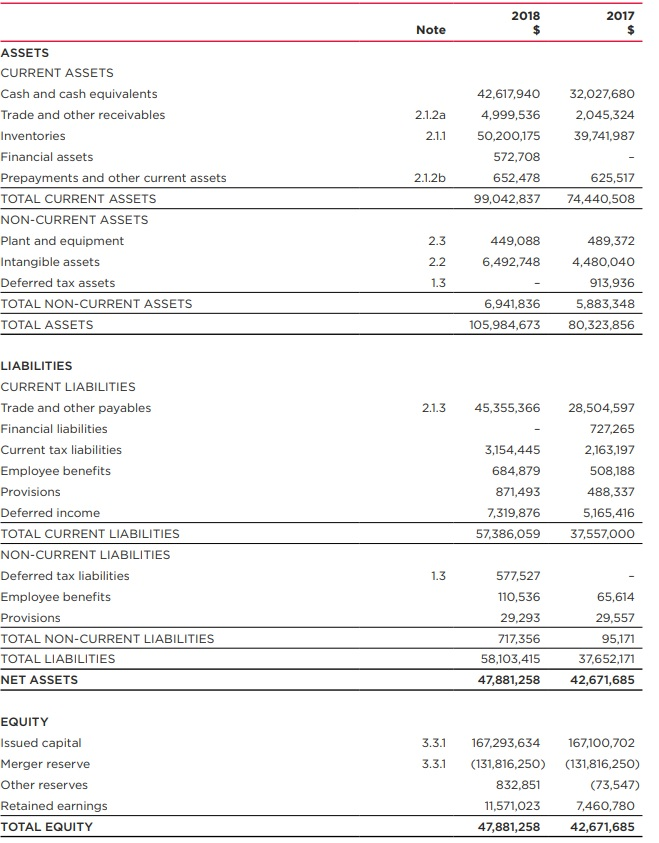
7. What was the retained profit for the year? Has the company any borrowings, i.e. loans, debentures, etc.?
8. Based on the income statement, Balance sheet & cash flow statement, calculate the following ratios and comment on the financial health of the company: Profitability ratios Liquidity ratios Asset turnover ratio Leverage ratios


CONSOLIDATED INCOME STATEMENT AND CONSOLIDATED STATEMENT OF COMPREHENSIVE INCOME FOR THE YEAR ENDED 30 JUNE 2018 Note Consolidated Group 2018 2017 Revenue Cost of sales Gross profit Selling and distribution expenses Warehouse expenses Administrative expenses Other expenses Results from operating activities Finance income Finance costs Unrealised foreign exchange gain (loss) Net finance costs Profit before income tax Tax expense Net profit for the period attributable to the members of company 2 412,312,395289,517,780 3 (331,718,953) (237,824,300) 80,593,442 51,693,480 (24,526,714) (15,275,422) (9,409,514) (5,810,443) (25,449,124) (23,108,076) (993,060) 6,506,479 469,845 (124,694) (727,265) (382,114;) 6,124,365 (6,896,218) (2,384,5OO) (1,227,541) 19,980,549 309,384 (582,695) 1,299,973 1,026,662 21,007,211 4 14,110,993 3,739,865 2018 2017 Note ASSETS CURRENT ASSETS Cash and cash equivalents Trade and other receivables Inventories Financial assets Prepayments and other current assets TOTAL CURRENT ASSETS NON-CURRENT ASSETS Plant and equipment Intangible assets Deferred tax assets TOTAL NON-CURRENT ASSETS TOTAL ASSETS 42,617,940 32,027,680 2,045,324 39,741,987 2.1.2a 4,999,536 211 50,200,175 572,708 652.478 2.1.2b 625,517 99,042,837 74,440,508 2.3 489,372 6,492,748 4,480,040 913,936 5,883,348 105,984,673 80,323,856 449,088 2.2 6,941,836 LIABILITIES CURRENT LIABILITIES Trade and other payables Financial liabilities Current tax liabilities Employee benefits Provisions Deferred income TOTAL CURRENT LIABILITIES NON-CURRENT LIABILITIES Deferred tax liabilities Employee benefits Provisions TOTAL NON-CURRENT LIABILITIES TOTAL LIABILITIES NET ASSETS 2.1.3 45,355,366 28,504,597 727,265 2,163,197 508,188 488,337 5,165,416 37,557,00O 3,154,445 684,879 871,493 7,319,876 57,386,059 577,527 110,536 29,293 717,356 58,103,415 47,881,258 1.3 65,614 29,557 95,171 37,652,171 42,671,685 EQUITY Issued capital Merger reserve Other reserves Retained earnings TOTAL EQUITY 3.3.1 167,293,634 167,100,702 3.3.1 (131,816,250) (131,816,250) (73,547) 7,460,780 42,671,685 832,851 11,571,023 47,881,258 CONSOLIDATED STATEMENT OF CASH FLOWS FOR THE YEAR ENDED 30 JUNE 2018 2018 2017 Note CASH FLOWS FROM OPERATING ACTIVITIES Receipts from customers Payments to suppliers and employees Interest received Finance costs paid Income tax paid Net cash provided by operating activities CASH FLOWS FROM INVESTING ACTIVITIES Purchase of property, plant and equipment Purchase of intangible assets Net cash (used in) investing activities CASH FLOWS FROM FINANCING ACTIVITIES Net proceeds from issue of shares Transaction costs related to the issue of shares Repayment of borrowings Dividends/distributions paid Net cash provided by/(used in) financing activities Net increase in cash held Cash and cash equivalents at beginning of financial year Cash and cash equivalents at end of financial year The accompanying notes form part of these financial statements. 448,098,179 291,236,987 (416,051,385) (280,322,571) 469,845 (159,806) (287,785) 10,936,670 309,384 (114,070) (4,413,508) 27,828,600 (87,311) (7,107,093) (3,465,506) (7,237,590 (3,552,817) (130,497) - 34,999,999 -(3,624,346) - (4,900,000) (10,000,750) (3,640,127) (10,000,750) 22,835,526 10,590,260 30,219,379 1,808,301 32,027,680 32,027,680 42,617,940 3.2 CONSOLIDATED INCOME STATEMENT AND CONSOLIDATED STATEMENT OF COMPREHENSIVE INCOME FOR THE YEAR ENDED 30 JUNE 2018 Note Consolidated Group 2018 2017 Revenue Cost of sales Gross profit Selling and distribution expenses Warehouse expenses Administrative expenses Other expenses Results from operating activities Finance income Finance costs Unrealised foreign exchange gain (loss) Net finance costs Profit before income tax Tax expense Net profit for the period attributable to the members of company 2 412,312,395289,517,780 3 (331,718,953) (237,824,300) 80,593,442 51,693,480 (24,526,714) (15,275,422) (9,409,514) (5,810,443) (25,449,124) (23,108,076) (993,060) 6,506,479 469,845 (124,694) (727,265) (382,114;) 6,124,365 (6,896,218) (2,384,5OO) (1,227,541) 19,980,549 309,384 (582,695) 1,299,973 1,026,662 21,007,211 4 14,110,993 3,739,865 2018 2017 Note ASSETS CURRENT ASSETS Cash and cash equivalents Trade and other receivables Inventories Financial assets Prepayments and other current assets TOTAL CURRENT ASSETS NON-CURRENT ASSETS Plant and equipment Intangible assets Deferred tax assets TOTAL NON-CURRENT ASSETS TOTAL ASSETS 42,617,940 32,027,680 2,045,324 39,741,987 2.1.2a 4,999,536 211 50,200,175 572,708 652.478 2.1.2b 625,517 99,042,837 74,440,508 2.3 489,372 6,492,748 4,480,040 913,936 5,883,348 105,984,673 80,323,856 449,088 2.2 6,941,836 LIABILITIES CURRENT LIABILITIES Trade and other payables Financial liabilities Current tax liabilities Employee benefits Provisions Deferred income TOTAL CURRENT LIABILITIES NON-CURRENT LIABILITIES Deferred tax liabilities Employee benefits Provisions TOTAL NON-CURRENT LIABILITIES TOTAL LIABILITIES NET ASSETS 2.1.3 45,355,366 28,504,597 727,265 2,163,197 508,188 488,337 5,165,416 37,557,00O 3,154,445 684,879 871,493 7,319,876 57,386,059 577,527 110,536 29,293 717,356 58,103,415 47,881,258 1.3 65,614 29,557 95,171 37,652,171 42,671,685 EQUITY Issued capital Merger reserve Other reserves Retained earnings TOTAL EQUITY 3.3.1 167,293,634 167,100,702 3.3.1 (131,816,250) (131,816,250) (73,547) 7,460,780 42,671,685 832,851 11,571,023 47,881,258 CONSOLIDATED STATEMENT OF CASH FLOWS FOR THE YEAR ENDED 30 JUNE 2018 2018 2017 Note CASH FLOWS FROM OPERATING ACTIVITIES Receipts from customers Payments to suppliers and employees Interest received Finance costs paid Income tax paid Net cash provided by operating activities CASH FLOWS FROM INVESTING ACTIVITIES Purchase of property, plant and equipment Purchase of intangible assets Net cash (used in) investing activities CASH FLOWS FROM FINANCING ACTIVITIES Net proceeds from issue of shares Transaction costs related to the issue of shares Repayment of borrowings Dividends/distributions paid Net cash provided by/(used in) financing activities Net increase in cash held Cash and cash equivalents at beginning of financial year Cash and cash equivalents at end of financial year The accompanying notes form part of these financial statements. 448,098,179 291,236,987 (416,051,385) (280,322,571) 469,845 (159,806) (287,785) 10,936,670 309,384 (114,070) (4,413,508) 27,828,600 (87,311) (7,107,093) (3,465,506) (7,237,590 (3,552,817) (130,497) - 34,999,999 -(3,624,346) - (4,900,000) (10,000,750) (3,640,127) (10,000,750) 22,835,526 10,590,260 30,219,379 1,808,301 32,027,680 32,027,680 42,617,940 3.2
 Read the financial statements of KOGAN LTD from the annual report and write a report after completing following tasks:


