Read the "H-E-B Own Brands" case and answer the questions below. Please state clearly your computations and your assumptions, and keep a copy to refer to during our discussion.
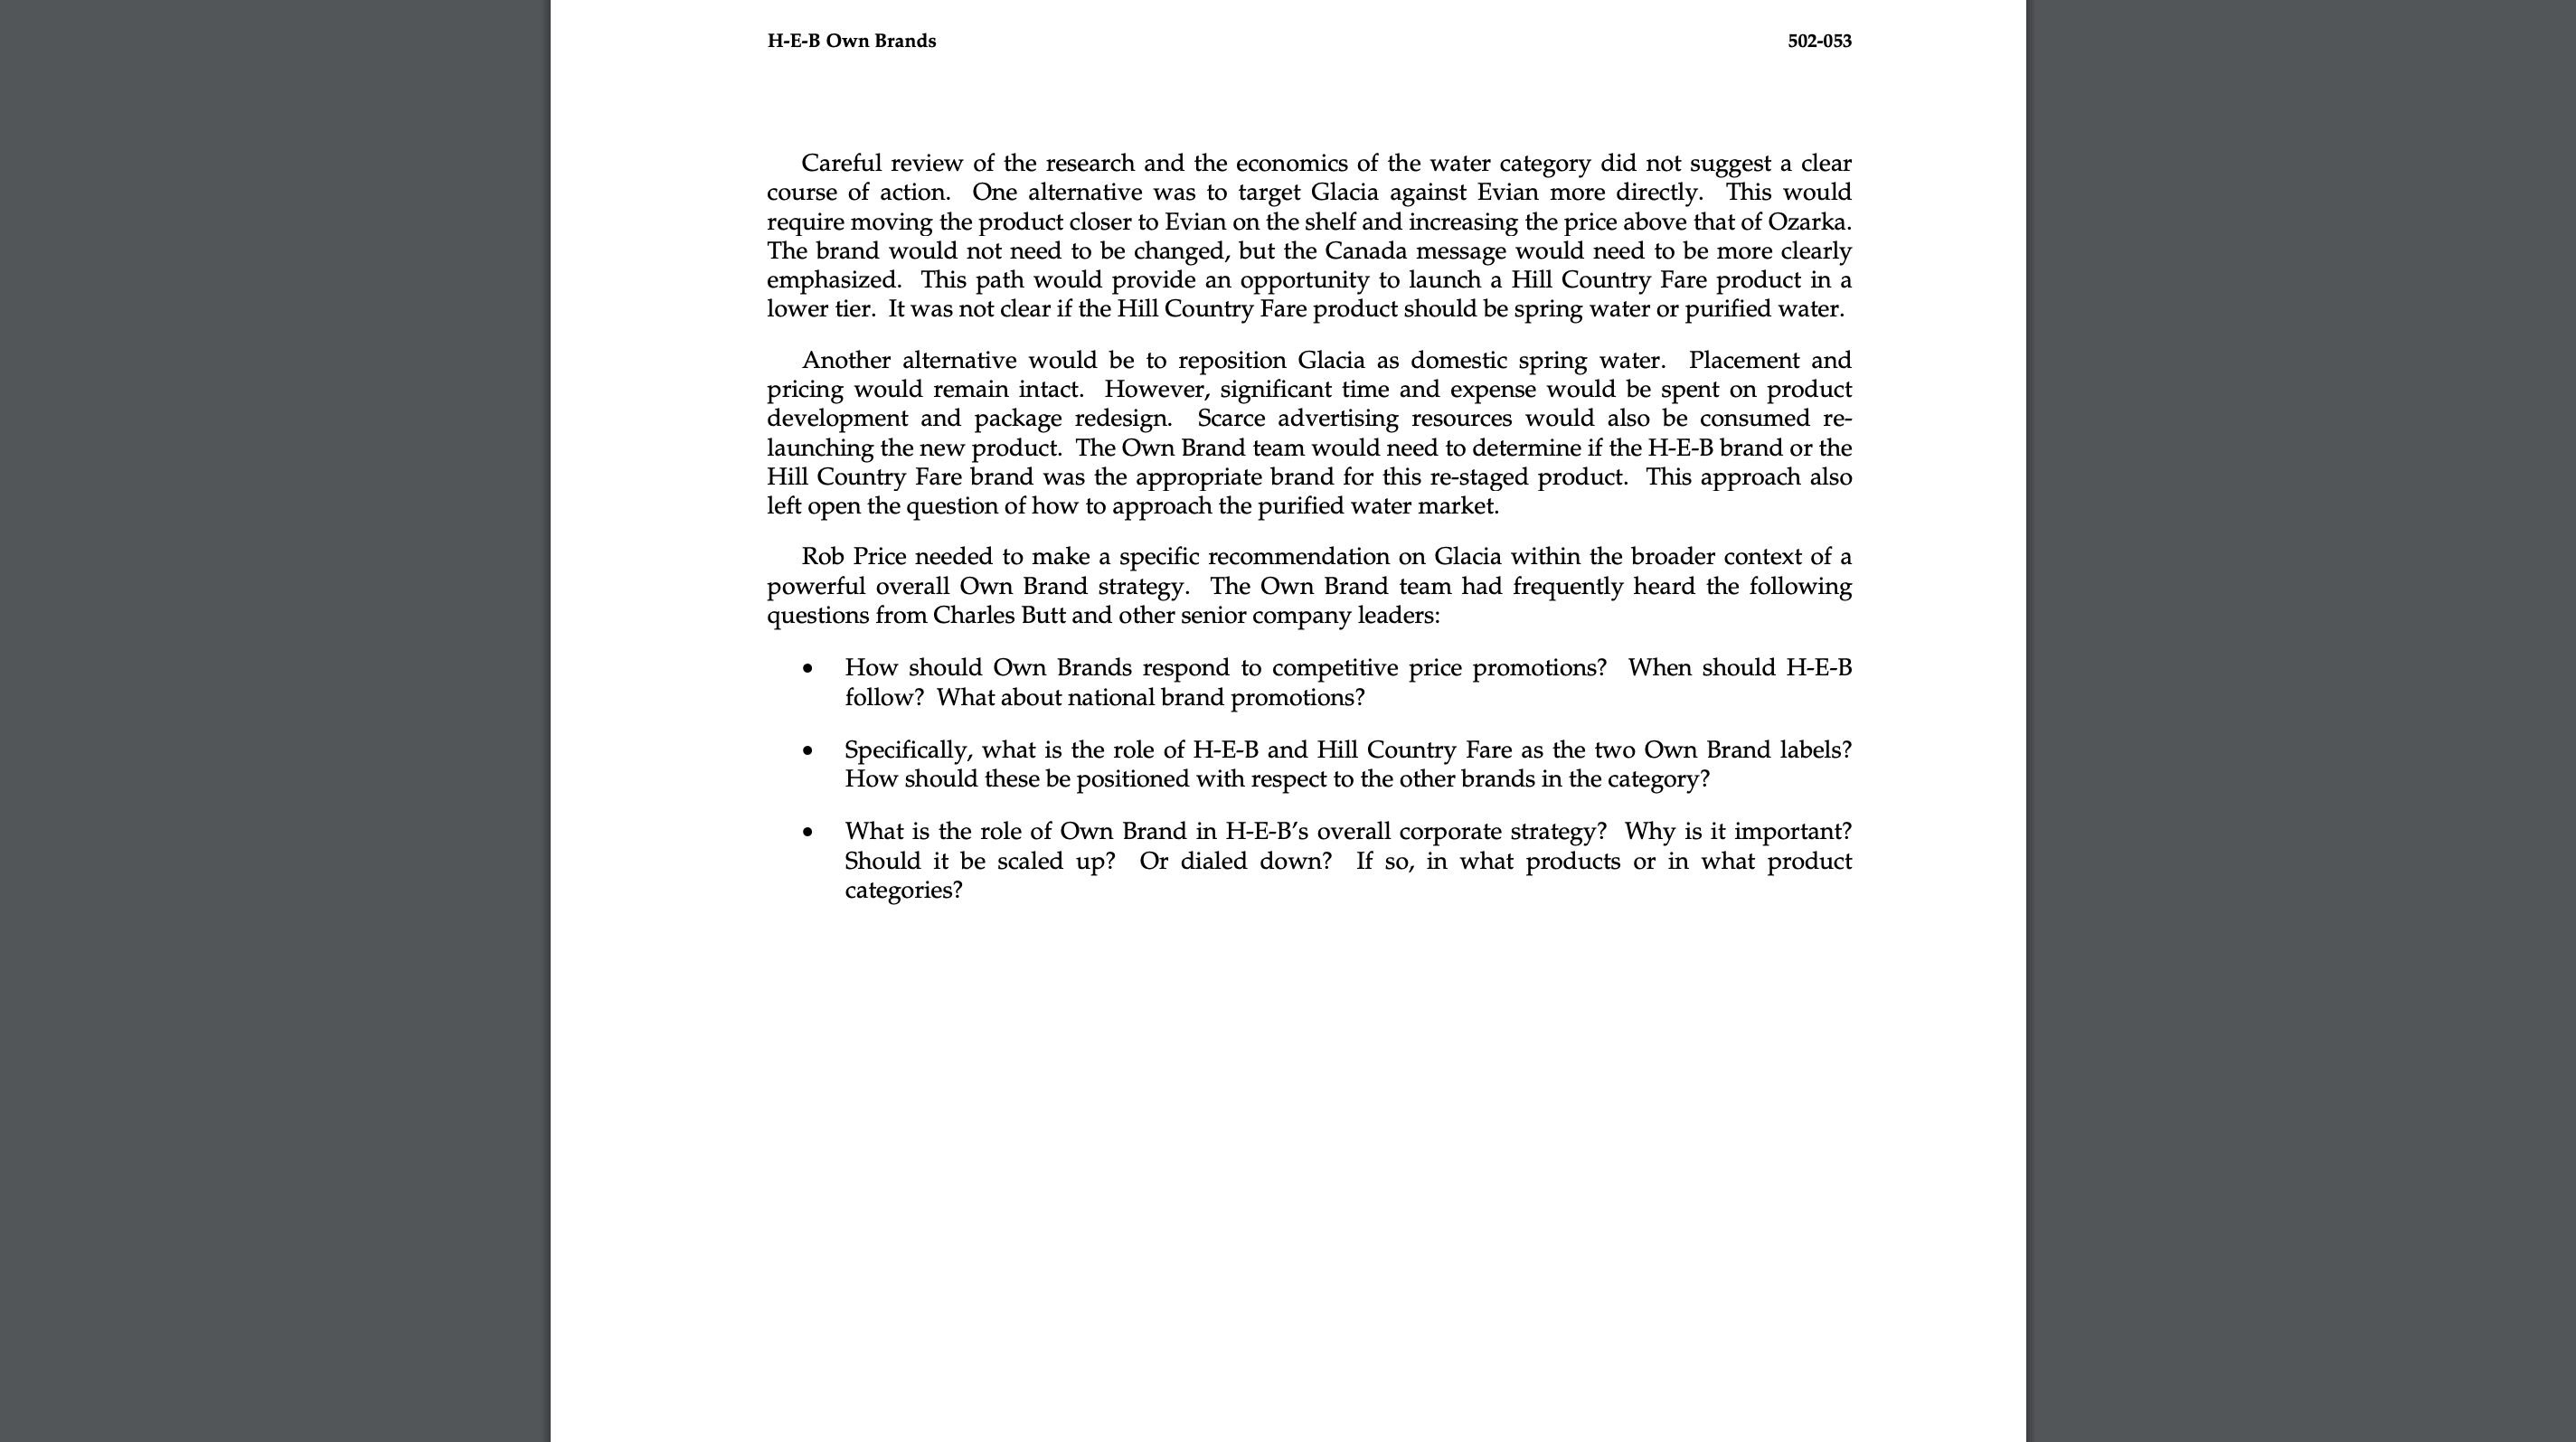
- How should Own Brands respond to competitive price promotions? When they should follow? What about national promotions?
- What is the role of HEB and Hill Country Fare as Own Brand Labels? How should these be positioned with respect to other brands in the category.
- What is the role of Own Brands in HEB's overall corporate strategy? Why is it important? Should it be scaled up? Or dialed down? If so, in what products or in what product categories?
Case study is attached below.
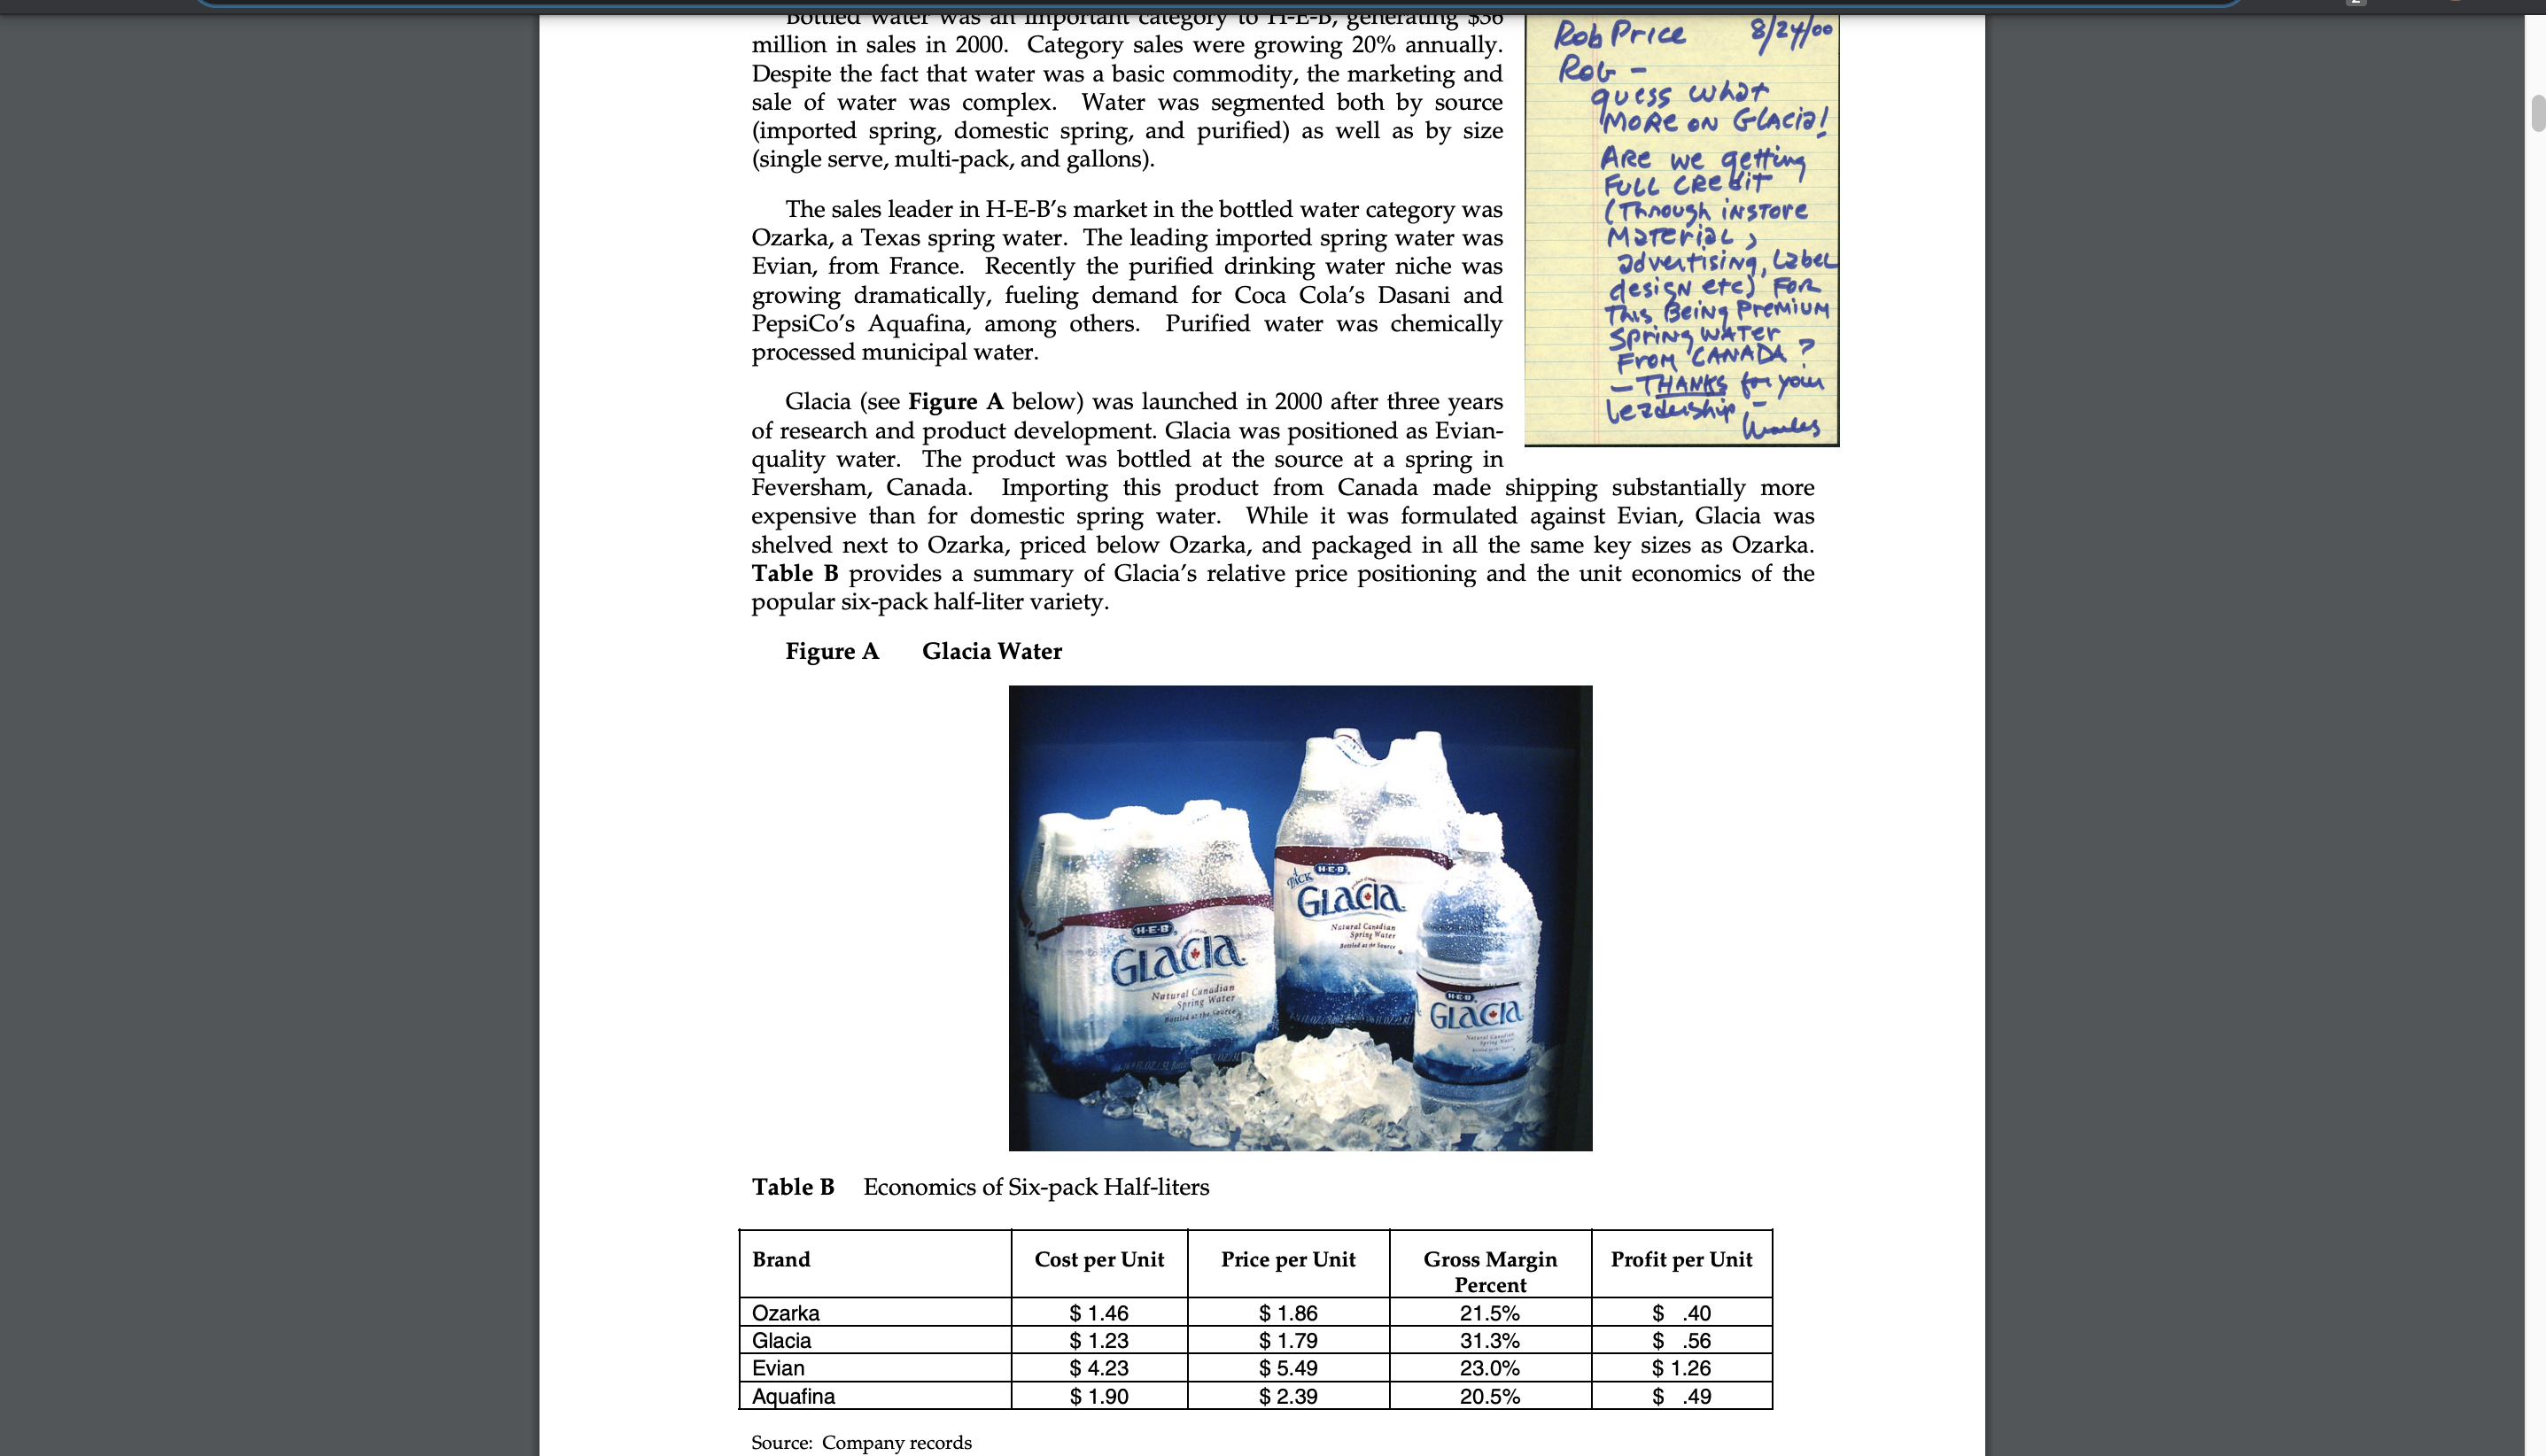
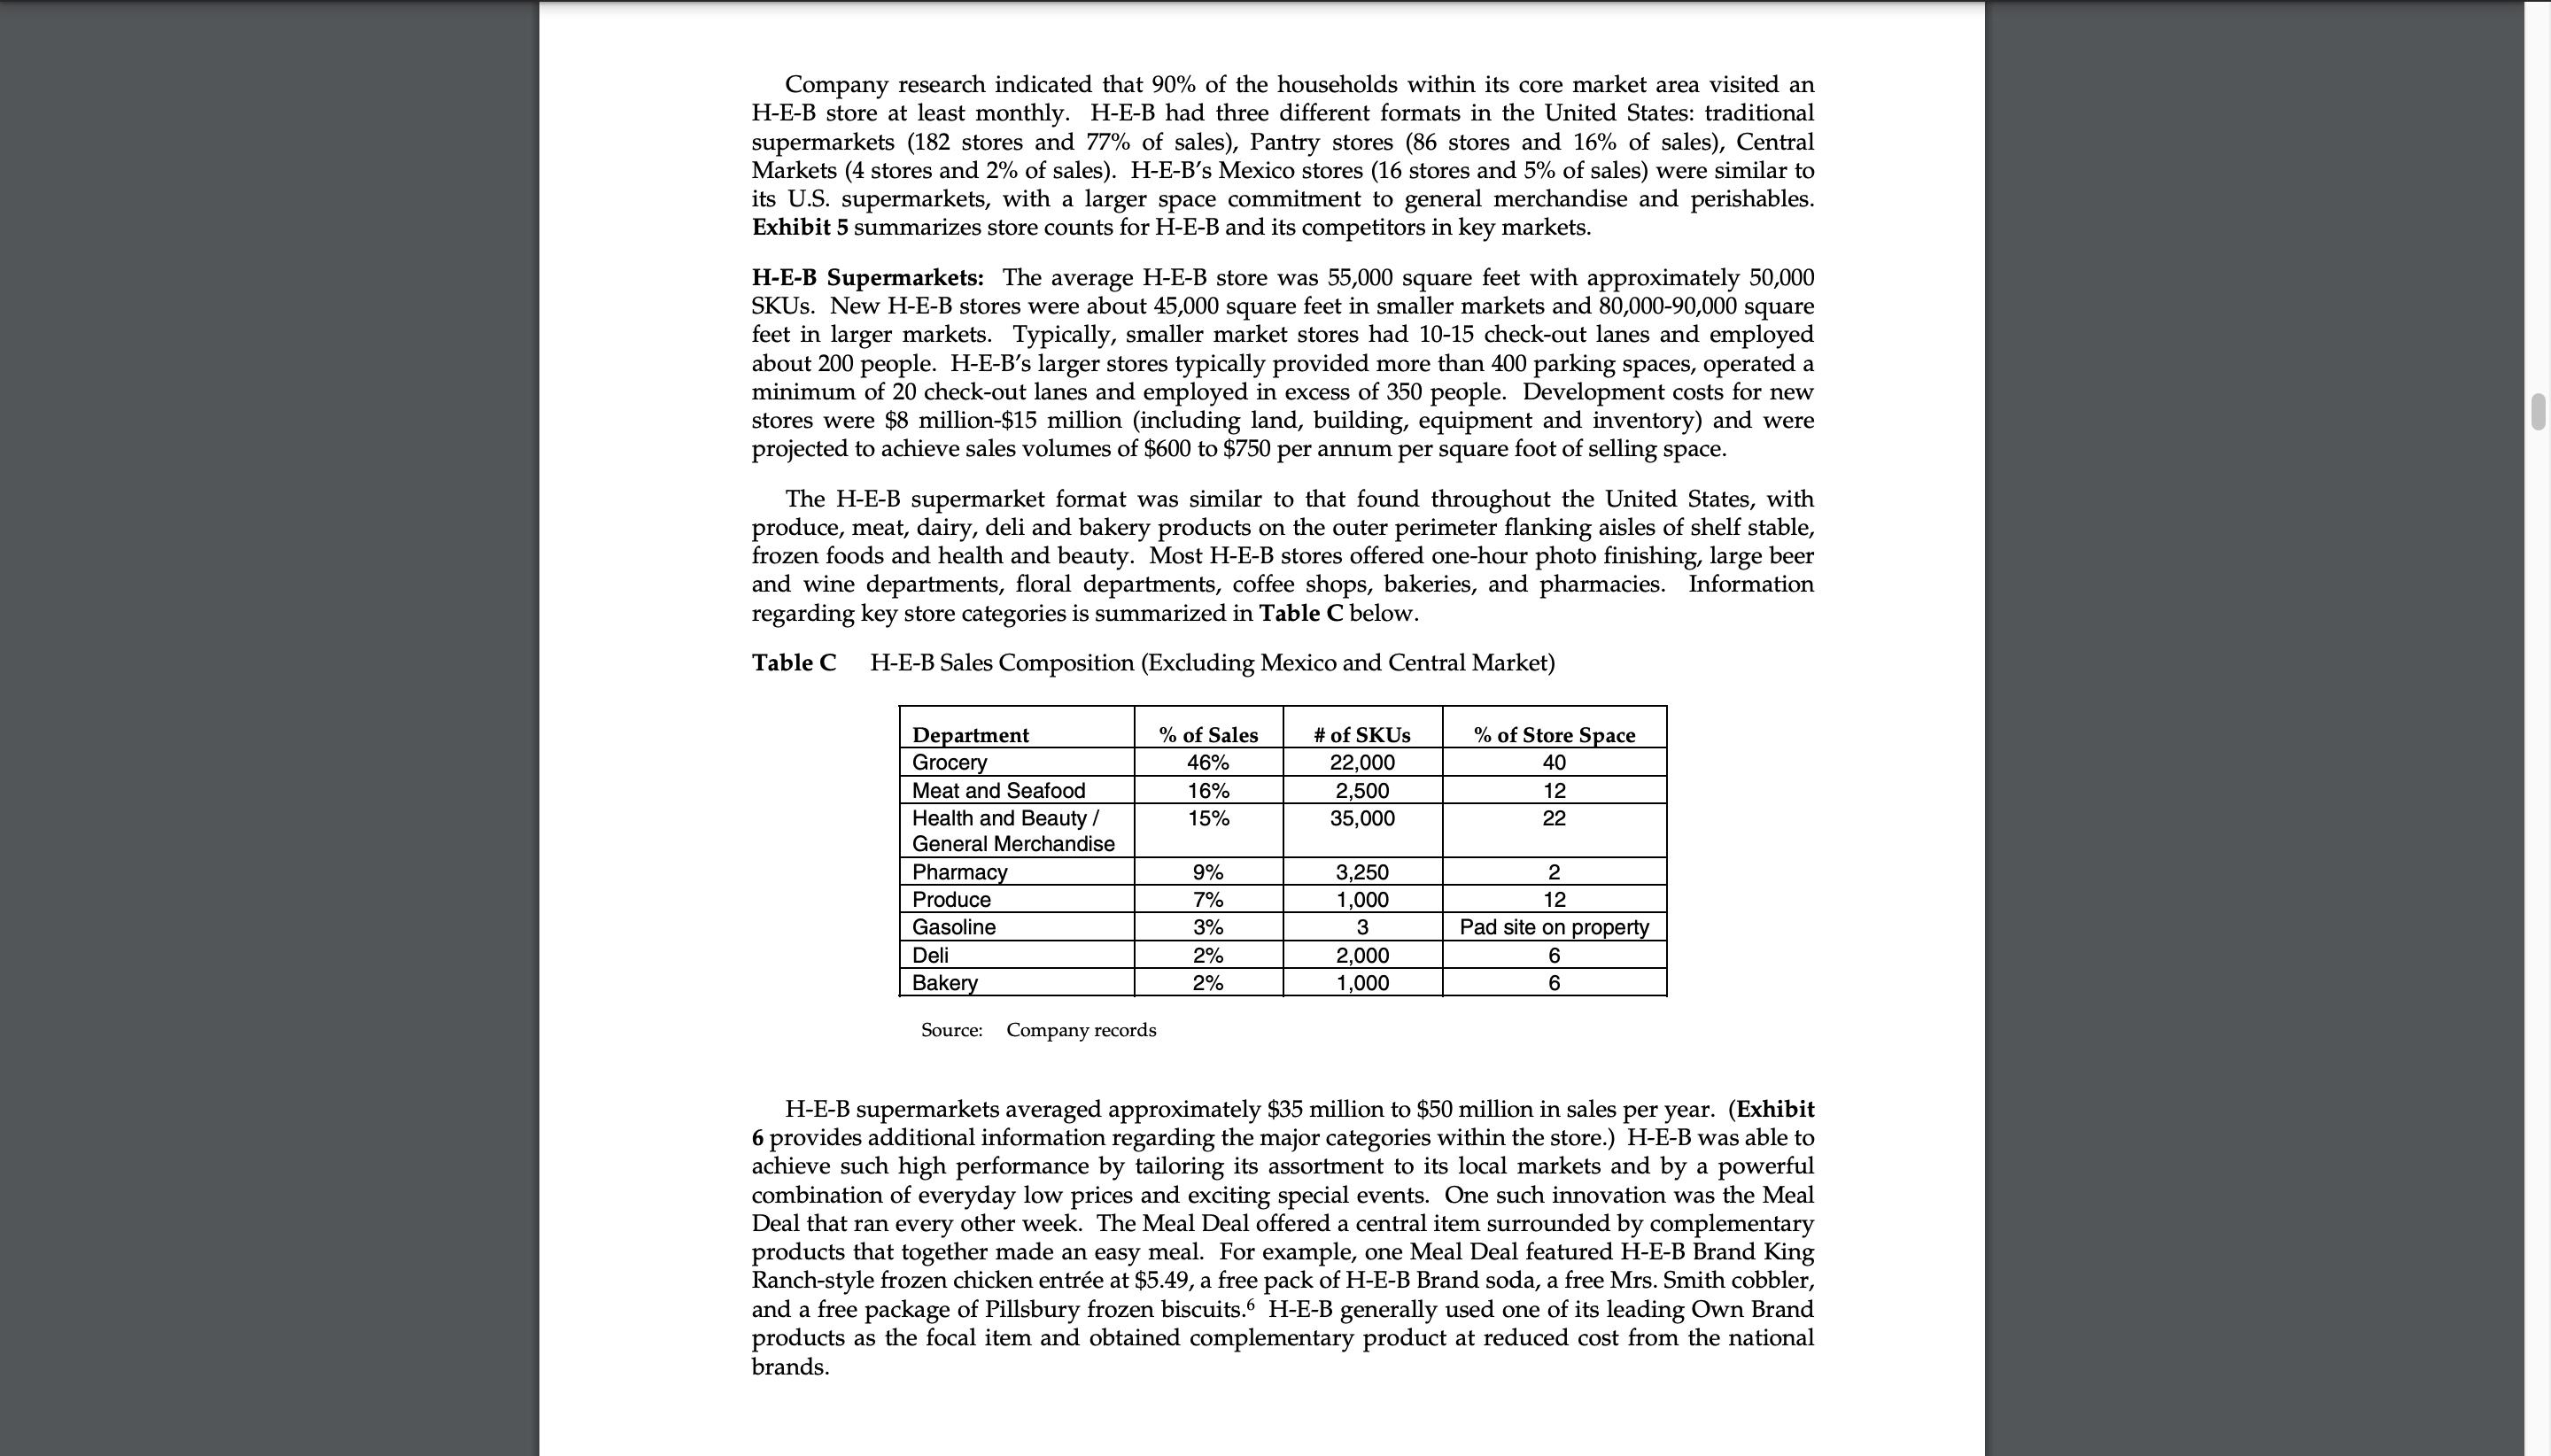
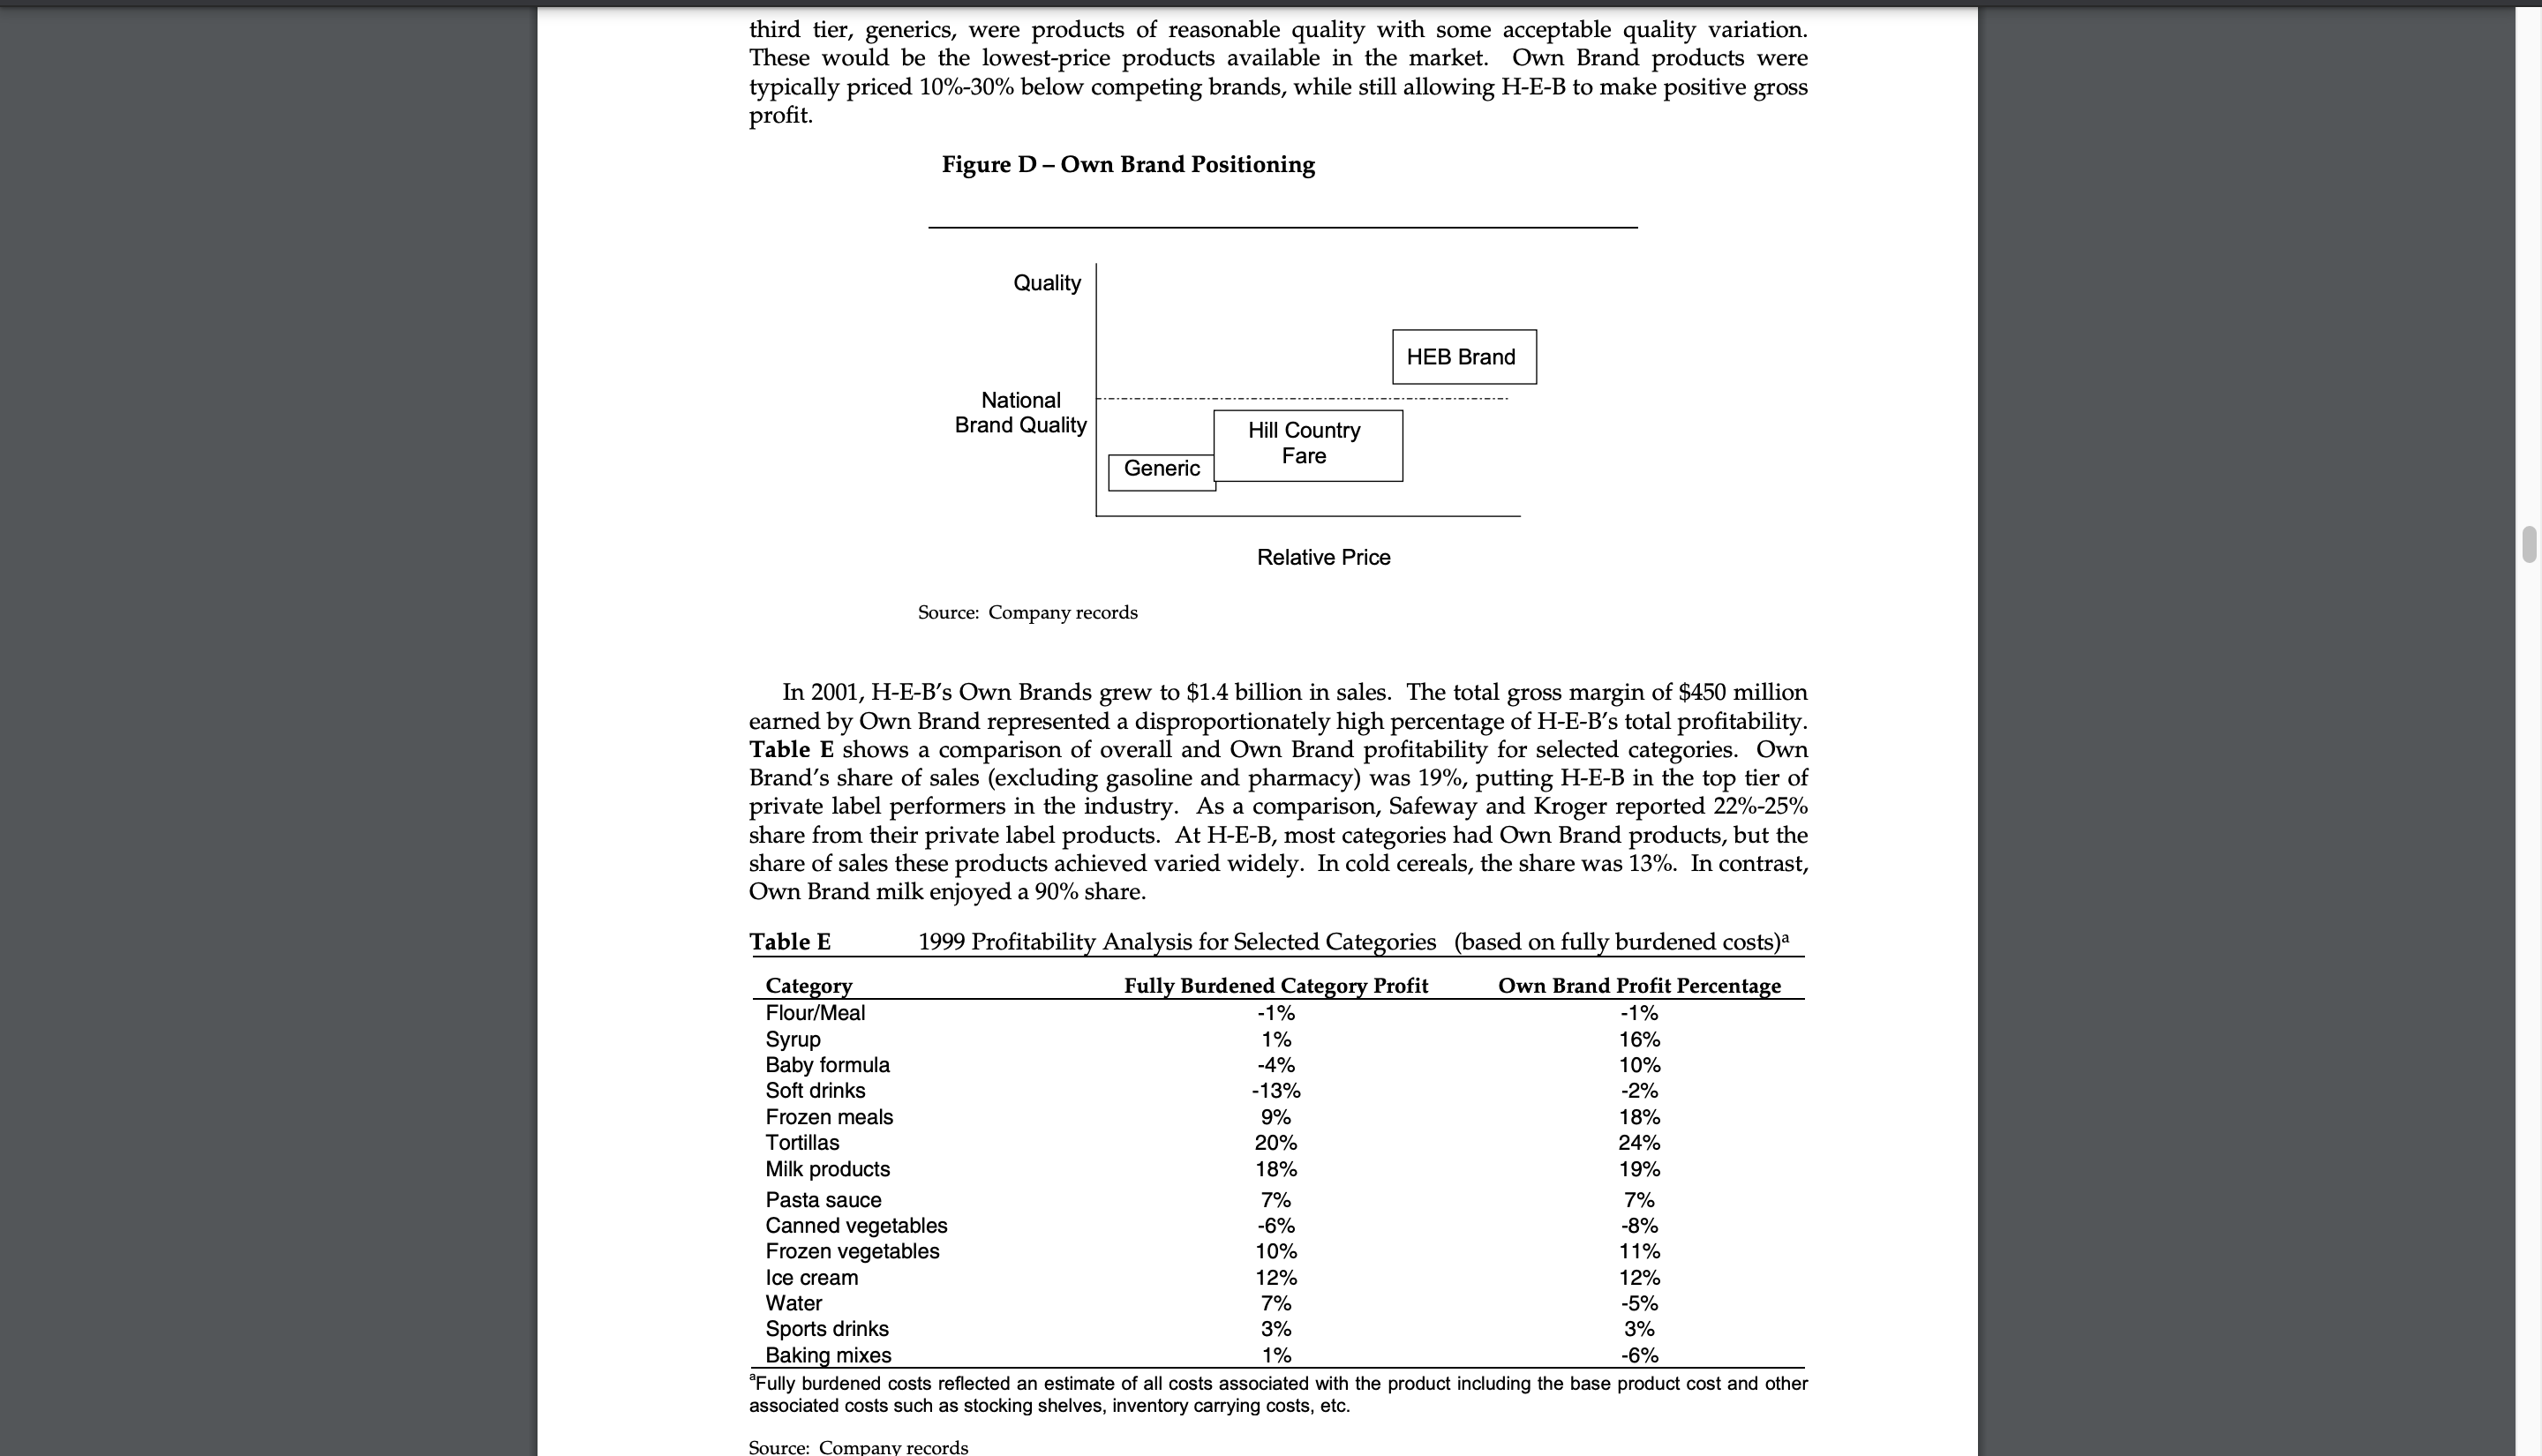
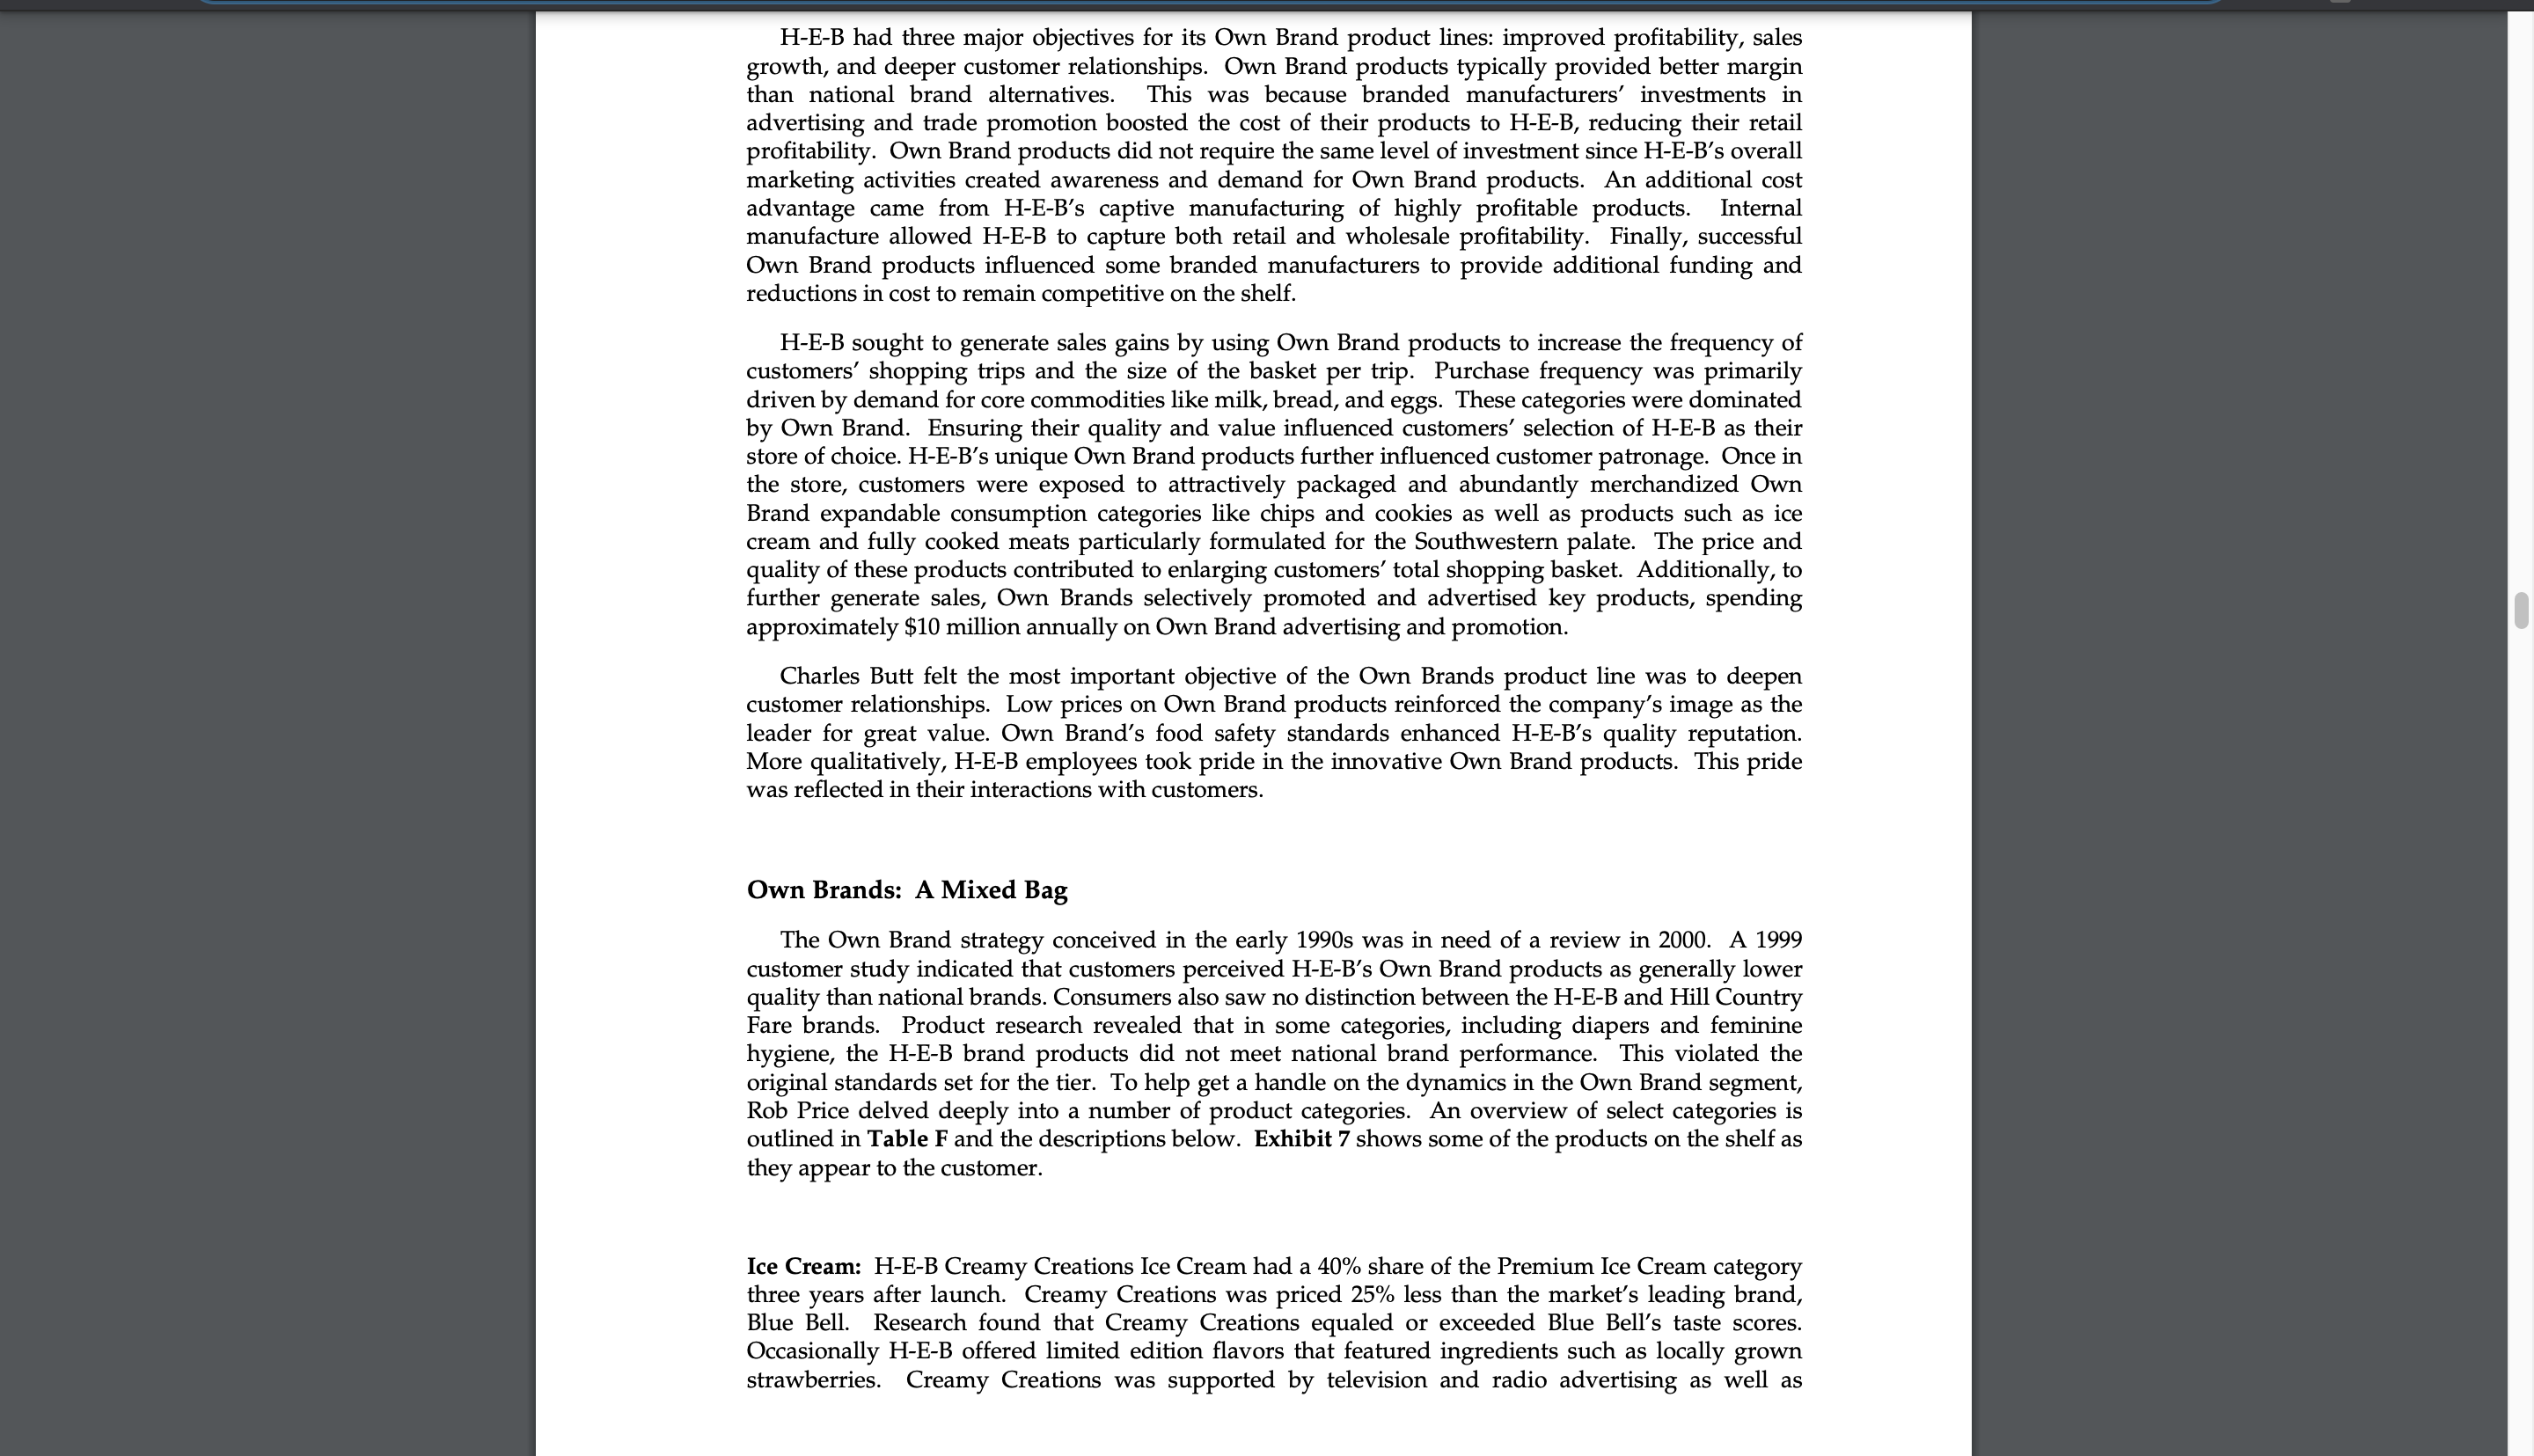
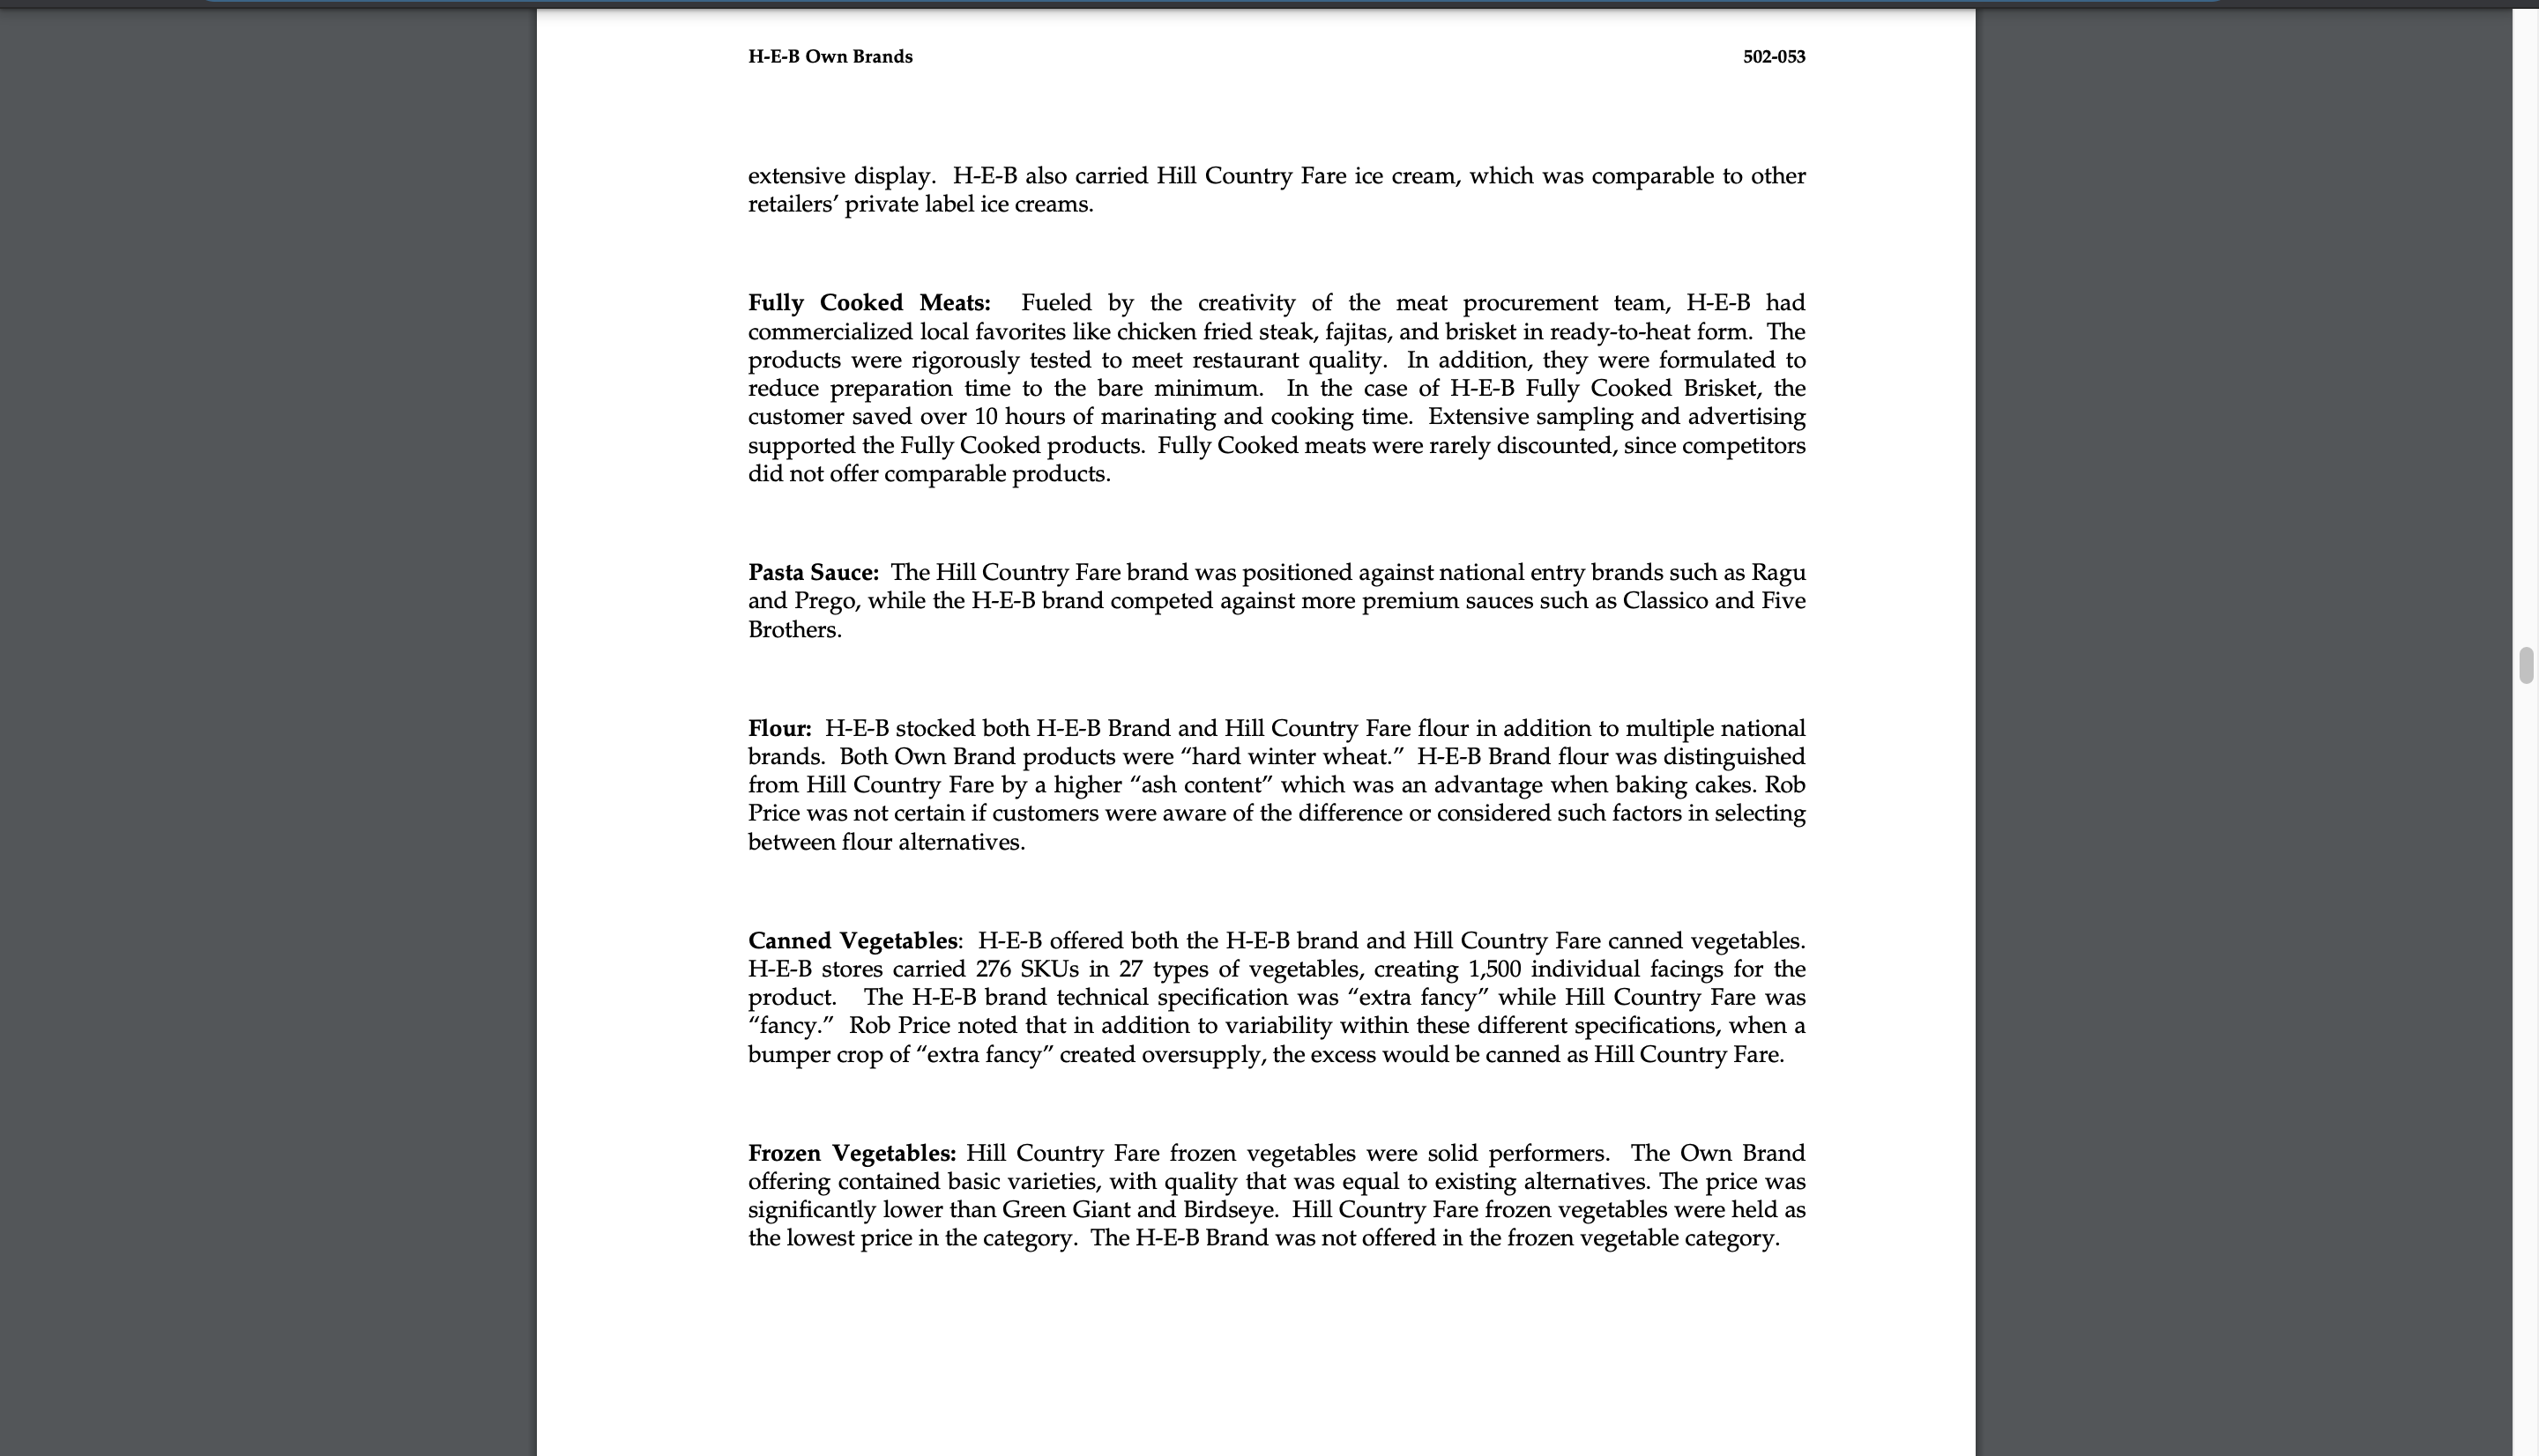
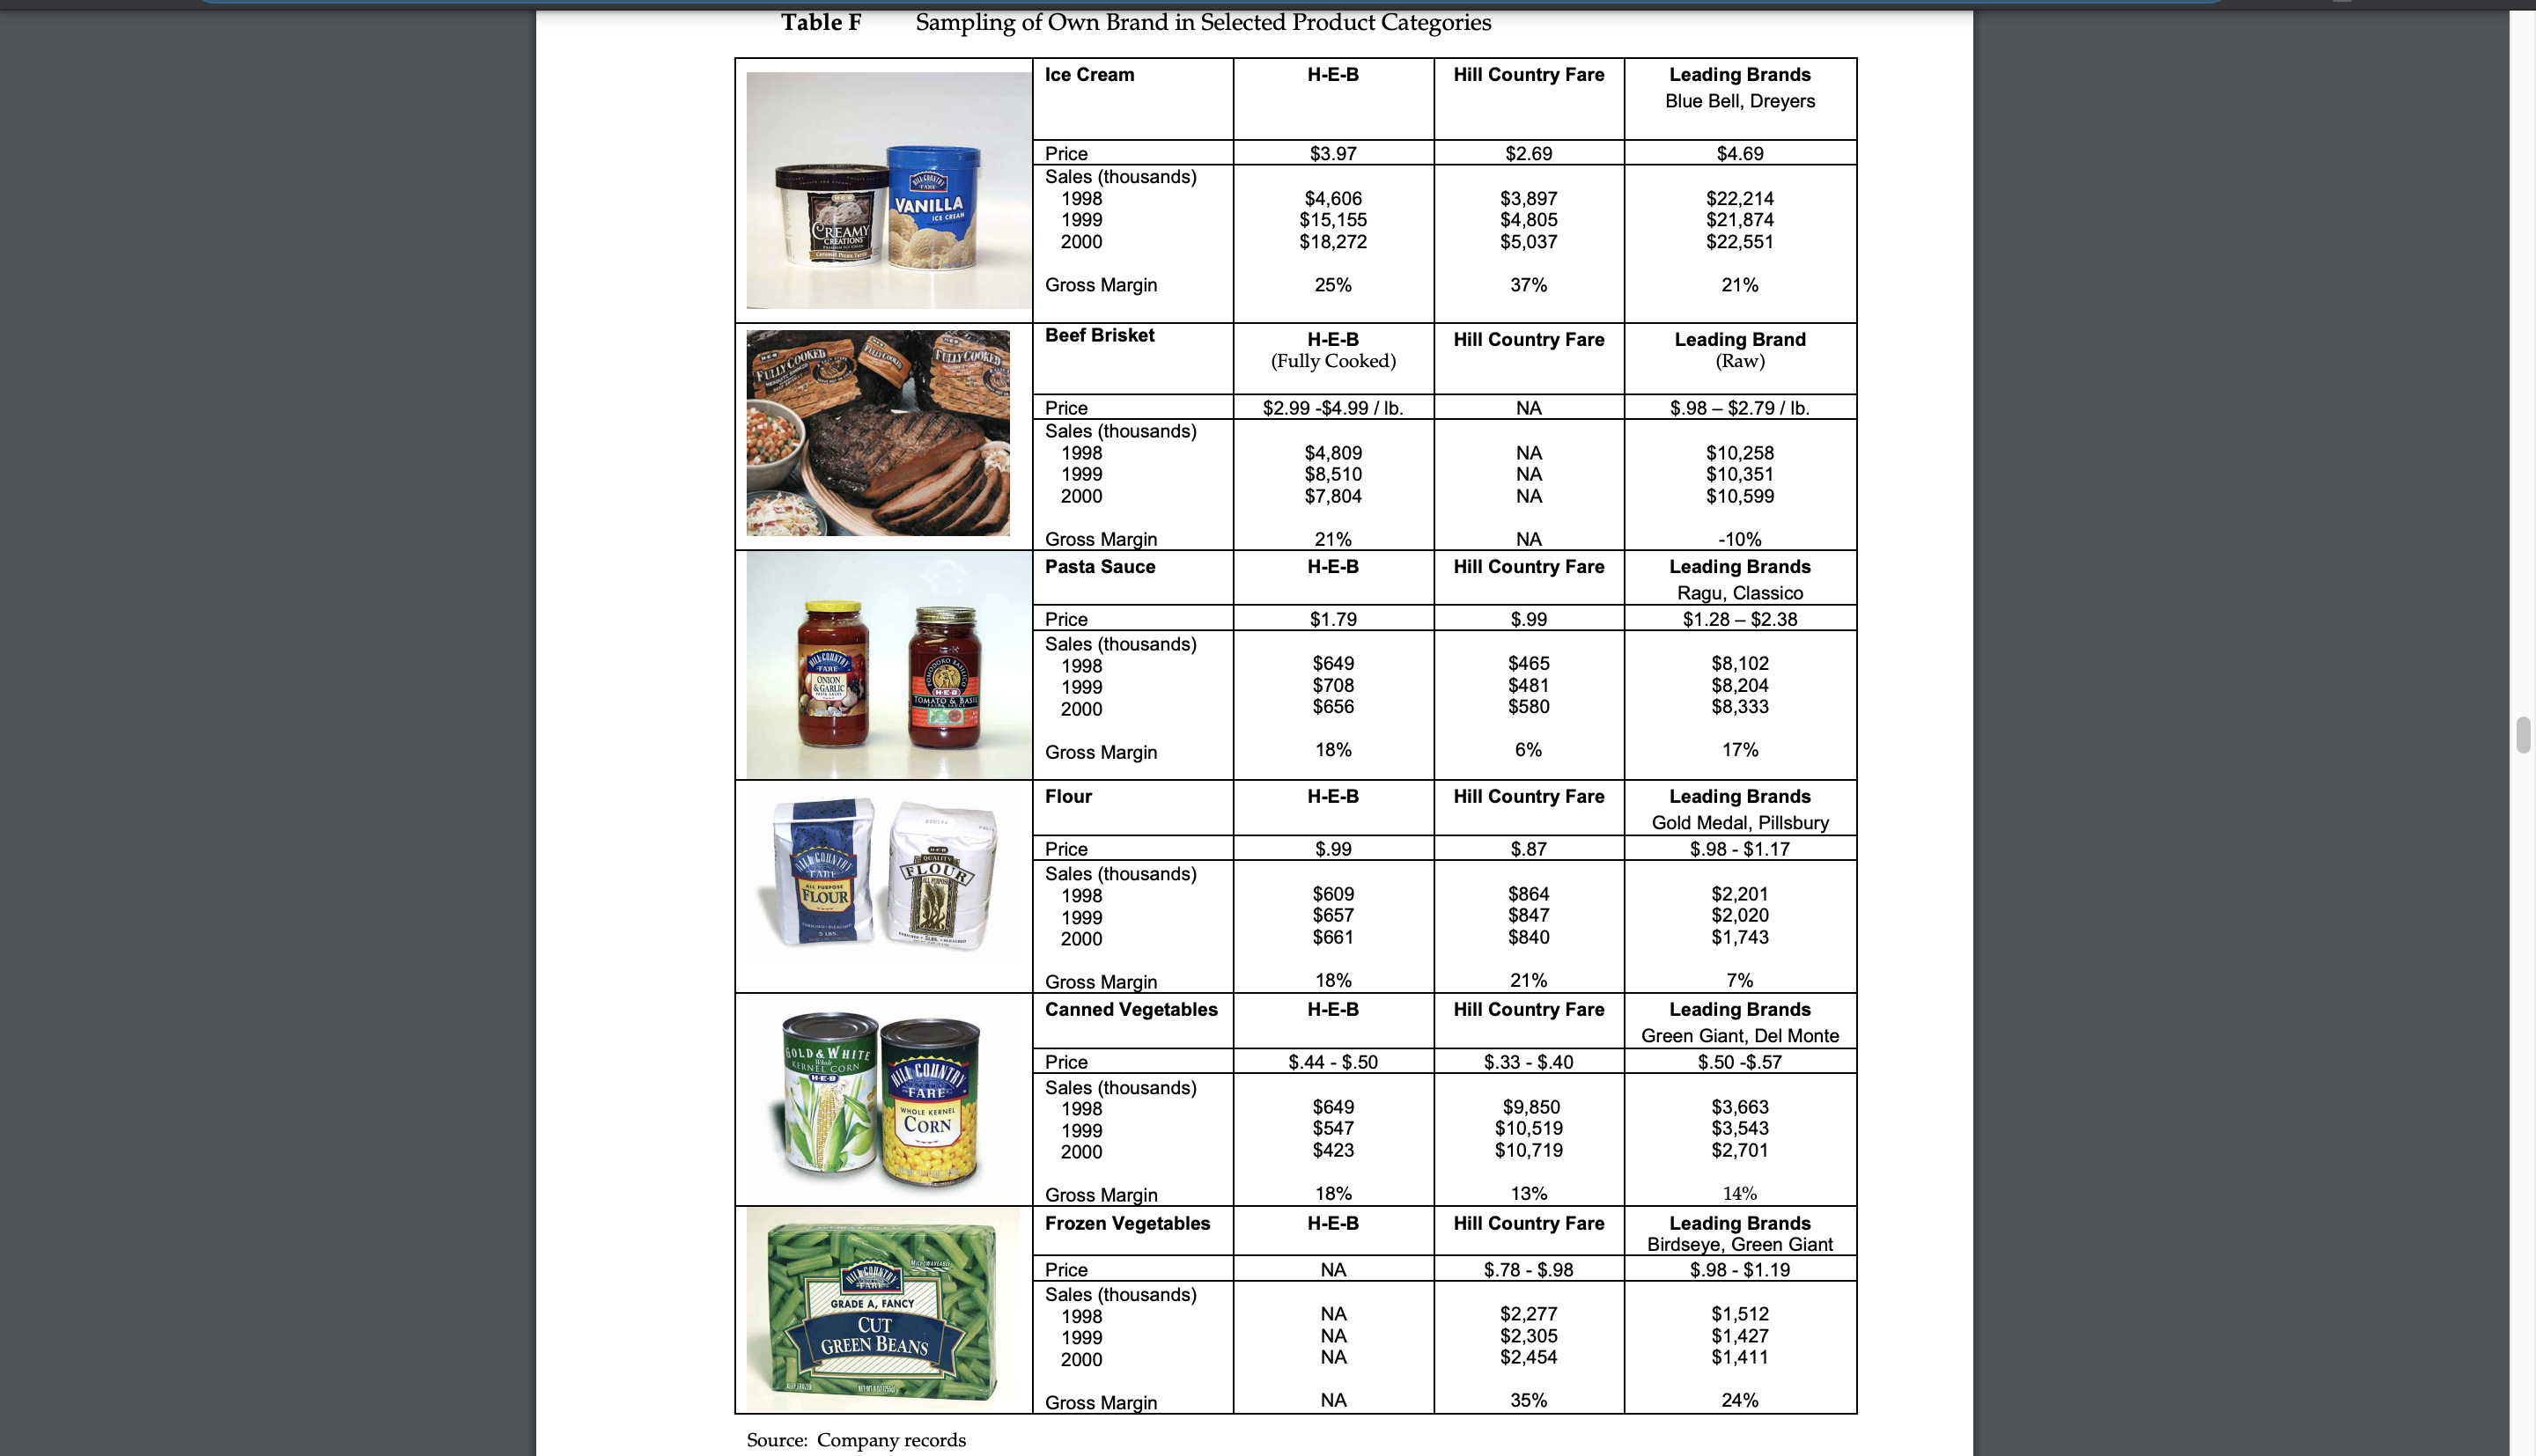
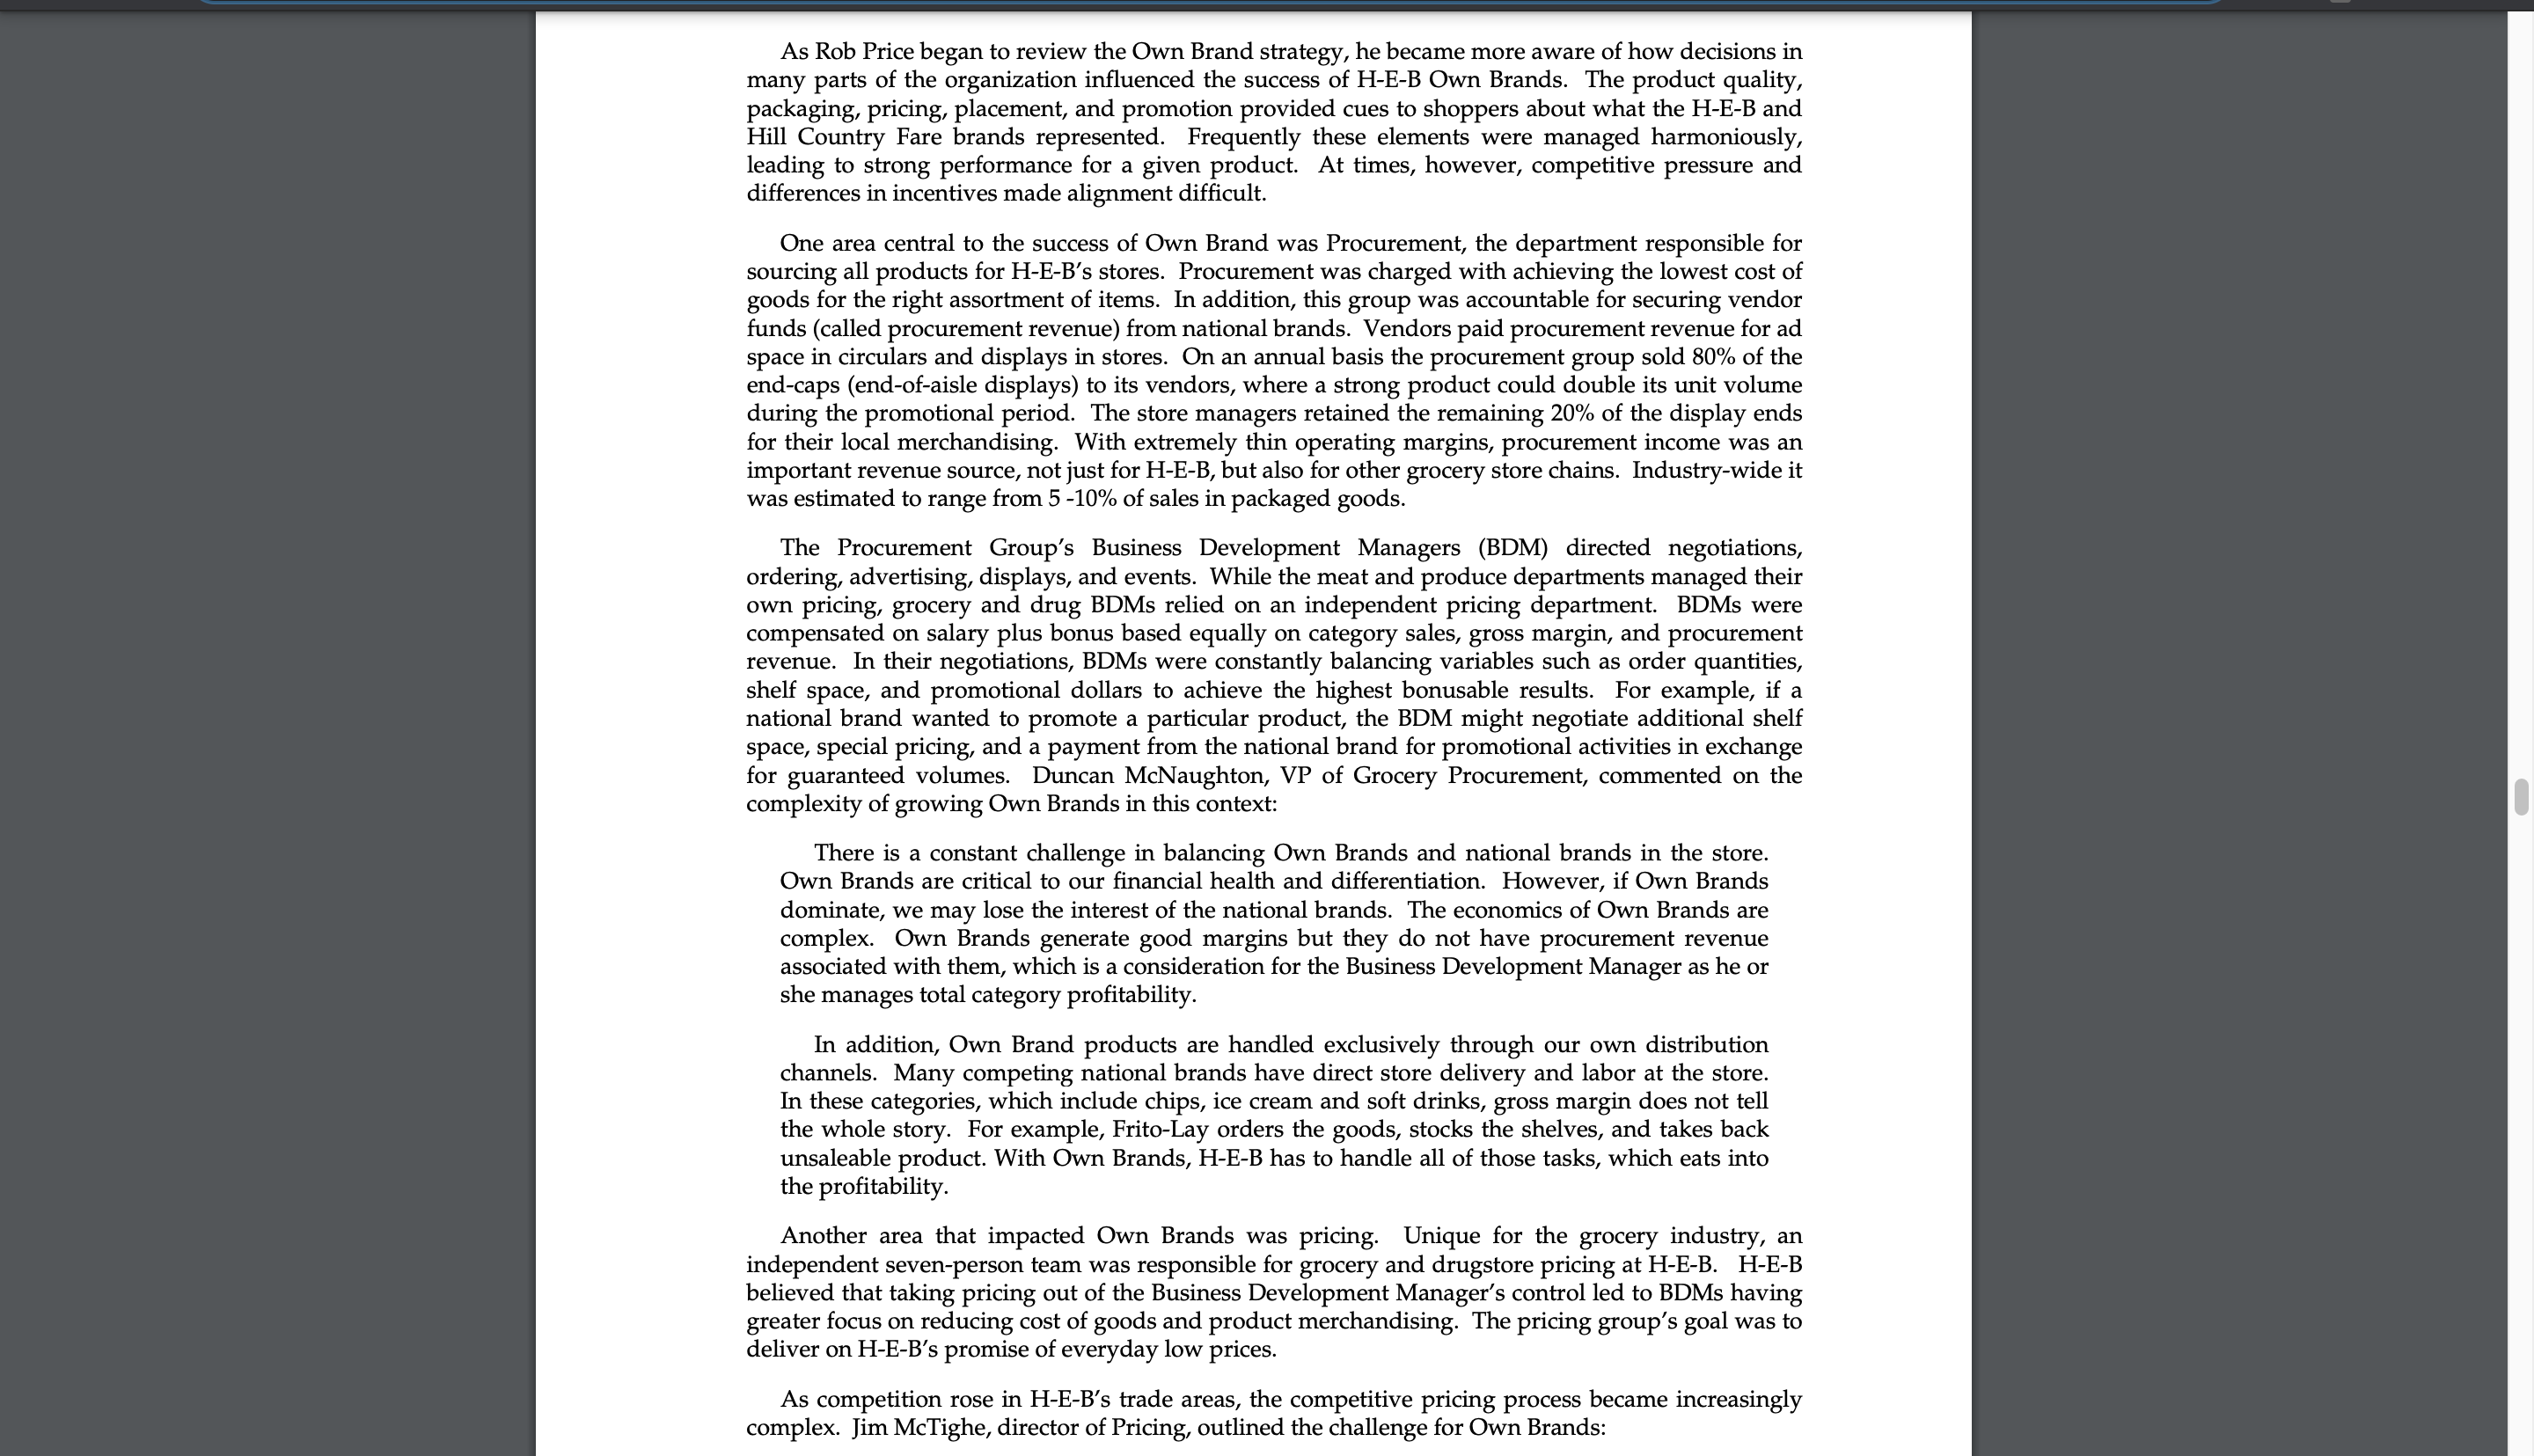
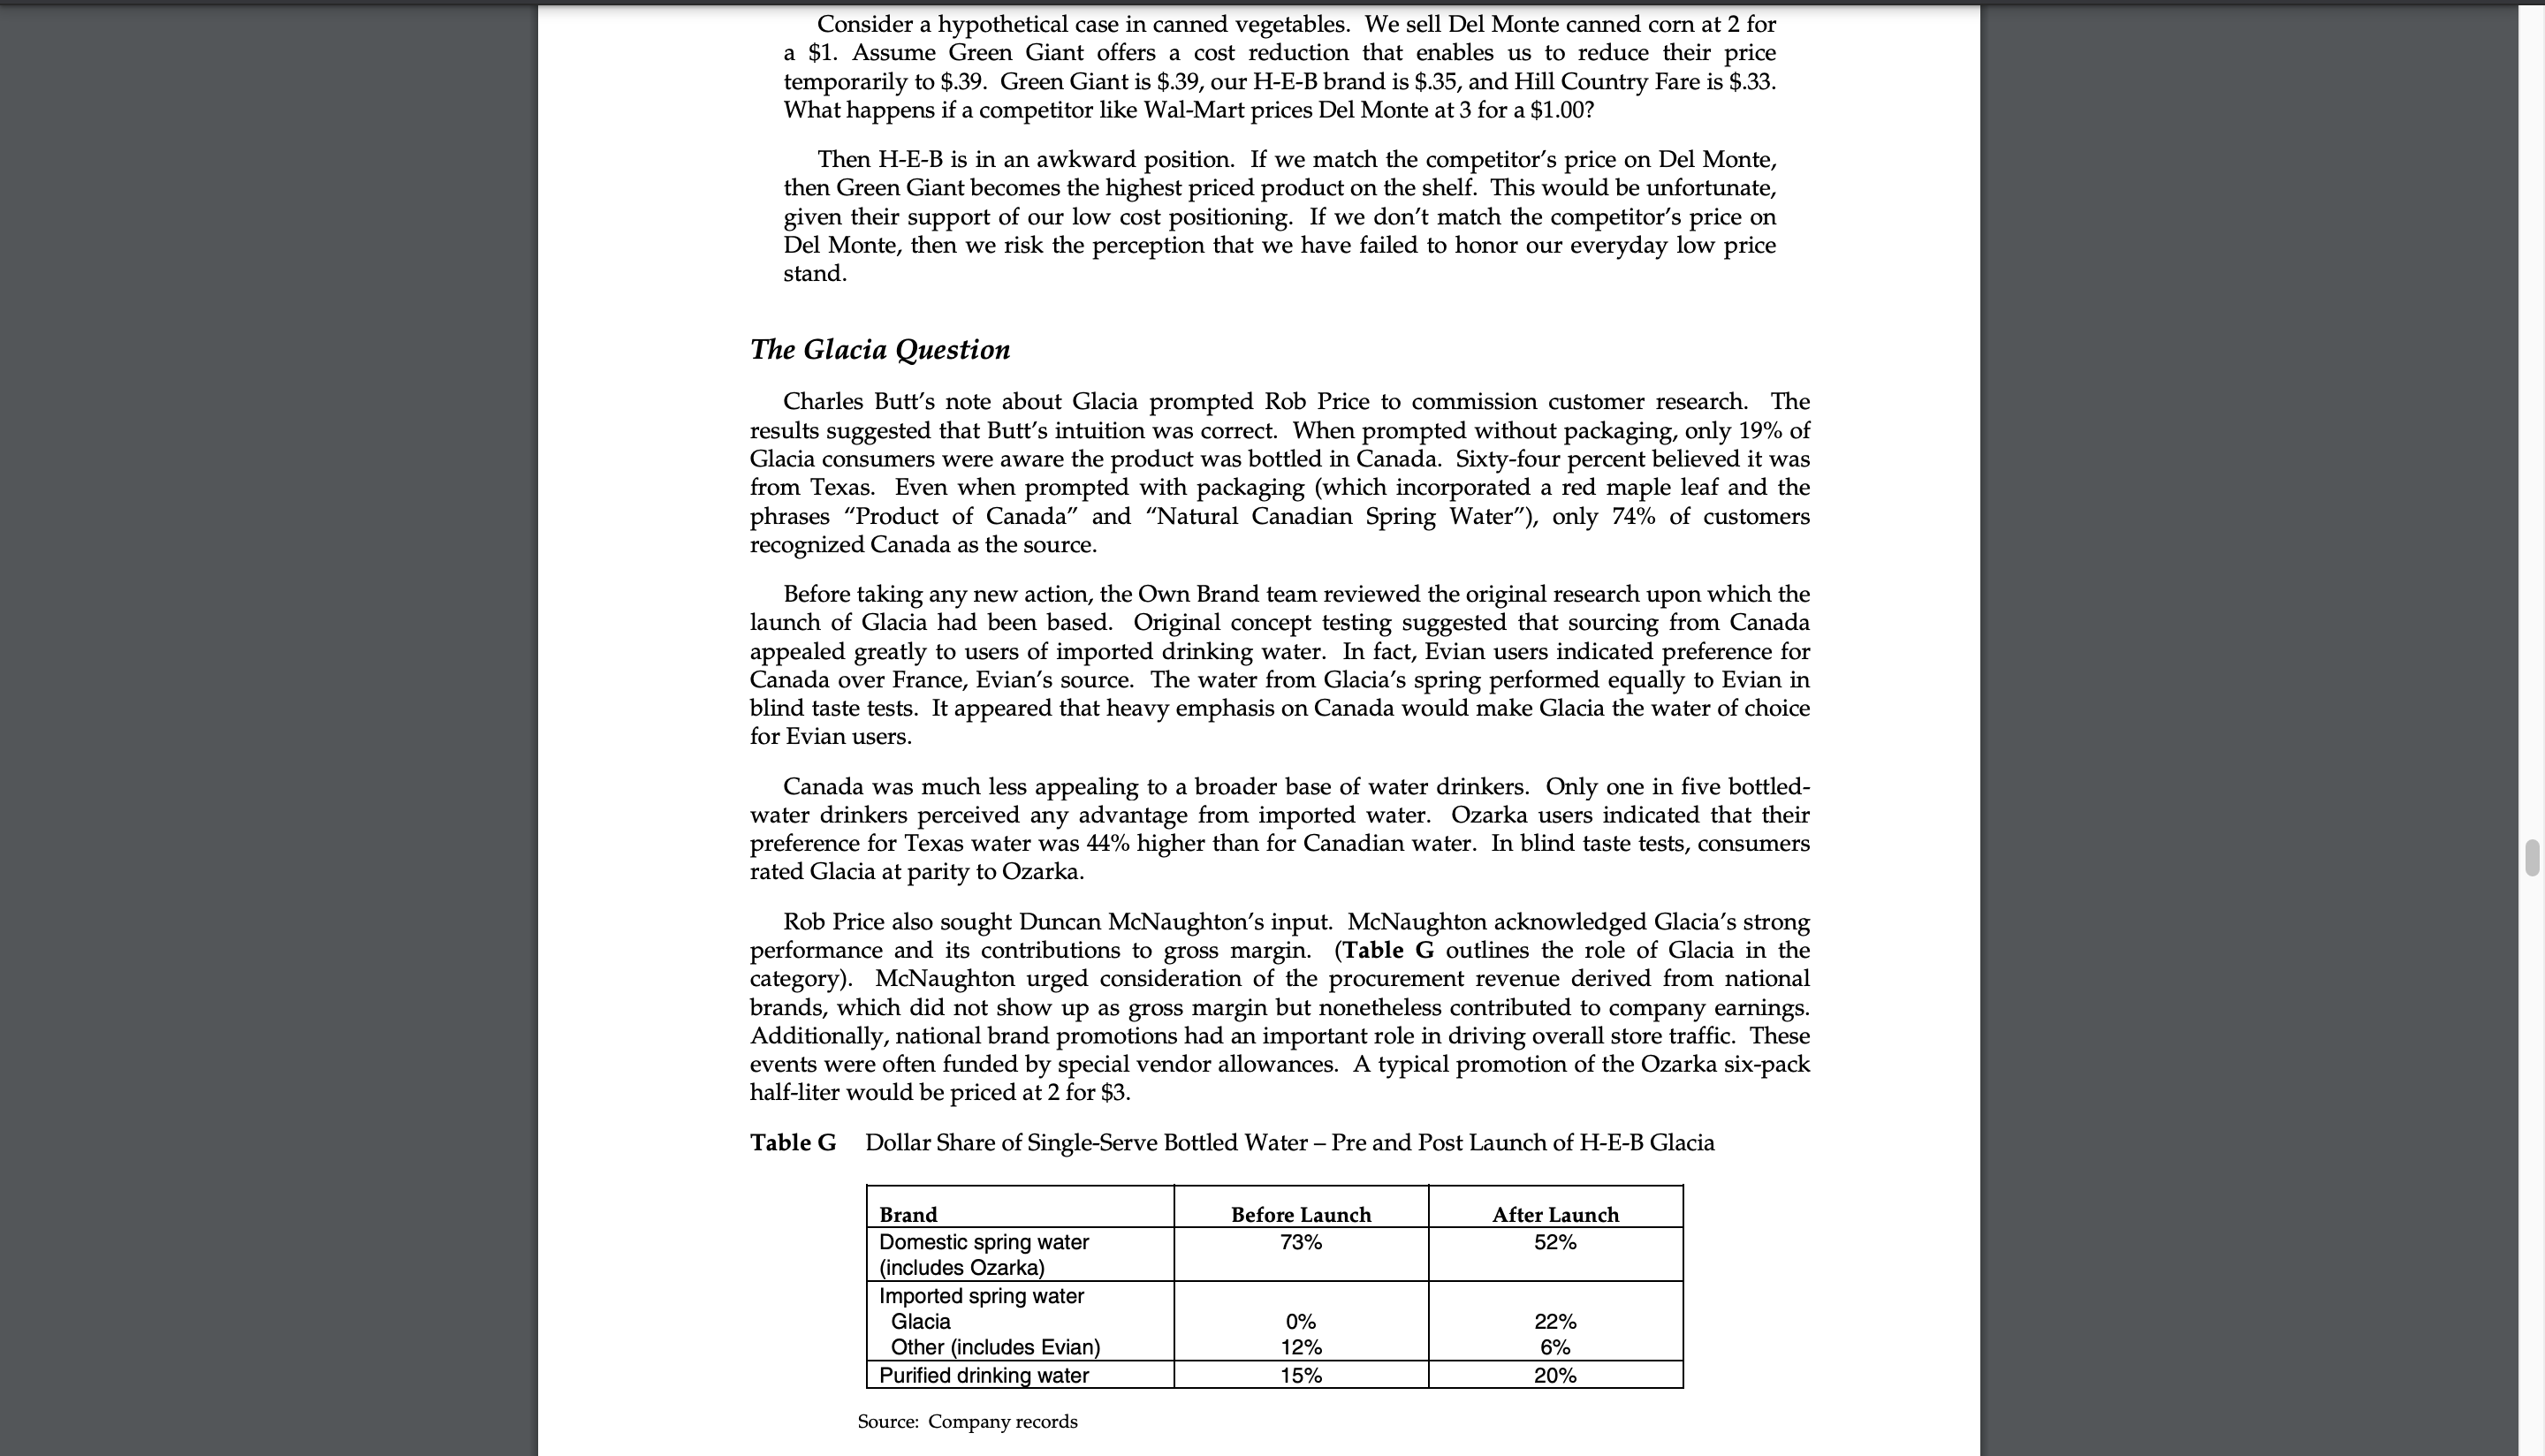
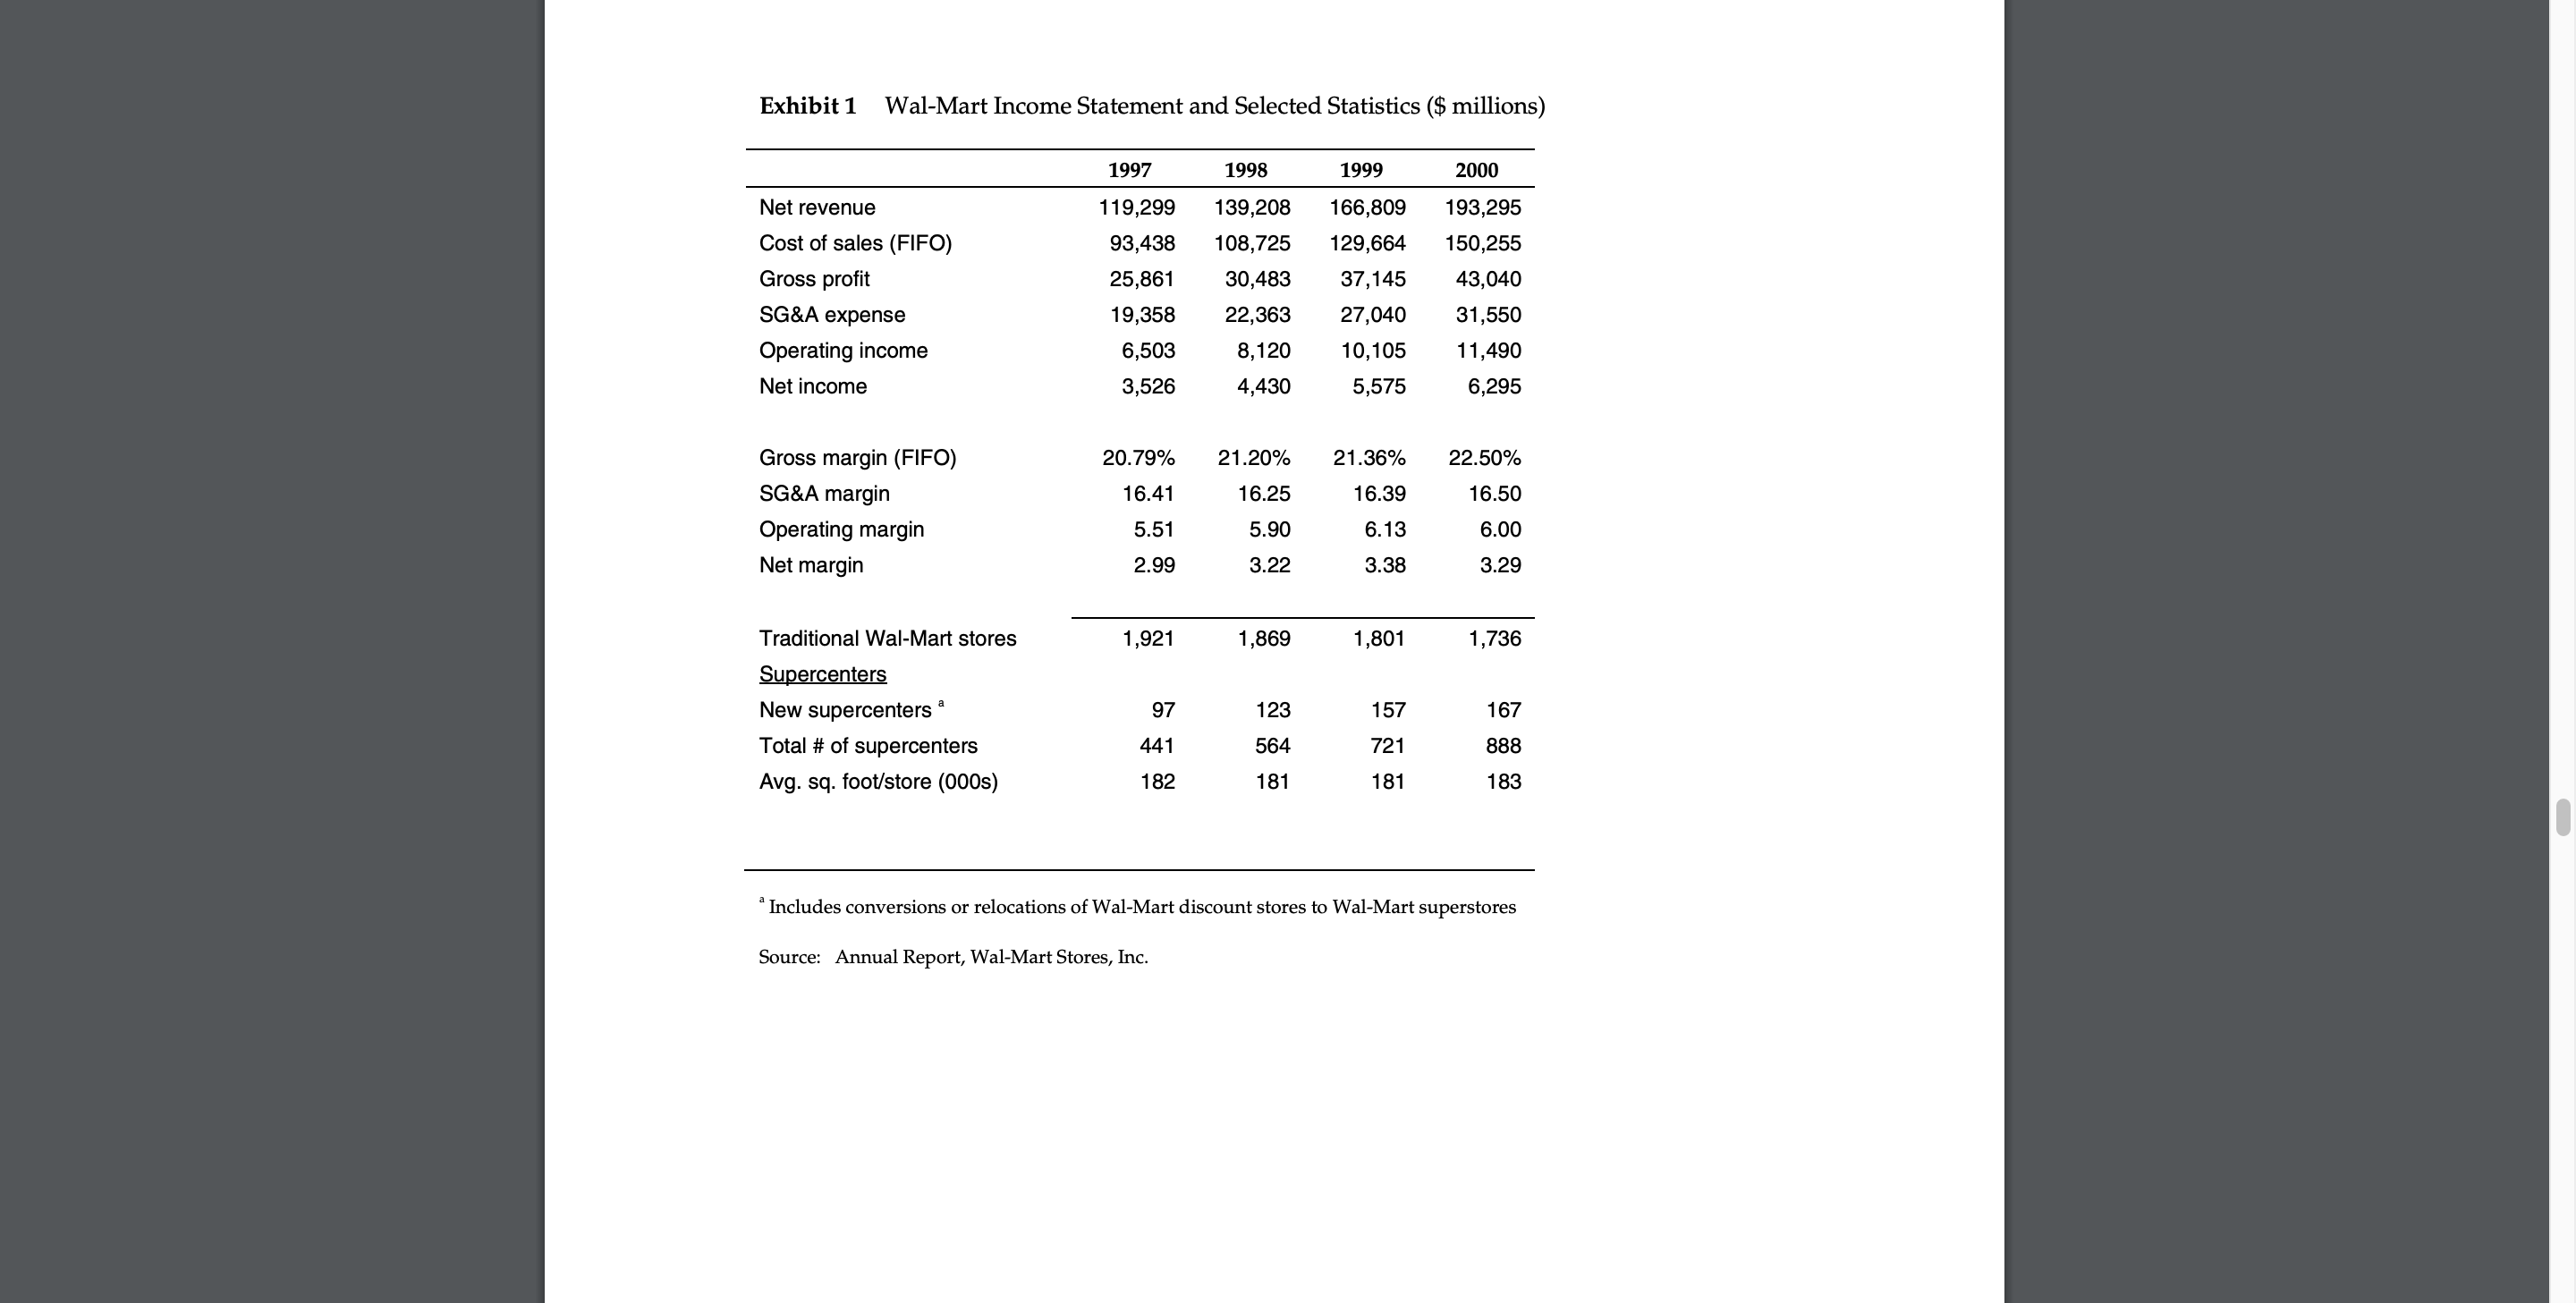
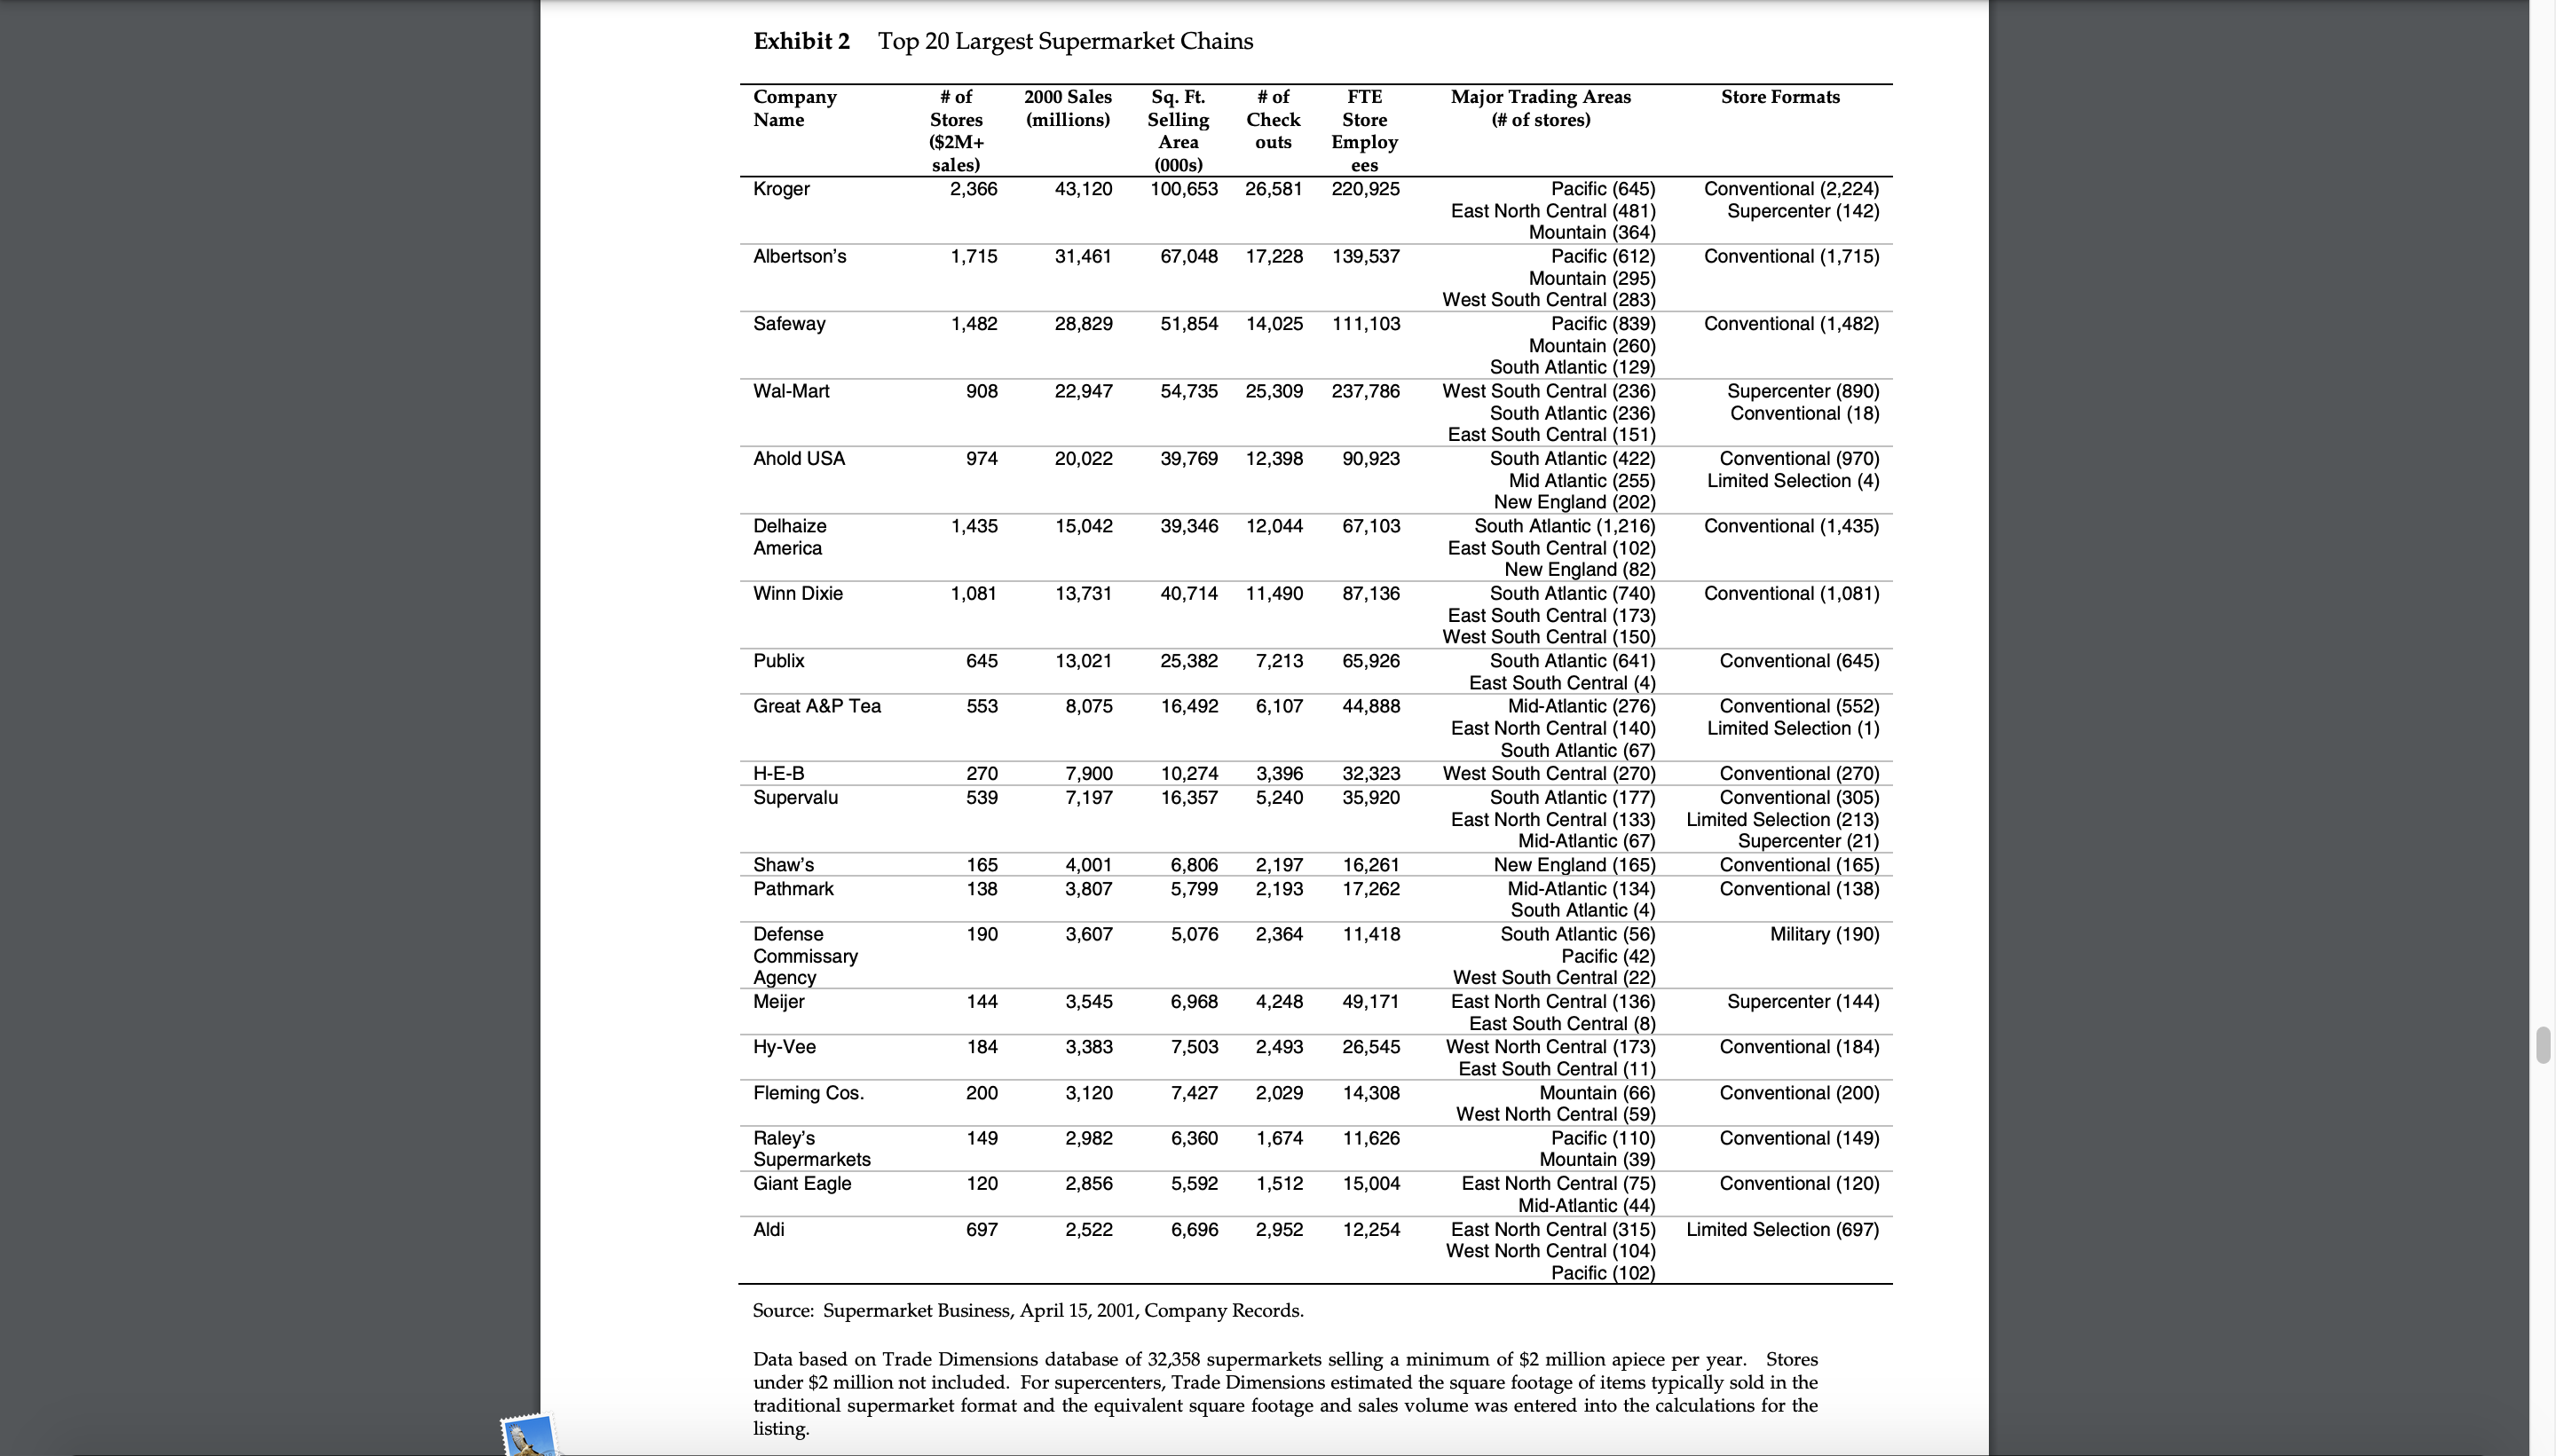
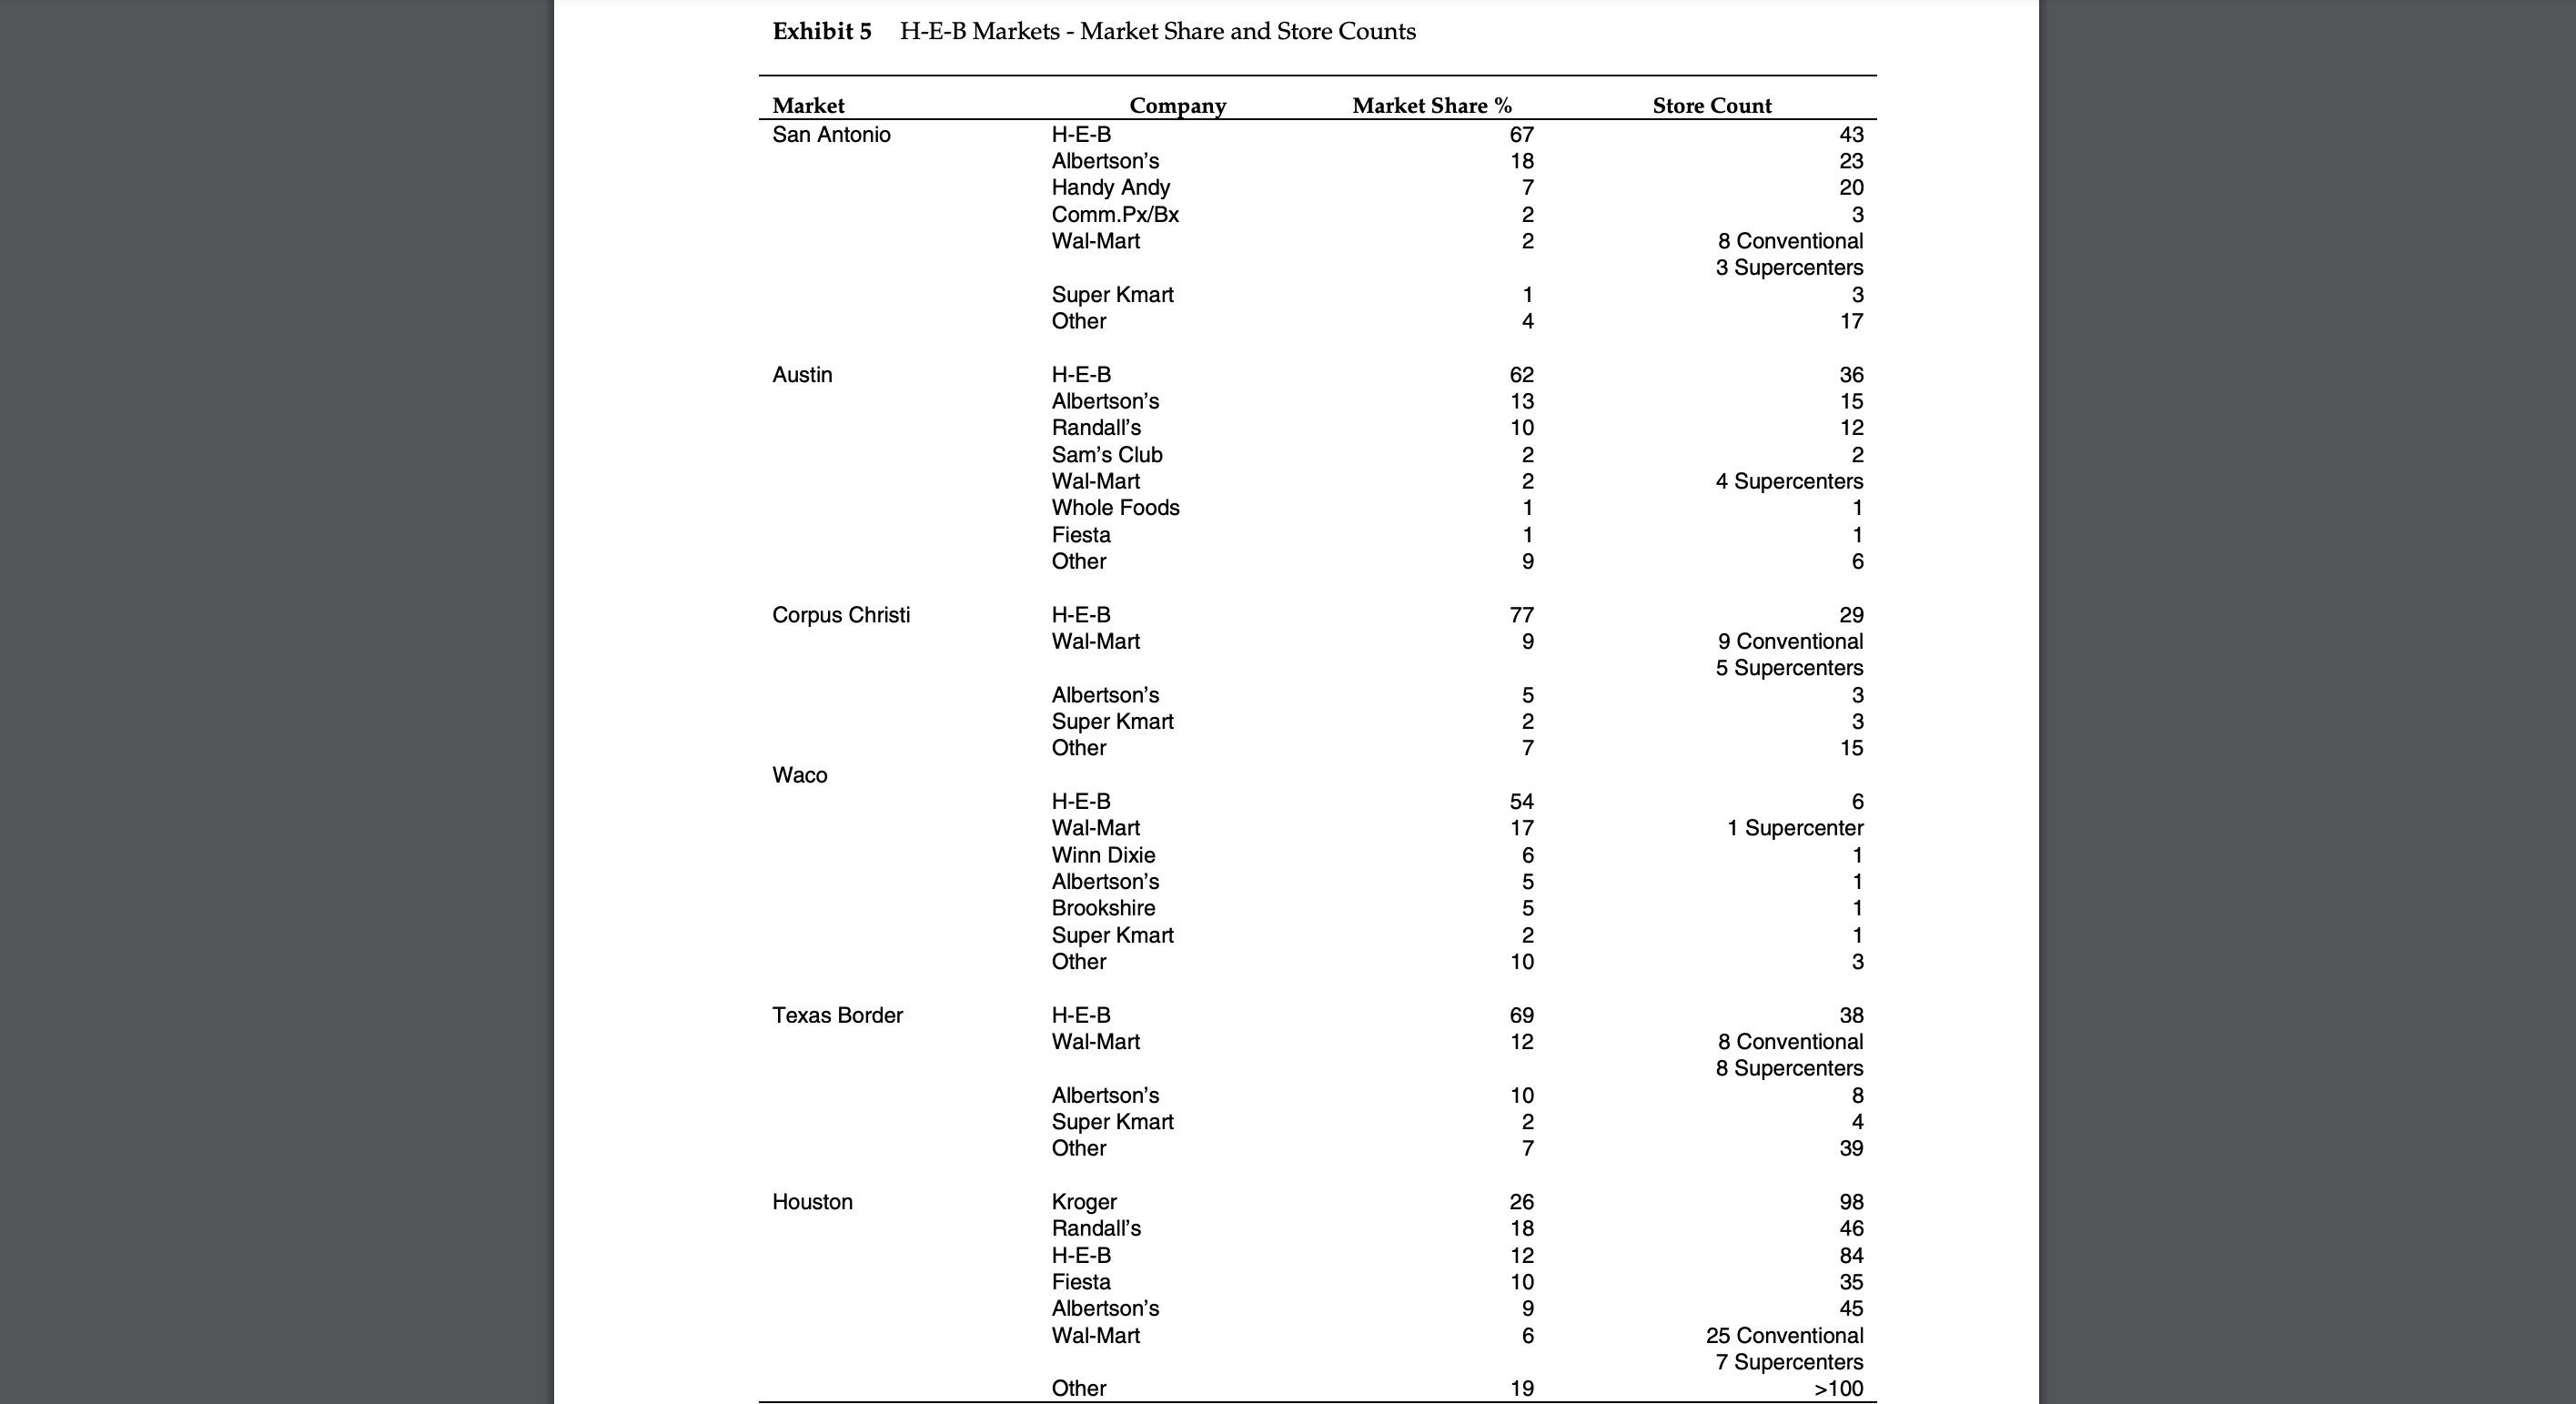
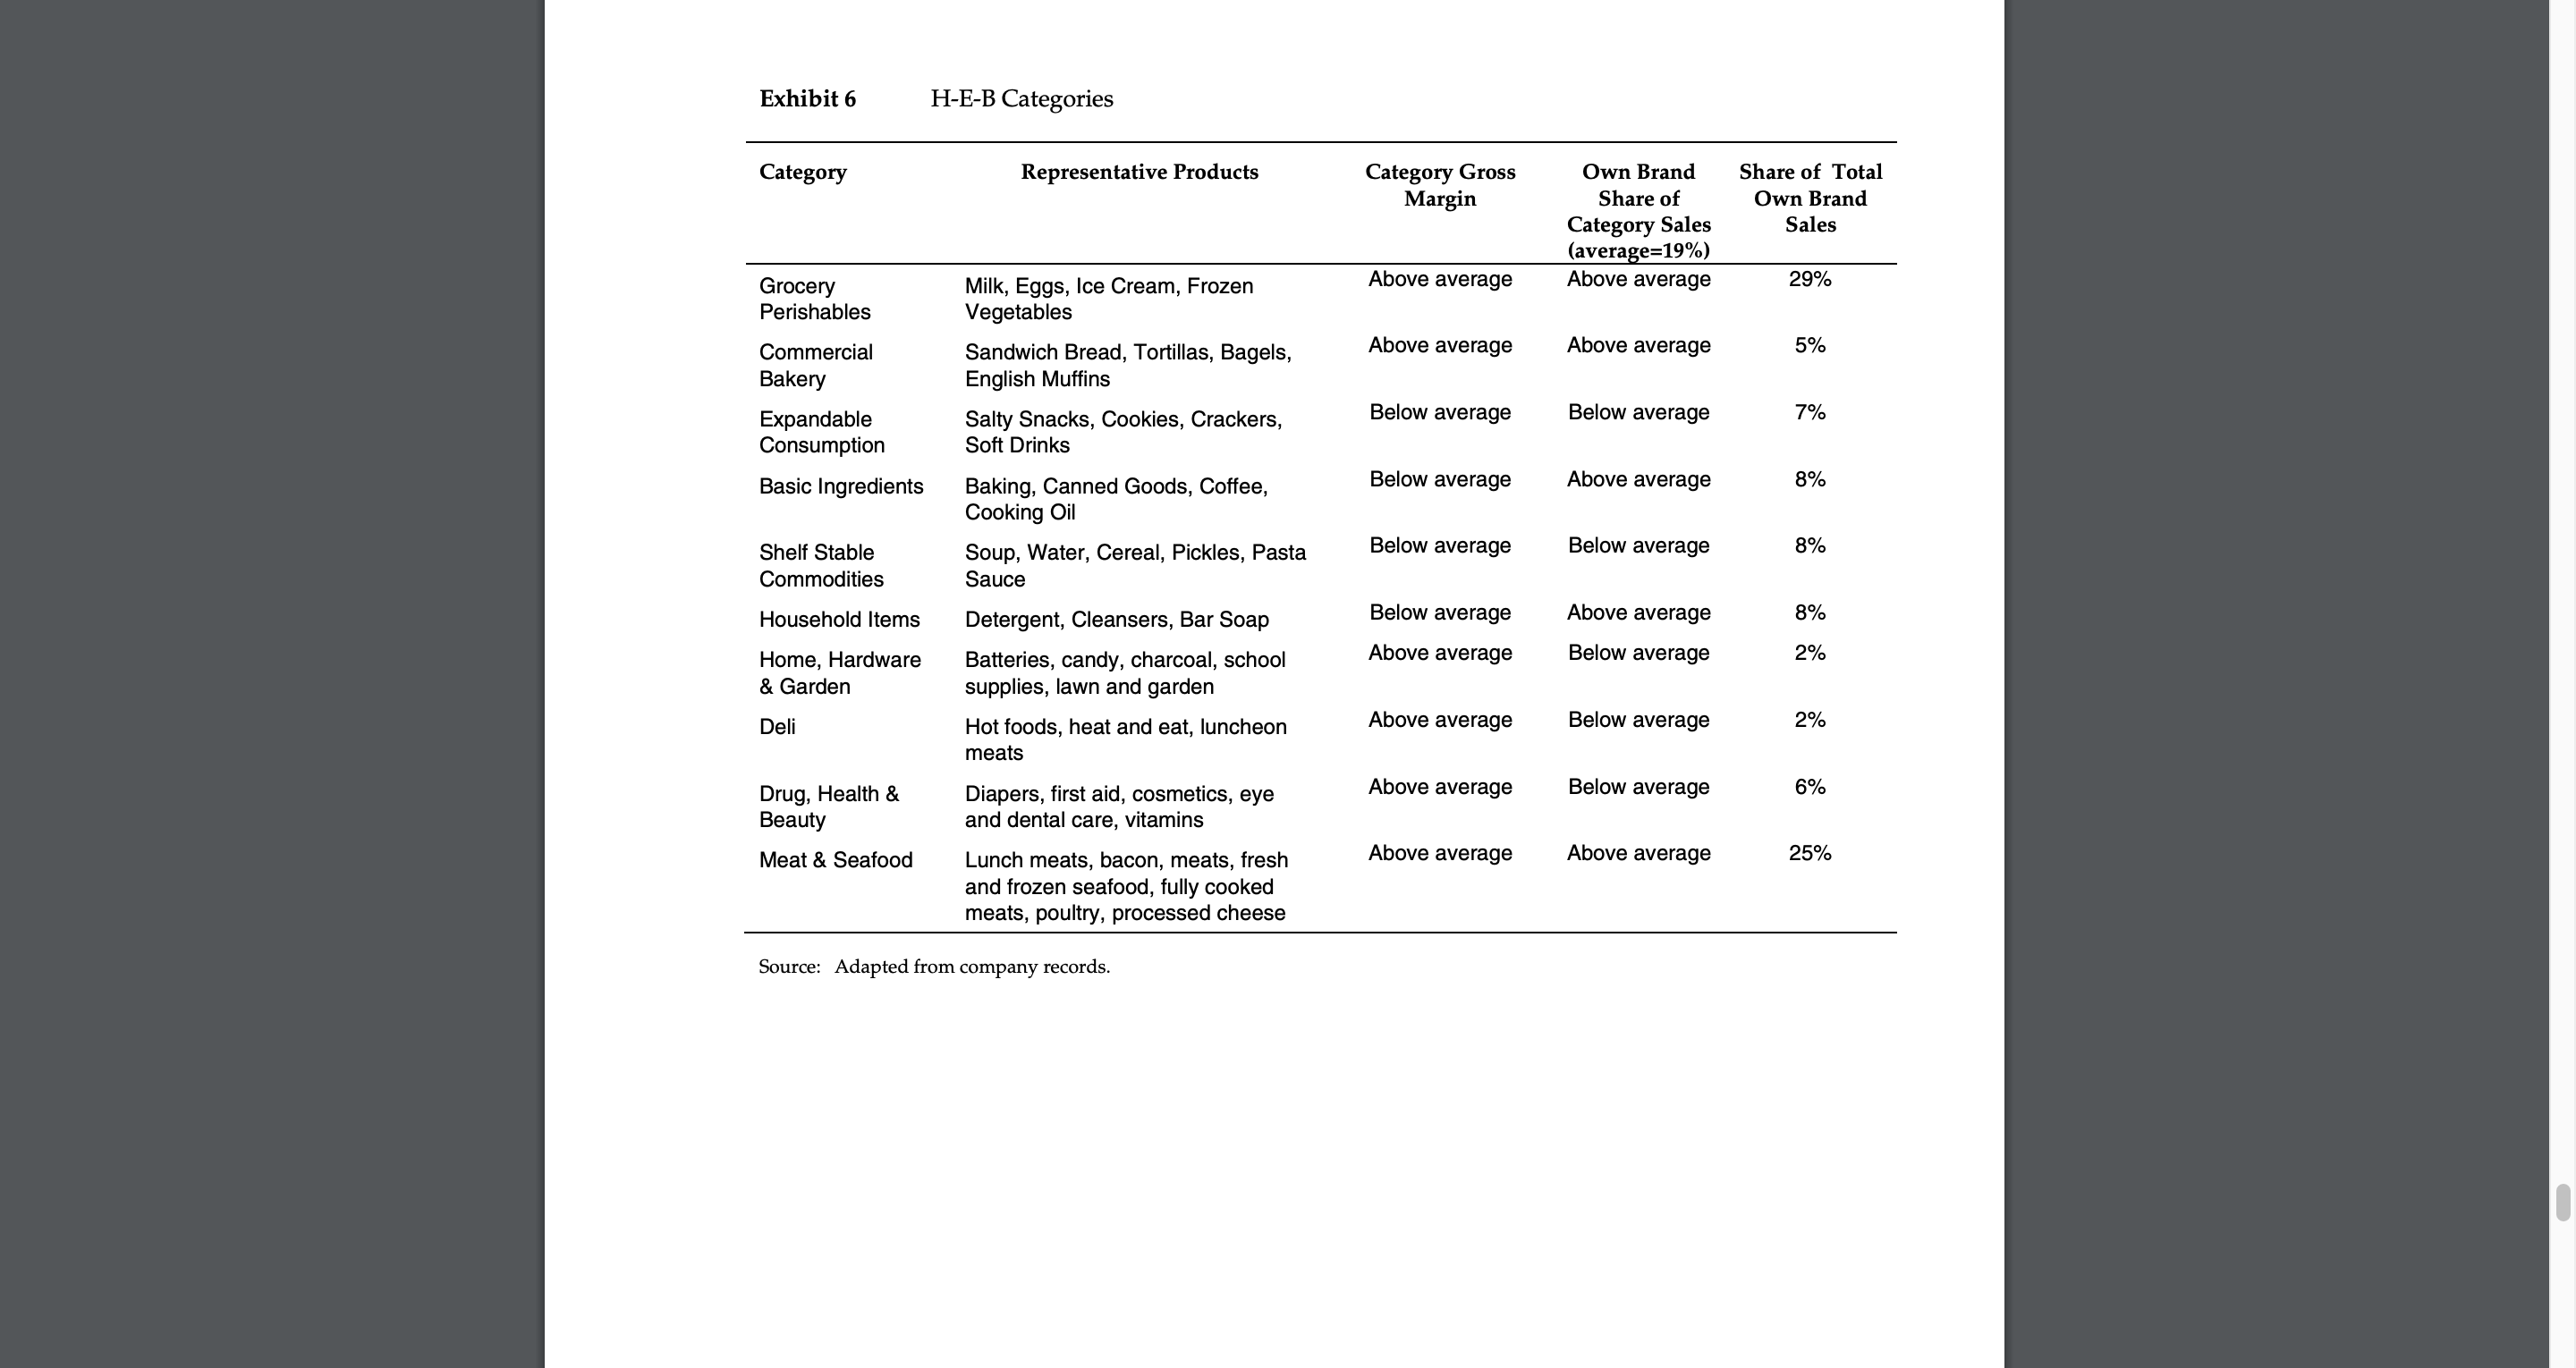
H-E-B Own Brands Rob Price, a 1997 graduate of a leading Business School, moved through the aisles of an HvE-B supermarket shortly after being named vice president of Own Brand in early 2000. He noted many of the strengths that had made HE-B a leader in its markets. The supermarket was clean, the store associates were friendly, the shelves were well stocked with a broad assortment of merchandise, and the meat and produce departments featured appetizing fresh products. Above all else, H-EB was delivering on its promise of everyday low prices. As Price scrutinized the shelves, he paid close attention to his own area of responsibility, the private label portfolio. HE-B's Own Brands included 3,000 items concentrated into two principal brand families: HE-B Brand and Hill Country Fare. Rob Price conunented: H-E-B's Own Brands are key to the company's ongoing success. Currently our Own Brand products account for 19% of sales and generate gross margins 50% higher than national brands. More importantly, if we manage our Own Brand product portfolio well we can deepen our relationships with customers. Our chairman, Charles Butt, is passionate about our Own Brand business reaching its economic and strategic potential. Indeed, because Own Brand products often carried the H-EB label (and, implicitly, the Butt family's name) Charles Butt took Own Brands' product quality and performance seriously. He recalled: When I first took responsibility for this business almost 30 years ago, H-E-B was a predominantly private label company. Recognizing the customer drawing power of national brands, I took steps to consciously build a strong national brand presence Today, we need to find the appropriate balance between our Own Brands and the national brands. I know Own Brands are important, but I'm not sure whether the European model of over 40% share is right for us, and neither is a store controlled by the national brands. I would like to target 30% of sales within the next five years. Given Charles Butt' 5 deep interest in Own BrandS, he often queried department managers directly about Own Brand strategy and tactics. For example, Butt took interest in HE-B Brand Glacia spring water, a product launched shortly after Rob Price took charge of the Own Brand department. Rob Price received the following note in August 2000: bottled water was an important category to TT-E-D, generating poo million in sales in 2000. Category sales were growing 20% annually. Rob Price ROG - 8/24/00 Despite the fact that water was a basic commodity, the marketing and sale of water was complex. Water was segmented both by source guess what (imported spring, domestic spring, and purified) as well as by size MORE ON Glacial (single serve, multi-pack, and gallons). ARE we getting The sales leader in H-E-B's market in the bottled water category was FULL Credit Ozarka, a Texas spring water. The leading imported spring water was ( Through instore Evian, from France. Recently the purified drinking water niche was Material , advertising, Label growing dramatically, fueling demand for Coca Cola's Dasani and design etc ) FOR PepsiCo's Aquafina, among others. Purified water was chemically This Being PremiUM processed municipal water. Spring water From CANADA ? Glacia (see Figure A below) was launched in 2000 after three years - THANKS for your of research and product development. Glacia was positioned as Evian- quality water. The product was bottled at the source at a spring in Feversham, Canada. Importing this product from Canada made shipping substantially more expensive than for domestic spring water. While it was formulated against Evian, Glacia was shelved next to Ozarka, priced below Ozarka, and packaged in all the same key sizes as Ozarka. Table B provides a summary of Glacia's relative price positioning and the unit economics of the popular six-pack half-liter variety. Figure A Glacia Water PICK HED. Gracia CK HED, Gracia settled at he Scares Natural onWater Gracia Table B Economics of Six-pack Half-liters Brand Cost per Unit Price per Unit Gross Margin Percent Profit per Unit Ozarka $ 1.46 Glacia $ 1.86 21.59 $ 1.23 $ 1.79 $ .4 Evian 31.3% $ .56 $ 4.23 $ 5.49 Aquafina 23.0% $ 1.90 $ 2.39 $ 1.26 20.5% $ .49 Source: Company recordsH-E-B Own Brands 502053 Rob Price interpreted Charles 13qu note as a question regarding the positioning of Glacia with respect to others in the category The note reinforced the chairman's desire to advance the company' s reputation by linking the store name to premium products. Industry Background Grocery was one of the oldest and most competitive businesses in the United States. In 1999, approximately 31,500 supermarkets generated $365.4 billion in sales, of the 31,500 supermarkets, 64% were afliated with a chain and 36% operated independently. Approximately $292 billion (80%) of industry revenues were generated by chain supermarkets and $73.4 billion (20%) by independents. Among chain supermarkets, annual sales per store averaged $11.6 million in 1999, up from $113 million in 19981 The average chain supermarket had 28,310 square feet of selling space and averaged annual sales per square foot of about $4101 Overall, prot margins were extremely thin, with gross margins of 20%35% and operating margins of only 3%6% of sales. Esh'rmtes suggested that net income levels ranged from 0%3% of sales. Comparisons of samestores sales indicated only 1%3% growth for the industry from 1999 to 2000. HEB was long recognized as an innovative leader in the industry and achieved sales per store and sales per square foot performance significantly above national averages. Because of H-E-B's steadfast commiunent to consumer value, iis gross margns were consistent with its every day low price (EDIJ') strategy; however, because of its superb operation it was able to earn operating and net margins that were above industry averages. The 19905 saw supermarket chain consolidation. Kroger's acquisition of Fred Meyer for $13.5 billion and Albertson's $11.8 billion acquisition of American Stores created national scale for two of America's largest chains, but also created the challenge of harmonizing multiple brands, systems, and overlapping trade areasl Safeway was also an active buyer of strong regional operators. In 1999, for example, Safeway purchased Randalls Food Stores (with 127 stores in Houston, Austin, and Dallas) for $1.8 billion. Large European grocery players led international retail consolidation. Ahold, Tengelrmnn, Delhaize, and Aldi all had significant holdings in the United States.2 Two of the largest international players, Tesco and Carrefour, had yet to enter the US. market. The Europeans were recognized for their strong visual merchandising, sophisticated supply chain management, and successful private label programs. In fact, Switzerland, the United Kingdom, Germany, France, Belgium, and the Netherlands all had higher private label penetration than did the United States. The other significant development of the 1990s was Wal-Mart's move into food retailings"I In 1992, after several years of experimentation, Wal-Mart amalgamated its discount mass merchandise store format and a grocery store under one roof, creang its \"supercenter" format Supercenters averaged 100,000 to 200,000 square feet and contained not only the 36 general merchandise departments found in a baditional WalMart discount store, but also traditional grocery products such as frozen foods, bakery, fresh produce, meat and dairy. Most supercenters had separate entrances for the grocery and the general merchandise sections of the store but operated a single bank of checkout stands serving the entire operation. Wal-Mart supercenters were open 24 hours a day and employed upwards of 500 people. A high-performing store could generate more than $75 million in annual revenue. Customers were drawn to WalMart's supercenters not only by the one-stop shopping experience, but also by WalMart's reputation for low prices. Leveraging its vaunted merchandising strength and international buying power, Wal-Mart consistently claimed to offer the lowest prices in its trading area. By year end 2000, WalMart operated 888 supercenters in the United States and expected to conuibute 50% of sales and earnings growth from 2001-2005.4 (See Exhibit 1 for WalMart's income statement.) To support its supercenter expansion, WalMart invested heavily in distribution, opening four full-size dry groceries and two fresh produce distribution centers in the United States. Two of these centers were proximate to HEB markets. Wal-Mart's supercenter success inspired similar efforts by other large discount-store operators By 2001, Target had 30 supercenters and Kmart had 104 supercenters. In addition to its supercenter stores, Wal-Mart was testing the Neighborhood Market format in select cities (including Dallas and Houston). These 40,000-52,000 square-foot stores offered a narrowly focused grocery store, an in-store pharmacy with a drive-through, extensive health and beauty care items, and a narrow range of deli and bakery products. Neighborhood Markets held true to WalMart' s corporate reputation for low price. Wal-Mart used its national volume-purchasing power and supplychain leadership to negotiate ercely with its vendors. This strategy supported Wal-Mart's low prices. Since H-E-B had grown its business in an area characterized by low household incomes, the company was particularly sensitive about its price reputation H-EE recognized that it was in a business made up largely of commodities undifferentiated to the customer. In light of this reality and Wal-Mart's stand on prices, HEB paid special attention to maintaining its EDLI' reputation. Charles Butt remarked: When an Silo-pound gorilla comes into your backyard, you sit up and take notice. Wal- Mart is an excellent organization and a erce competitor. Sam Walton, whom I knew well, was a merchant genius and revolutionized retailing in this country. We recognize that to continue our successful growth, we must price very closely with WalMart. Given their purchasing power, this is a challenging assignment but early on we were realistic about them being the principal competitor in the retail food field for the foreseeable future. We are also keenly interested in those aspects of our business that allow us to differentiate ourselves. These include wide selection, outstanding baked goods, produce, owers, meats and seafood. Customer-focused service and our growing Own Brand assortment are also vital elements. Wal-Mart carried a smaller variety of both national brand and private-label products than did HEB. The \"grocery-side\" of a typical WalMart supercentet carried about 25K-35K SKUs, about 70%-75% of HE-B's assortment. A key distinction between the companies' assortment strategies lay in their different views of the importance of premium private-label products. Charles Butt sought to create innovative products under the H-E-B brand that were tailored to the tastes of South Texans. In conuast, Wal-Mart primarily offered private label products that were less expensive alternatives to existing brands. Bob Anderson, Wal-Mart's vice president of Private Label, indicated his company's skepticism about premium privateLlabel products in a trade magazine interview. He said, \"I'm a little concerned about all these premium [private label] programs. I think you risk diluting the customer's impression of your [own] brands. If you have 500 or 800 premium items, how can everything truly be premium?\"5 Wal-Mart's Own Brand privatelabel products were concentrated mostly in its Great Value Brand. The company's limited assortment of higher-quality items was under the Sam's Choice Brand. Wal- Mart also offered exclusive brands such as White Cloud toilet tissue, Parent's Choice diapers, and No Boundaries cosmetics that were not explicitly identied as privatelabel goods, The pasta sauce category offered an example of the companies' different private label strategies. WalMart offered five national brands and the Great Value line. A typical H-E-B store offered the same national brands, along with seven specialty brands. In addition, the store carried HE-B Brand products to compete against premium players like Classico and Five Brothers, and Hill Country Fare was merchandised next to economy brands like Ragu and Prego, H. E. Butt Grocery Company The H. E. Butt Grocery Company, headquartered in San Antonio, Texas, was the 11'\" largest grocery chain in the United States (Exhibit 2 summarizes the top 20 grocery chains in the United States). Florence Butt founded the company in Kerrville, Texas, in 1905 with a $60 investment. Fifteen years later, the Butt's youngest son Howard took over the family business. After four failures, Butt opened a successful second store in the border town of Del Rio, Texas, in 1927. Howard 13qu motto was "He prots most who serves best,\" and he passed on that belief to his youngest son Charles, who became president of the company in 1971. In 2001, as sales approached $9 billion and the chain surpassed 275 stores, HE-B remained privately held by the Butt family, and Charles Butt stayed actively involved in corporate strategy Charles Butt took a strong, public role as a cheerleader for the company's employees (called \"partners") and as ambassador to the communities served by H-E-B. The company routinely donated more than 5% of its pretax income to charity, with particular focus on education and hunger relief. Charles Butt was committed to maintaining HEB's entrepreneurial spirit without detracting from the focus on the detail needed to succeed in the grocery business. He noted, \"Grocery retailing needs to focus on the pennies, leveraging that small margin over a large volume of fresh and exciting offerings." He felt strongly that the key to success was to imbue each H-E-B store manager with that philosophy, \"The store manager is the key person who can blend service and attention to detail, a leader for the oor people, whose values become the store's values. If the store leadership does its job, then every partner conm'butes to giving every customer an experience that integrates outstanding customer service and great prices. \" Despite HE-B's regional concenualion, it was regarded as a world-class competitor, At Charles Butt' 5 urging, company leaders traveled worldwide seeking new ideas and best practices, Executives explored multiple segments of retail in locations as diverse as London, Milan, Warsaw, Seoul, and Bangkok. These visits led to new products, formats, and supply chain strategies, The team also sought new ideas to make the company a more exciting and fullling place for partners This search for new ideas complemented H-FrB's reliance on a stable leadership team steeped in H-E-B's legacy of service and value. Long tenures were common in senior management. Company employees' badges prominently indicated years of service, Fully Clingman served as H-E-B's president and COO for the last seven years of his 2&year career at H-E-B. Reporting to Clingman were the Central Market, Mexico, and US. Retail Divisions as well as Human Resources and Information Systems. The president of the Us. Retail Division, Harvey Mabry, lhad authority over Store Operations, Markeh'ng, Distribution, Manufacturing, and Own Brand. Marketing at H-E-B included Procurement, Advertising, and Pricing. Mabry had been with H-E-B for 40 years. HE-B Strategy H-EB's \"Bold Promise\" is shown in Exhibit 3. This document was visible in conference rooms and on screen savers throughout the company. It expressed the company's w'sion of \"partners taking a stand together to build the greatest retailing company.\" This vision was supported by the pillars of providing an exceptional shopping experience, great employees, nancial strength, and community impact. A senior leader at H-E-B characterized the company' s strategy as "refusing to choose between low cost and differentiation.\" HE-B jealously protected its EDLP reputation. Each week, senior leaders reviewed HEB's prices against those of its competitors. In addition, monthly tracking studies were conducted to evaluate customer perceptions of H-EB's prices. At the same time, Charles Butt insisted that his team not sacrice service, variety, and freshness. Rob Price commented, \"Delivering a combination of exceptional shopping experiences and low prices has resulted in extraordinary sales growth and store productivity. This provides cash ow, which funds additional investment in the customer experience and lower prices. This 'virtuous cycle' only breaks down when we lose our reputation for price or quality.\" Cost containment initiatives included H-EB's commitment to internal manufacturing. H-E-B's meat processing plant prepared 50 million pounds of meat per year. Two dairy plants shipped 110 million gallons of milk annually and produced the HEB brand yogurt, cottage cheese, and sour cream. Other manufacturing operations produced ice cream, bread, tortillas, snack foods, and cakes and pastries. About 30% of Own Brand sales were in self-manufactured goods. HEB had high hurdle rates for its investment decisions, expecting a rate of return in excess of 18% for new plant construction and 10%15% return for capital improvements within existing facilities Despite these high targets, the market potential had proven itself. H-E-B estimated that it had invested well over $100 million in its internal manufacturing capabilities. Concurrently, H-E-B had implemented innovations to improve the customer experience. The company had rolled out automated replenishment in some categories, which provided better in-stock conditions and freed up shelf space for additional variety. Some stores were tted with self-checkout technology, which increased throughput at the front end. Convenience services like drivethrough pharmacies and on-premise gas stations were commonplace. Stores H-E-B operated 271 stores in Texas, 16 stores in Mexico, and 1 store in Louisiana (Exhibit 4 provides an outline of the HEB's geographic coverage). The areas served in Texas included Houston, San Antonio, Austin, the Rio Grande Valley, the Gulf Coast and Midland / Odessa. In south and central Texas, HE-B had a market share in excess of 60%. HE-B continued to expand with the population in Texas, the second-fastest growing state in the United States. HEB's expansion strategy was to maximize share in contiguous markets that could be served by the company's existing distribution system. This approach made Dallas, Houston, and Northern Mexico particularly important sources of growth. Company research indicated that 90% of the households within its core market area visited an HEB store at least monthly HE-B had three different formats in the United States: traditional supermarkets (182 stores and 77% of sales), Pantry stores (86 stores and 16% of sales), Central Markets (4 stores and 2% of sales), H-E-B's Mexico stores (16 stores and 5% of sales) were similar to its US, supermarkets, with a larger space commitment to general merchandise and perishables, Exhibit 5 summarizes store counts for HE-B and its competitors in key markets. H-E-B Supermarkets: The average HEB store was 55,000 square feet with approximately 50,000 SKUs. New H-E-B stores were about 45,000 square feet in smaller markets and 80,00090,000 square feet in larger markets. Typically, smaller market stores had 10-15 check-out lanes and employed about 200 people. HEB's larger stores typically provided more tlmn 400 parking spaces, operated a minimum of 20 check-out lanes and employed in excess of 350 people. Development costs for new stores were $8 million-$15 million (including land, building, equipment and inventory) and were projected to achieve sales volumes of $600 to $750 per annum per square foot of selling space. The H-E-B supermarket format was similar to that found throughout the United States, with produce, meat, dairy, deli and bakery products on the outer perimeter anking aisles of shelf stable, frozen foods and health and beauty, Most HEB stores offered onehour photo finishing, large beer and wine departments, oral departments, coffee shops, bakeries, and pharmacies, Information regarding key store categories is summarized in Table C below. Table C H-E-B Sales Composition (Excluding Mexico and Central Market) Department % of Sales if of SKUs % of Store Space Grocery 46% 22,000 40 Meat and Seafood 16% 2,500 12 Health and Beauty] 15% 35,000 22 General Merchandise Pharmacy 9% 3,250 2 Produce 7% 1 ,000 12 Gasoline 3% 3 Pad site on property Deli 2% 2,000 6 Bakery 2% 1,000 6 Source: Company records H-EB supermarkets averaged approximately $35 million to $50 million in sales per year. (Exhibit 6 provides additional information regarding the major categories within the store.) HE-B was able to achieve such high performance by tailoring its assortment to its local markets and by a powerful combination of everyday low prices and exciting special events. One such innovation was the Meal Deal that ran every other week The Meal Deal offered a central item surrounded by complementary products that together made an easy meal For example, one Meal Deal featured HEB Brand King Ranch-style frozen chicken entre'e at $549, a free pack of H-E-B Brand soda, a free Mrs Smith cobbler, and a free package of Pillsbury frozen biscuits.6 H-E-B generally used one of its leading Own Brand products as the focal item and obtained complementary product at reduced cost from the national brands. - antry no s: - - so operate antry tores wr a ow cost, ow price rrnat. e smaller Pantry Stores were 25,000-30,000 square feet and averaged $14 million in sales per year. The small stores were originally developed in 1988 to facilitate a quick entry into the Houston market. However, in the late 1990s, the small formats were limiting HE-B's ability to offer the full assortment sought by customers. H-E-B planned to transition many Pantry stores to full-sized H-E-B supermarkets as large as 87,000 square feet. H-E-B Central Market: HEB operated two Central Market stores in Austin and one in San Antonio. Central Market stores were 60,000 square foot stores with a focus on premian products. The store created lavish displays of premium quality merchandise Customers entered the store through elaborate produce departments, with more than 600 items abundantly displayed. Rather than pre-cutting and packaging meat in plastic wrap, the meat and sh departments merchandised their products behind glass showcases reminiscent of traditional butcher shops. Central Markets stores also featured extensive \"ready-to-eat" and "ready-toheat\" products. Targeting food enthusiasts, the stores had a very large wine and beer selection, selfservice pasta and olive bars, international cheeses and full aisles of vinegar, oils, and salsas. While a typical H-E-B supermarket drew from a one-to-fivemile radius, each Central Market was a destination shopping experience targeted to draw shoppers within a 50-mile radius. Central Market proved effective in transforming HE-B's reputation in key bade areas. As one executive noted, "In Austin, HE-B was known more for price than freshness. When Central Market came in 1994, it elevated HEB's reputation in that upscale community." H-E-B Mexico: H-E-B began operations in Mexico in 1997, with most of its stores located in the Monterrey area. Monterrey was the third-largest metropolitan area in Mexico, with a population of 3.5 million. HEB's reputation in northern Mexico for low prices, excellent variety (particularly in product imported from the United States and in Own Brands), and fresh perishables led to very successful stores. H-EB believed that Mexico was one of its highest growth opportunities. It had created a full management infrastructure for the region and planned on opening an additional 812 stores in the next two to three years. HEB's Own Brands Early in the 19905, HEB signaled a new commitment to its private label with the assignment of Stephen Butt as the company's rst dedicated Own Brand vice president. At that time, the company had 28 different private labels on the shelf. Senior management commissioned a review of internal capabilities and a worldwide benchmarking effort. HEB participated in an extensive executive exchange program with U.K.-based Sainsbury, a highly regarded grocery retailer with a particularly strong own brand reputation. H-EB emulated many aspects of Sainsbury's Own Brand strategy. HEB established teams dedicated to brand management, quality assurance, consumer research, and package design. These functions collaborated on product development with a new process that incorporated best practices from consumer package goods companies. The Own Brand team consolidated the existing labels into three brands that would be more clearly positioned versus the national brands. Figure D provides a representation of the positioning proposed in the early 19905. The H-E>B Brand offered products that equaled or exceeded national brand quality. Where possible, HE-B Brand products would provide customers with a "point of difference.\" The next tier of products was Hill Country Fare. This tier served to compete against other store brands and approach national brand quality. Targeted toward the priceconscious shopper, the quality of Hill Country Fare products was intended to be \"good\" but not \"cheap." The third tier, generics, were products of reasonable quality with some acceptable quality variation. These would be the lowestvprice products available in the market. Own Brand products were typically priced 10%30% below competing brands, while still allowing HE-B to make positive gross profit, Figure D - Own Bland Positioning HEB Brand National Brand Quality Hill Country Fare Relative Price Source: Company records In 2001, HEB's Own Brands grew to $14 billion in sales The total gross margin of $450 million earned by Own Brand represented a disproportionately high percentage of H-E-B's total protability. Table B shows a comparison of overall and Own Brand protability for selected categories, Own Brand's share of sales (excluding gasoline and pharmacy) was 19%, putting HE-B in the top tier of private label performers in the industry. As a comparison, Safeway and Kroger reported 22%25% share from their private label products. At HE-B, most categories had Own Brand products, but the share of sales these products achieved varied widely In cold cereals, the share was 13% In contrast, Own Brand milk enjoyed a 90% share. Table E 1999 Profitability Analysis for Selected Categories (based on fully burdened costs)a Category Fully Burdened Category Profit Own Brand Prot Percentage Flour/Meal -1 % Syrup 1 6% Baby formula 1 0% Soft drinks -2% Frozen meals 18% Tortillas 24% Milk products 19% Pasta sauce 7% Canned vegetables 8% Frozen vegetables 11% Ice cream 12% Water -5% Sports drinks 3% Baking mixes -6% 'Fully burdened costs reected an estimate of all costs associated with the product including the base product cost and other associated costs such as stocking shelves, inventory carrying costs, etc. Source: Company records H-E-B had three major objectives for its Own Brand product lines: improved profitability, sales growth, and deeper customer relationships. Own Brand products typically provided better margin than national brand altemah'ves. This was because branded manufacturers' investments in advertising and trade promotion boosted the cost of their products to HEB, reducing their retail protability. Own Brand products did not require the same level of investment since HE-B's overall marketing activities created awareness and demand for Own Brand products. An additional cost advantage came from H-E-B's captive manufacturing of highly protable products, Internal manufacture allowed H-E-B to capture both retail and wholesale protability. Finally, successful Own Brand products inuenced some branded manufacturers to provide additional funding and reductions in cost to remain competitive on the shelf. H-EB sought to generate sales gains by using Own Brand products to increase the frequency of customers' shopping trips and the size of the basket per trip Purchase frequency was primarily driven by demand for core commodities like milk, bread, and eggs. These categories were dominated by Own Brand. Ensuring their quality and value inuenced customers' selection of H-E-B as their store of choice. HEB's unique Own Brand products further inuenced customer patronage. Once in the store, customers were exposed to attractively packaged and abundantly merchandized Own Brand expandable consumption categories like chips and cookies as well as products such as ice cream and fully cooked meats particularly formulated for the Southwestern palate The price and quality of these products contributed to enlarging customers' total shopping basket. Additionally, to further generate sales, Own Brands selectively promoted and advertised key products, spending approxirmately $10 million annually on Own Brand advertising and promotion Charles Butt felt the most important objective of the Own Brands product line was to deepen customer relationships. Low prices on Own Brand products reinforced the company's image as the leader for great value. Own Brand's food safety standards enhanced H-E-B's quality reputation. More qualitatively, H-E-B employees took pride in the innovative Own Brand products. This pride was reected in their interactions with customers. Own Brands: A Mixed Bag The Own Brand strategy conceived in the early 19905 was in need of a review in 2000' A 1999 customer study indicated that customers perceived H-EB's Own Brand products as generally lower quality than national brands. Consumers also saw no distinction between the H-EB and Hill Country Fare brands. Product research revealed that in some categories, including diapers and feminine hygiene, the HEB brand products did not meet national brand performance. This violated the original standards set for the tier. To help get a handle on the dynamics in the Own Brand segment, Rob Price delved deeply into a number of product categories An overview of select categories is outlined in Table F and the descriptions below. Exhibit 7 shows some of the products on the shelf as they appear to the customer. Ice Cream: H-E-B Creamy Creations Ice Cream had a 40% share of the Premium Ice Cream category three years after launch Creamy Creations was priced 25% less than the market's leading brand, Blue Bell. Research found that Creamy Creations equaled or exceeded Blue Bell's taste scores. Occasionally l-I-E-B offered limited edition avors that featured ingredients such as locally grown strawberries. Creamy Creations was supported by television and radio advertising as well as H-E-B Own Brand! extensive displayi HE-B also carried Hill Country Fare ice cream, which was comparable to other retailers' private label ice creams Fully Cooked Meats: Fueled by the creativity of the meat procurement team, HEB had commercialized local favorites like chicken fried steak, fajitas, and brisket in ready-to-heat forum The products were rigorously tested to meet restaurant qlmlityi In addition, they were formulated to reduce preparation time to the bare minimum In the case of H-E-B Fully Cooked Brisket, the customer saved over 10 hours of marinating and cooking time, Extensive sampling and advertising supported the Fully Cooked products. Fully Cooked meats were rarely discounted, since competitors did not offer comparable products. Pasta Sauce: The Hill County Fare brand was positioned against national entry brands such as Ragu and Prego, while the H-EB brand competed against more premium sauoes such as Classico and Five Brothers. Flour: HE-B stocked both HE-B Brand and Hill County Fare flour in addition to multiple national brands. Both Own Brand products were "hard winter wheat.\" H-E-B Brand flour was distinguished from Hill County Fare by a higher "ash content\" which was an advantage when baking cakes. Rob Price was not certain if customers were aware of the difference or considered such factors in selecting between our altemativesi Canned Vegetables: HE-B offered both the HE-B brand and Hill County Fare canned vegetables. HEB stores carried 276 SKUs in 27 types of vegetables, creating 1,500 individual facings for the product. The HE-B brand technical specification was \"extra fancy\" while Hill Country Fare was \"fancyi\" Rob Price noted that in addition to variability within these different specications, when a bumper GOP of \"extra fancy" aeated oversupply, the excess would be canned as Hill County Fare. Frozen Vegetables: Hill County Fare frozen vegetables were solid performers The Own Brand offering contained basic varieties, with quality that was equal to existing alternatives. The price was signicantly lower than Green Giant and Birdseye Hill Country Fare frozen vegetables were held as the lowest price in the category. The H-E-B Brand was not offered in the frozen vegetable category. Table F Sampling of Own Brand in Selected Product Categories Ice Cream H-E-B Hill Country Fare Leading Brands Blue Bell, Dreyers Price $3.97 $2.69 $4.69 Sales (thousands) VANILLA 199 $4,606 $3,897 $22,214 CREAMY ICE CREAM 1999 $15, 155 $4,805 $21,874 2000 $18,272 $5,037 $22,551 Gross Margin 25% 37% 21% Beef Brisket H-E-B Hill Country Fare Leading Brand FULLY COOKED FULLY COOKED (Fully Cooked) (Raw) Price $2.99 -$4.99 / lb. NA 5.98 - $2.79 / lb. Sales (thousands) 1998 $4,809 NA $10,258 199 $8,51 NA $10,351 2000 $7,804 NA $10,599 Gross Margin 21% NA -10% Pasta Sauce H-E-B Hill Country Fare Leading Brands Ragu, Classico Price $1.79 $.99 $1.28 - $2.38 Sales (thousands) 1998 $649 $465 $8, 102 199 $708 $481 $8,204 TOMATO & BASIL 2000 $656 $580 $8,333 Gross Margin 18% 6% 17% Flour H-E-B Hill Country Fare Leading Brands Gold Medal, Pillsbury Price $.99 $.87 $.98 - $1.17 TABE FLOUR Sales (thousands) FLOUR 1998 $609 $864 $2,201 199 $657 $847 $2,020 2000 $661 $840 $1,743 Gross Margin 18% 21% 7% Canned Vegetables H-E-B Hill Country Fare Leading Brands Green Giant, Del Monte OLD & WHITE Price $.33 - $.40 $.50 -$.57 HILL COUNTRY $.44 - $.50 FARE Sales (thousands) 199 $649 $9,850 $3,663 CORN 199 $547 $10,519 $3,543 2000 $423 $10,719 $2,701 Gross Margin 18% 13% 14% Frozen Vegetables H-E-B Hill Country Fare Leading Brands Birdseye, Green Giant Price NA $.78 - $.98 $.98 - $1.19 GRADE A, FANCY ales (thousands 1998 NA $2,277 $1,512 CUT NA $2,305 $1,427 GREEN BEANS 199 2000 NA $2,454 $1,411 Gross Margin NA 35% 24% Source: Company recordsAs Rob Price began to review the Own Brand strategy, he became more aware of how decisions in many parts of the organization inuenced the success of HE-B Own Brands. The product quality, packaging, pricing, placement, and promotion provided cues to shoppers about what the H-E-B and Hill Country Fare brands represented. Frequently these elements were managed harmoniously, leading to strong performance for a given product. At times, however, competitive pressure and differences in incentives made ahgrment difficult. One area central to the success of Own Brand was Procurement, the department responsible for sourcing all products for HEB's stores. Procurement was charged with achieving the lowest cost of goods for the right assortment of items. In addition, this group was accountable for securing vendor funds (called procurement revenue) from national brands. Vendors paid procurement revenue for ad space in circulars and displays in stores. On an annual basis the procurement group sold 80% of the end-caps (end-ofaisle displays) to its vendors, where a shong product could double its unit volume during the promotional period. The store managers retained the remaining 20% of the display ends for their local merchandising With extremely thin operating margins, procurement income was an important revenue source, not just for H-E-B, but also for other grocery store chains. Industry-wide it was estimated to range from 5 40% of sales in packaged goods. The Procurement Group's Business Development Managers (BDM) directed negotiations, ordering, advertising, displays, and events. While the meat and produce departments managed their own pricing, grocery and drug BDMs relied on an independent pricing department BDMs were compensated on salary plus bonus based equally on category sales, gross margin, and procurement revenue. In their negotiations, BDMs were constantly balancing variables such as order quantities, shelf space, and promotional dollars to achieve the highest bonusable results. For example, if a national brand wanted to promote a particular product, the BDM might negotiate additional shelf space, special pricing, and a payment from the national brand for promotional activities in exchange for guaranteed volumes. Duncan McNaughton, VP of Grocery Procurement, commented on the complexity of growing Own Brands in this context: There is a constant challenge in balancing Own Brands and national brands in the store, Own Brands are critical to our nancial health and differentiation. However, if Own Brands dominate, we may lose the interest of the national brands. The economics of Own Brands are complex. Own Brands generate good margins but they do not have procurement revenue associated with them, which is a consideration for the Business Development Manager as he or she manages total category protability. In addition, Own Brand products are handled exclusively through our own distribution channels Many competing national brands have direct store delivery and labor at the store, In these categories, which include chips, ice cream and soft drinks, gross margin does not tell the whole story. For example, FritoLay orders the goods, stocks the shelves, and takes back unsaleable product. With Own Brands, HE-B has to handle all of those tasks, which eats into the protability. Another area that impacted Own Brands was pricing. Unique for the grocery industry, an independent seven-person team was responsible for grocery and drugstore pricing at HE-B. HE-B believed that taking pricing out of the Business Development Manager's control led to BDMs having greater focus on reducing cost of goods and product merchandising. The pricing group's goal was to deliver on HE-B's promise of everyday low prices. As competition rose in HE-B's trade areas, the competitive pricing process became increasingly complex. Jim McTighe, director of Pricing, outlined the challenge for Own Brands; Consider a hypothetical case in canned vegetables. We sell Del Monte canned corn at 2 for a $1. Assume Green Giant offers a cost reduction that enables us to reduce their price temporarily to $.39. Green Giant is $.39, our H-E-B brand is $.35, and Hill Country Fare is $.33. What happens if a competitor like Wal-Mart prices Del Monte at 3 for a $1.00? Then H-E-B is in an awkward position. If we match the competitor's price on Del Monte, then Green Giant becomes the highest priced product on the shelf. This would be unfortunate, given their support of our low cost positioning. If we don't match the competitor's price on Del Monte, then we risk the perception that we have failed to honor our everyday low price stand. The Glacia Question Charles Butt's note about Glacia prompted Rob Price to commission customer research. The results suggested that Butt's intuition was correct. When prompted without packaging, only 19% of Glacia consumers were aware the product was bottled in Canada. Sixty-four percent believed it was from Texas. Even when prompted with packaging (which incorporated a red maple leaf and the phrases "Product of Canada" and "Natural Canadian Spring Water"), only 74% of customers recognized Canada as the source. Before taking any new action, the Own Brand team reviewed the original research upon which the launch of Glacia had been based. Original concept testing suggested that sourcing from Canada appealed greatly to users of imported drinking water. In fact, Evian users indicated preference for Canada over France, Evian's source. The water from Glacia's spring performed equally to Evian in blind taste tests. It appeared that heavy emphasis on Canada would make Glacia the water of choice for Evian users. Canada was much less appealing to a broader base of water drinkers. Only one in five bottled- water drinkers perceived any advantage from imported water. Ozarka users indicated that their preference for Texas water was 44% higher than for Canadian water. In blind taste tests, consumers rated Glacia at parity to Ozarka. Rob Price also sought Duncan McNaughton's input. McNaughton acknowledged Glacia's strong performance and its contributions to gross margin. (Table G outlines the role of Glacia in the category). McNaughton urged consideration of the procurement revenue derived from national brands, which did not show up as gross margin but nonetheless contributed to company earnings. Additionally, national brand promotions had an important role in driving overall store traffic. These events were often funded by special vendor allowances. A typical promotion of the Ozarka six-pack half-liter would be priced at 2 for $3. Table G Dollar Share of Single-Serve Bottled Water - Pre and Post Launch of H-E-B Glacia Brand Before Launch After Launch Domestic spring water 73% 52% (includes Ozarka) Imported spring water Glacia 22% Other (includes Evian) 12% 6% Purified drinking water 5% 20% Source: Company recordsH-EB Own Brands 502-053 Careful review of the research and the economics of the water category did not suggest a clear course of action One alternative was to target Glada against Evian more directly This would require moving the product closer to Evian on the shelf and increasing the price above that of Ozarka. The brand would not need to be changed, but the Canada message would need to be more clearly emphasized. This path would provide an opportunity to launch a Hill Country Fare product in a lower tier, It was not clear if the Hill Country Fare product should be spring water or puried water' Another alterrmtive would be to reposition Glacia as domestic spring water, Placement and pricing would remain intact. However, signicant time and expense would be spent on product development and package redesign. Scarce advertising resources would also be consumed re launching the new product The Own Brand team would need to determine if the H-E-B brand or the Hill Country Fare brand was the appropriate brand for this restaged product This approach also left open the question of how to approach the puried water market Rob Price needed to make a specic recommendation on Glacia within the broader context of a powerful overall Own Brand strategy. The Own Brand team had frequently heard the following questions from Charles Butt and other senior company leaders: 0 How should Own Brands respond to competitive price promotions? When should HE-B follow? What about national brand promotions? 0 Specically, what is the role of H-E-B and Hill Country Fare as the two Own Brand labels? How should these be positioned with respect to the other brands in the category? 0 What is the role of Own Brand in H-E-B's overall corporate strategy? Why is it important? Should it be scaled up? Or dialed down? It so, in what products or in what product categories? Exhibit 1 Wal-Mart Income Statement and Selected Statistics ($ millions) 1997 1998 1999 2000 Net revenue 119,299 139,208 166,809 193,295 Cost of sales (FIFO) 93,438 108,725 129,664 150,255 Gross profit 25,861 30,483 37,145 43,040 SG&A expense 19,358 22,363 27,040 31,550 Operating income 6,503 8,120 10,105 11,490 Net income 3,526 4,430 5,575 6,295 Gross margin (FIFO) 20.79% 21.20% 21.36% 22.50% SG&A margin 16.41 16.25 16.39 16.50 Operating margin 5.51 5.90 6.13 6.00 Net margin 2.99 3.22 3.38 3.29 Traditional Wal-Mart stores 1,921 1,869 1,801 1,736 Supercenters New supercenters 97 123 157 167 Total # of supercenters 441 564 721 888 Avg. sq. foot/store (000s) 182 181 181 183 "Includes conversions or relocations of Wal-Mart discount stores to Wal-Mart superstores Source: Annual Report, Wal-Mart Stores, Inc.Exhibit 2 Top 20 Largest Supermarket Chains Company # of 2000 Sales Sq. Ft. # of FTE Major Trading Areas Store Formats Name Stores (millions) Selling Check Store (# of stores ($2M+ Area outs Employ sales) (000s) ees Kroger 2,366 43,120 100,653 26,581 220,925 cific (645) Conventional (2,224) East North Cent Supercenter (142) Intain (364) Albertson's 1,715 31,461 67,048 17,228 139,537 Pacific (612) Conventional (1,715) Mountain (295) West South Central (283) Safeway 1,482 28,829 51,854 14,025 111,103 Pacific (839) Conventional (1,482) Mountain (260) South Atlantic (129) Wal-Mart 908 22,947 54,735 25,309 237,786 West South Central (236) Supercenter (890) South Atlantic (236) Conventional (18) East South Central (151) Ahold USA 974 20,022 39,769 12,398 90,923 South Atlantic (422) Conventional (970) Mid Atlantic (255) Limited Selection (4) New England (202) Delhaize 1,435 15,042 39,346 12,044 67, 103 South Atlantic (1,216) Conventional (1,435) America East South Central (102) New England (82) Winn Dixie 1,081 13,731 40,714 11,490 87,136 South Atlantic (740) Conventional (1,081) East South Central (173) West South Central (150) Publix 645 13,021 25,382 7,213 65,926 South Atlantic (641) Conventional (645) East South Central (4) Great A&P Tea 553 8,075 16,492 6, 107 44,888 Mid-Atlantic (276) Conventional (552) East North Central (140) Limited Selection (1) South Atlantic (67) H-E-B 270 7,900 10,274 3,396 32,323 West South Central (270) Conventional (270) Supervalu 539 7,197 6,357 5,240 35,920 South Atlantic (177) Conventional (305) East North Central (133) Limited Selection (213) Mid-Atlantic (67) Supercenter (21) Shaw's 165 4,001 6,806 2,197 16,26 New England (165) Conventional (165) Pathmark 138 3,807 5,799 2.193 17,262 Mid-Atlantic (134) Conventional (138) South Atlantic (4) Defense 190 3,607 5,076 2,364 11,418 South Atlantic (56) Military (190) Commissary Pacific (42) Agency West South Central (22) Meijer 144 3,545 6,968 4,248 49, 171 East North Central (136) Supercenter (144) East South Central (8) Hy-Vee 184 3,383 7.503 2,493 26,545 West North Central (173) Conventional (184) East South Central (11) Fleming Cos. 200 3,120 7,427 2,029 14,308 Mountain (66) Conventional (200) West North Central (59) Raley's 149 2,982 3.360 1,674 11,626 Pacific (110) Conventional (149) Supermarkets Mountain (39) Giant Eagle 120 2,856 5,592 1,512 15,004 East North Central (75) Conventional (120) Mid-Atlantic (44) Aldi 697 2.522 6.696 2,952 12,254 East North Central (315) Limited Selection (697) West North Central (104) Pacific (102) Source: Supermarket Business, April 15, 2001, Company Records. Data based on Trade Dimensions database of 32,358 supermarkets selling a minimum of $2 million apiece per year. Stores under $2 million not included. For supercenters, Trade Dimensions estimated the square footage of items typically sold in the traditional supermarket format and the equivalent square footage and sales volume was entered into the calculations for the listing.Exhibit 5 H-E-B Markets - Market Share and Store Counts Market Company Market Share % Store Count San Antonio H-E-B 67 43 Albertson's 18 23 Handy Andy 20 Comm.Px/Bx 2 Wal-Mart 8 Conventional 3 Supercenters Super Kmart A - 3 Other 17 Austin H-E-B 36 Albertson's 15 Randall's 12 Sam's Club 2 Wal-Mart 4 Supercenters Whole Foods Fiesta Other Corpus Christi H-E-B 29 Wal-Mart 9 Conventional 5 Supercenters Albertson's Super Kmart Other 15 Waco H-E-B 6 Wal-Mart 1 Supercenter Winn Dixie Albertson's Brookshire Super Kmart Other w - Texas Border H-E-B 38 Wal-Mart 8 Conventional 8 Supercenters Albertson's Super Kmart 4 Other NNO NO ONGOONS VNU ON 6- - NNOWN 39 Houston Kroger 98 Randall's 46 H-E-B 84 Fiesta 35 Albertson's 45 Wal-Mart 25 Conventional 7 Supercenters Other 19 >100Exhibit 6 H-E-B Categories Category Representative Products Category Gross Own Brand Share of Total Margin Share of Own Brand Category Sales Sales (average=19%) Milk, Eggs, Ice Cream, Frozen Above average Above average 29% Grocery Perishables Vegetables Commercial Sandwich Bread, Tortillas, Bagels, Above average Above average 5% Bakery English Muffins Salty Snacks, Cookies, Crackers, Below average Below average 7% Expandable Consumption Soft Drinks Basic Ingredients Baking, Canned Goods, Coffee, Below average Above average 8% Cooking Oil Soup, Water, Cereal, Pickles, Pasta Below average Below average 8% Shelf Stable Commodities Sauce Below average Above average 8% Household Items Detergent, Cleansers, Bar Soap Home, Hardware Batteries, candy, charcoal, school Above average Below average 2% & Garden supplies, lawn and garden 2% Deli Hot foods, heat and eat, luncheon Above average Below average meats Drug, Health & Diapers, first aid, cosmetics, eye Above average Below average 6% Beauty and dental care, vitamins Above average Above average 25% Meat & Seafood Lunch meats, bacon, meats, fresh and frozen seafood, fully cooked meats, poultry, processed cheese Source: Adapted from company records
