 Read the question carefully pls!!
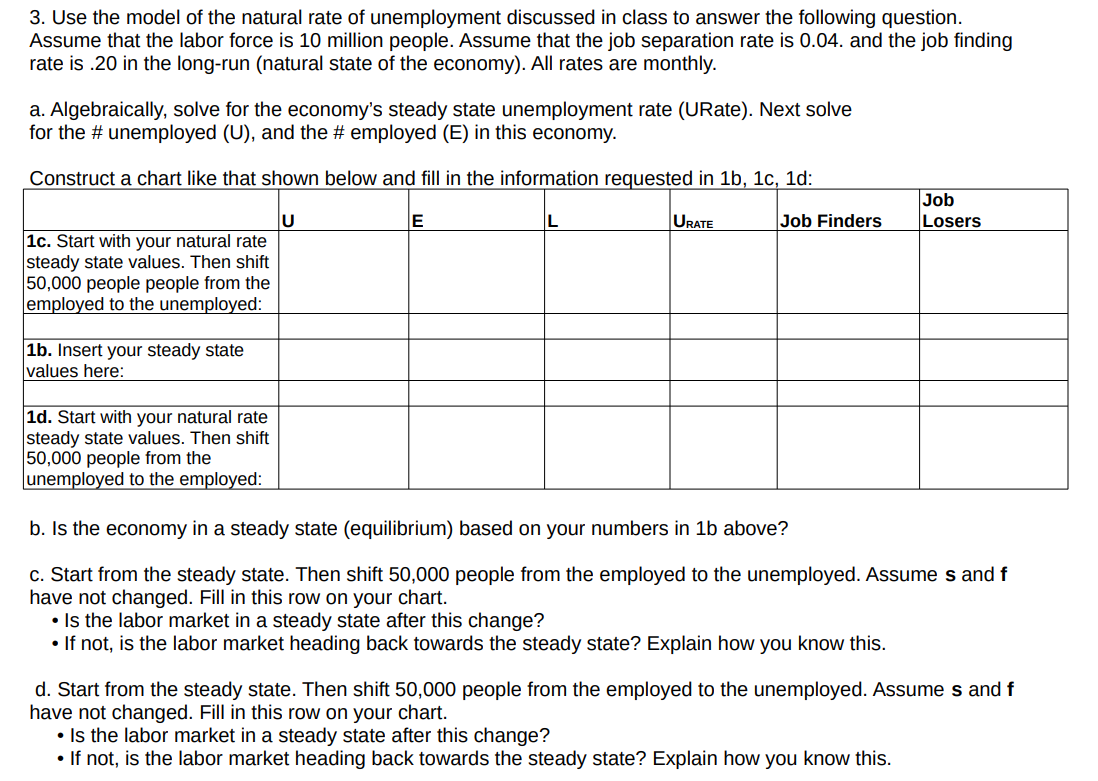
3. Use the model of the natural rate of unemployment discussed in class to answer the following question. Assume that the labor force is 10 million people. Assume that the job separation rate is 0.04. and the job finding rate is .20 in the long-run (natural state of the economy). All rates are monthly. a. Algebraically, solve for the economy's steady state unemployment rate (URate). Next solve for the \# unemployed (U), and the \# employed (E) in this economy. Construct a chart like that shown below and fill in the information reauested in 1b. 1c. 1d: b. Is the economy in a steady state (equilibrium) based on your numbers in 1b above? c. Start from the steady state. Then shift 50,000 people from the employed to the unemployed. Assume s and f have not changed. Fill in this row on your chart. - Is the labor market in a steady state after this change? - If not, is the labor market heading back towards the steady state? Explain how you know this. d. Start from the steady state. Then shift 50,000 people from the employed to the unemployed. Assume s and f have not changed. Fill in this row on your chart. - Is the labor market in a steady state after this change? - If not, is the labor market heading back towards the steady state? Explain how you know this. 3. Use the model of the natural rate of unemployment discussed in class to answer the following question. Assume that the labor force is 10 million people. Assume that the job separation rate is 0.04. and the job finding rate is .20 in the long-run (natural state of the economy). All rates are monthly. a. Algebraically, solve for the economy's steady state unemployment rate (URate). Next solve for the \# unemployed (U), and the \# employed (E) in this economy. Construct a chart like that shown below and fill in the information reauested in 1b. 1c. 1d: b. Is the economy in a steady state (equilibrium) based on your numbers in 1b above? c. Start from the steady state. Then shift 50,000 people from the employed to the unemployed. Assume s and f have not changed. Fill in this row on your chart. - Is the labor market in a steady state after this change? - If not, is the labor market heading back towards the steady state? Explain how you know this. d. Start from the steady state. Then shift 50,000 people from the employed to the unemployed. Assume s and f have not changed. Fill in this row on your chart. - Is the labor market in a steady state after this change? - If not, is the labor market heading back towards the steady state? Explain how you know this
 Read the question carefully pls!!


