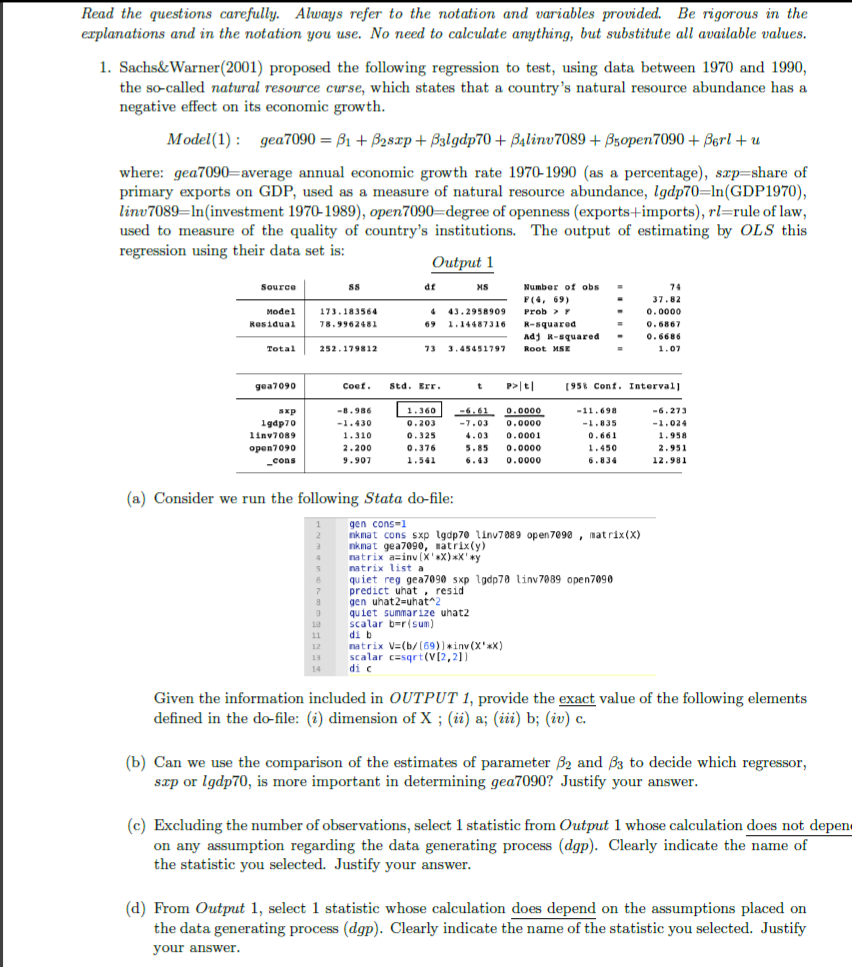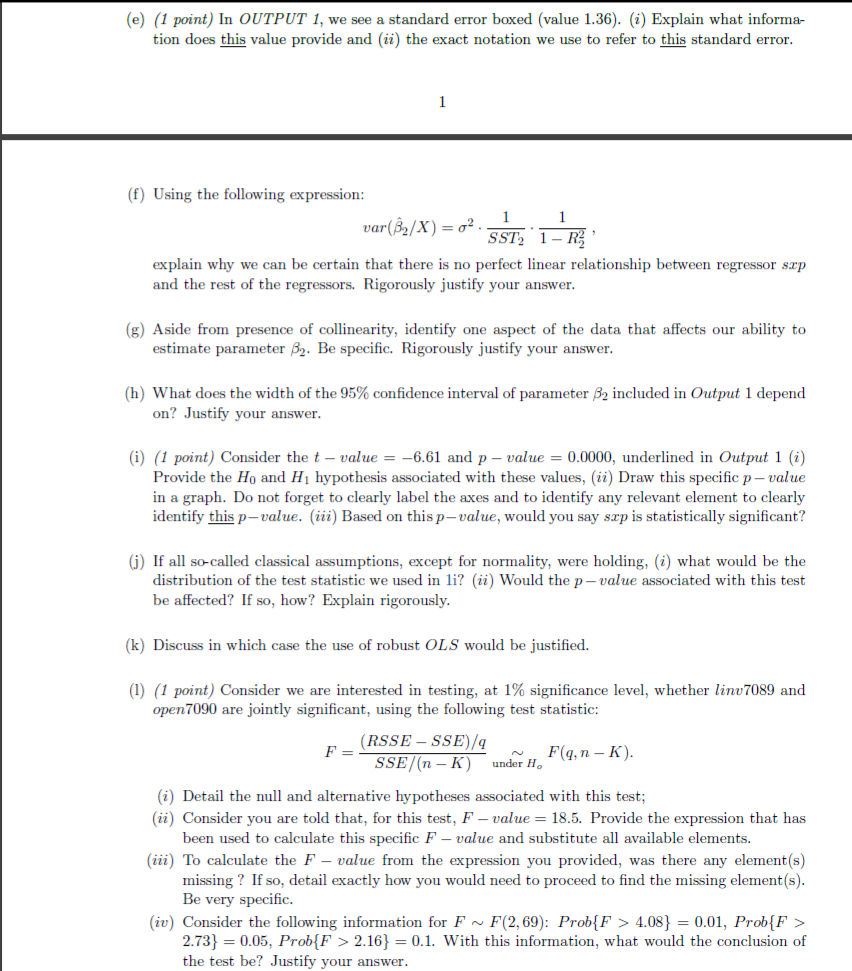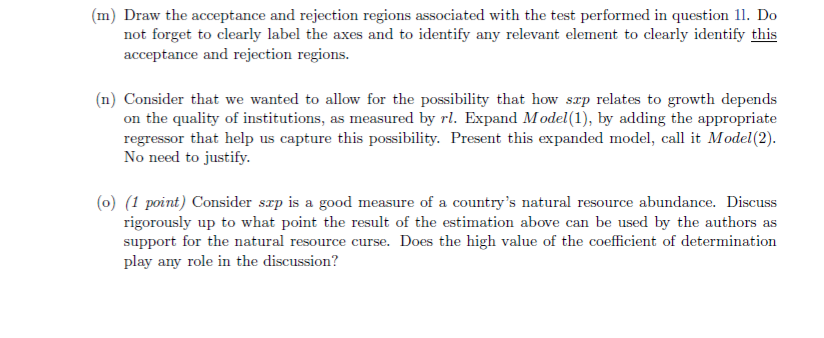


Read the questions carefully. Always refer to the notation and variables provided. Be rigorous in the explanations and in the notation you use. No need to calculate anything, but substitute all available values. 1. Sachs&Warner (2001) proposed the following regression to test, using data between 1970 and 1990, the so-called natural resource curse, which states that a country's natural resource abundance has a negative effect on its economic growth. Model(1): gea7090 = B1 + B28:0p + Bulgdp70+ Balinu 7089 + Bsopen 7090+ Berl + u where: gea7090=average annual economic growth rate 1970-1990 (as a percentage), sep=share of primary exports on GDP, used as a measure of natural resource abundance, Igdp70=ln(GDP1970), linv 7089=ln(investment 1970-1989), open 7090=degree of openness (exports+imports), rl=rule of law, used to measure of the quality of country's institutions. The output of estimating by OLS this regression using their data set is: Output 1 Number of obs 173.183564 Residual Source SS de MS Model 4 43.2958909 1.14487316 74 37.82 0.0000 0.6867 0.6686 1.07 78.9962481 P(4, 69) Prob R-squared Ady R-squared Root MSE 69 Total 252.179812 73 3.45451797 gea7090 Coef. Std. Err. t p>It! [958 Cont. Intervall . sxp 1dp70 1inv7089 open7090 cons -8.986 -1.430 1.310 2.200 9.902 1 1.360 0.203 0.325 0.376 1.541 -7.03 4.03 5.85 6.43 0.0000 0.0000 0.0001 0.0000 0.0000 -11.698 -1.835 0.661 1.450 6.834 -6.273 -1.024 1.958 2.951 12.981 (a) Consider we run the following Stata do-file: gen cons=1 2 nkmat cons sxp Igdp 70 linv 7089 open 7090, natrix(X) 3 nkmat gea7090, atrix(y) . natrix asin (X)**'*y 5 natrix list a 5 quiet reg gea7090 sxp lgdp70 Linv 7089 open7090 7 predict uhat, resid 8 gen uhat 2-uhata2 9 quiet summarize uhat2 1a scalar bersum) 1 di b 12 natrix V=(b/(69)]*inv(X'*X) 13 scalar casqrt(V12,21) dic Given the information included in OUTPUT 1, provide the exact value of the following elements defined in the do-file: (i) dimension of X; (ii) a; (iii) b; (iv) c. (b) Can we use the comparison of the estimates of parameter B2 and 33 to decide which regressor, szp or lgdp70, is more important in determining gea7090? Justify your answer. (c) Excluding the number of observations, select 1 statistic from Output 1 whose calculation does not depen on any assumption regarding the data generating process (dgp). Clearly indicate the name of the statistic you selected. Justify your answer. (d) From Output 1, select 1 statistic whose calculation does depend on the assumptions placed on the data generating process (dgp). Clearly indicate the name of the statistic you selected. Justify your answer. (e) (1 point) In OUTPUT 1, we see a standard error boxed (value 1.36). (i) Explain what informa- tion does this value provide and (ii) the exact notation we use to refer to this standard error. 1 (f) Using the following expression: 1 1 var(82/X) = o? SST 1 - R$ explain why we can be certain that there is perfect linear relationship between regressor sp and the rest of the regressors. Rigorously justify your answer. (8) Aside from presence of collinearity, identify one aspect of the data that affects our ability to estimate parameter B2. Be specific. Rigorously justify your answer. (h) What does the width of the 95% confidence interval of parameter 32 included in Output 1 depend on? Justify your answer. (i) (1 point) Consider the t - value = -6.61 and p-value = 0.0000, underlined in Output 1 (i) Provide the Ho and H1 hypothesis associated with these values, (ii) Draw this specific p-value in a graph. Do not forget to clearly label the axes and to identify any relevant element to clearly identify this p-value. (ii) Based on this p-value, would you say szp is statistically significant? () If all so-called classical assumptions, except for normality, were holding, (i) what would be the distribution of the test statistic we used in li? (ii) Would the p-value associated with this test be affected? If so, how? Explain rigorously. (k) Discuss in which case the use of robust OLS would be justified. (1) (1 point) Consider we are interested in testing, at 1% significance level, whether linu 7089 and open 7090 are jointly significant, using the following test statistic: (RSSE - SSE)/4 F= F(q,n-K) SSE/(n-K) under H () Detail the null and alternative hypotheses associated with this test; (ii) Consider you are told that, for this test, F value = 18.5. Provide the expression that has been used to calculate this specific F - value and substitute all available elements. (iii) To calculate the F - value from the expression you provided, was there any element(s) missing? If so, detail exactly how you would need to proceed to find the missing element(s). Be very specific (iv) Consider the following information for F~ F(2,69): Prob{F > 4.08} = 0.01, Prob{F > 2.73} = 0.05, Prob{F > 2.16} = 0.1. With this information, what would the conclusion of the test be? Justify your answer. (m) Draw the acceptance and rejection regions associated with the test performed in question 11. Do not forget to clearly label the axes and to identify any relevant element to clearly identify this acceptance and rejection regions. (n) Consider that we wanted to allow for the possibility that how szp relates to growth depends on the quality of institutions, as measured by rl. Expand Model(1), by adding the appropriate regressor that help us capture this possibility. Present this expanded model, call it Model(2). No need to justify. (0) (1 point) Consider srp is a good measure of a country's natural resource abundance. Discuss rigorously up to what point the result of the estimation above can be used by the authors as support for the natural resource curse. Does the high value of the coefficient of determination play any role in the discussion? Read the questions carefully. Always refer to the notation and variables provided. Be rigorous in the explanations and in the notation you use. No need to calculate anything, but substitute all available values. 1. Sachs&Warner (2001) proposed the following regression to test, using data between 1970 and 1990, the so-called natural resource curse, which states that a country's natural resource abundance has a negative effect on its economic growth. Model(1): gea7090 = B1 + B28:0p + Bulgdp70+ Balinu 7089 + Bsopen 7090+ Berl + u where: gea7090=average annual economic growth rate 1970-1990 (as a percentage), sep=share of primary exports on GDP, used as a measure of natural resource abundance, Igdp70=ln(GDP1970), linv 7089=ln(investment 1970-1989), open 7090=degree of openness (exports+imports), rl=rule of law, used to measure of the quality of country's institutions. The output of estimating by OLS this regression using their data set is: Output 1 Number of obs 173.183564 Residual Source SS de MS Model 4 43.2958909 1.14487316 74 37.82 0.0000 0.6867 0.6686 1.07 78.9962481 P(4, 69) Prob R-squared Ady R-squared Root MSE 69 Total 252.179812 73 3.45451797 gea7090 Coef. Std. Err. t p>It! [958 Cont. Intervall . sxp 1dp70 1inv7089 open7090 cons -8.986 -1.430 1.310 2.200 9.902 1 1.360 0.203 0.325 0.376 1.541 -7.03 4.03 5.85 6.43 0.0000 0.0000 0.0001 0.0000 0.0000 -11.698 -1.835 0.661 1.450 6.834 -6.273 -1.024 1.958 2.951 12.981 (a) Consider we run the following Stata do-file: gen cons=1 2 nkmat cons sxp Igdp 70 linv 7089 open 7090, natrix(X) 3 nkmat gea7090, atrix(y) . natrix asin (X)**'*y 5 natrix list a 5 quiet reg gea7090 sxp lgdp70 Linv 7089 open7090 7 predict uhat, resid 8 gen uhat 2-uhata2 9 quiet summarize uhat2 1a scalar bersum) 1 di b 12 natrix V=(b/(69)]*inv(X'*X) 13 scalar casqrt(V12,21) dic Given the information included in OUTPUT 1, provide the exact value of the following elements defined in the do-file: (i) dimension of X; (ii) a; (iii) b; (iv) c. (b) Can we use the comparison of the estimates of parameter B2 and 33 to decide which regressor, szp or lgdp70, is more important in determining gea7090? Justify your answer. (c) Excluding the number of observations, select 1 statistic from Output 1 whose calculation does not depen on any assumption regarding the data generating process (dgp). Clearly indicate the name of the statistic you selected. Justify your answer. (d) From Output 1, select 1 statistic whose calculation does depend on the assumptions placed on the data generating process (dgp). Clearly indicate the name of the statistic you selected. Justify your answer. (e) (1 point) In OUTPUT 1, we see a standard error boxed (value 1.36). (i) Explain what informa- tion does this value provide and (ii) the exact notation we use to refer to this standard error. 1 (f) Using the following expression: 1 1 var(82/X) = o? SST 1 - R$ explain why we can be certain that there is perfect linear relationship between regressor sp and the rest of the regressors. Rigorously justify your answer. (8) Aside from presence of collinearity, identify one aspect of the data that affects our ability to estimate parameter B2. Be specific. Rigorously justify your answer. (h) What does the width of the 95% confidence interval of parameter 32 included in Output 1 depend on? Justify your answer. (i) (1 point) Consider the t - value = -6.61 and p-value = 0.0000, underlined in Output 1 (i) Provide the Ho and H1 hypothesis associated with these values, (ii) Draw this specific p-value in a graph. Do not forget to clearly label the axes and to identify any relevant element to clearly identify this p-value. (ii) Based on this p-value, would you say szp is statistically significant? () If all so-called classical assumptions, except for normality, were holding, (i) what would be the distribution of the test statistic we used in li? (ii) Would the p-value associated with this test be affected? If so, how? Explain rigorously. (k) Discuss in which case the use of robust OLS would be justified. (1) (1 point) Consider we are interested in testing, at 1% significance level, whether linu 7089 and open 7090 are jointly significant, using the following test statistic: (RSSE - SSE)/4 F= F(q,n-K) SSE/(n-K) under H () Detail the null and alternative hypotheses associated with this test; (ii) Consider you are told that, for this test, F value = 18.5. Provide the expression that has been used to calculate this specific F - value and substitute all available elements. (iii) To calculate the F - value from the expression you provided, was there any element(s) missing? If so, detail exactly how you would need to proceed to find the missing element(s). Be very specific (iv) Consider the following information for F~ F(2,69): Prob{F > 4.08} = 0.01, Prob{F > 2.73} = 0.05, Prob{F > 2.16} = 0.1. With this information, what would the conclusion of the test be? Justify your answer. (m) Draw the acceptance and rejection regions associated with the test performed in question 11. Do not forget to clearly label the axes and to identify any relevant element to clearly identify this acceptance and rejection regions. (n) Consider that we wanted to allow for the possibility that how szp relates to growth depends on the quality of institutions, as measured by rl. Expand Model(1), by adding the appropriate regressor that help us capture this possibility. Present this expanded model, call it Model(2). No need to justify. (0) (1 point) Consider srp is a good measure of a country's natural resource abundance. Discuss rigorously up to what point the result of the estimation above can be used by the authors as support for the natural resource curse. Does the high value of the coefficient of determination play any role in the discussion


