

Question
Read YETI in 2022: Will Its Strategy Lead to Sustainable Advantage and Growth? (Case 4 in Textbook and eBook) Complete the YETI Holdings Spreadsheet with
Read YETI in 2022: Will Its Strategy Lead to Sustainable Advantage and Growth? (Case 4 in Textbook and eBook) Complete the YETI Holdings Spreadsheet with your calculations of the indicated (green boxes) financial ratios. Calculate your financial ratios forthe spreadsheet from the PDF files of the companys Income Statements and Balance Sheets for 2018-2022 attached to this unit on Blackboard (Mergent Online Financial Statements). NOTE: Use the Commonly Used Financial Ratios PDF file formulas for the financial ratio calculations. TIP: Use n=4 in your CAGR calculation.
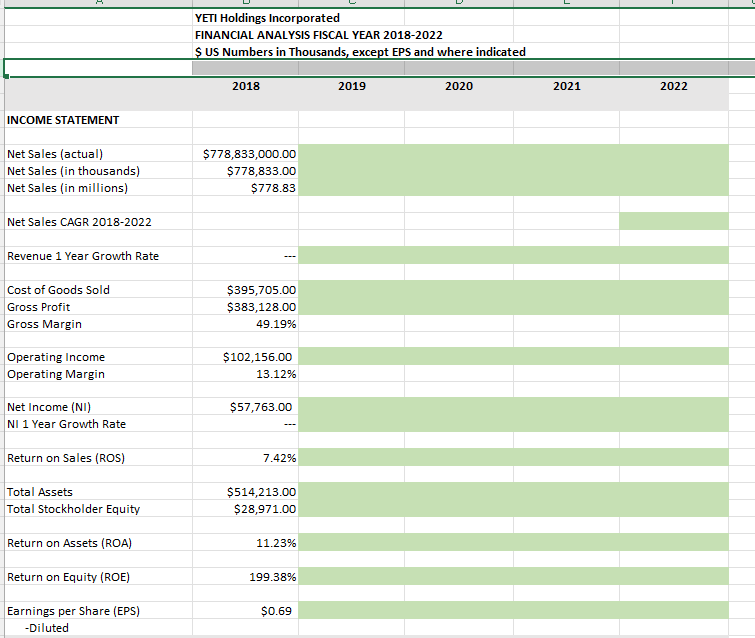
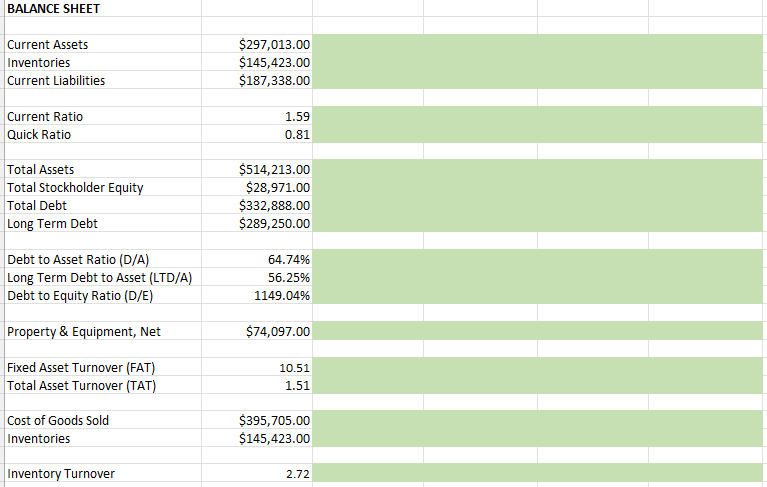 \begin{tabular}{|c|c|c|c|c|c|} \hline & \multicolumn{3}{|c|}{ YETI Holdings Incorporated } & & \\ \hline & \multicolumn{4}{|c|}{ FINANCIAL ANALYSIS FISCAL YEAR 2018-2022 } & \\ \hline & \multicolumn{4}{|c|}{ S US Numbers in Thousands, except EPS and where indicated } & \\ \hline & \multirow[b]{2}{*}{2018} & \multirow{3}{*}{2019} & \multirow{3}{*}{2020} & \multirow{3}{*}{2021} & \multirow{3}{*}{2022} \\ \hline & & & & & \\ \hline \multicolumn{2}{|l|}{ INCOME STATEMENT } & & & & \\ \hline Net Sales (actual) & \multicolumn{5}{|l|}{$778,833,000.00} \\ \hline Net Sales (in thousands) & \multicolumn{5}{|l|}{$778,833.00} \\ \hline Net Sales (in millions) & \multicolumn{5}{|l|}{$778.83} \\ \hline & & & & & \\ \hline \multicolumn{6}{|l|}{ Net Sales CAGR 2018-2022 } \\ \hline \multirow[t]{2}{*}{ Revenue 1 Year Growth Rate } & \multirow{2}{*}{\multicolumn{5}{|c|}{}} \\ \hline & & & & & \\ \hline Cost of Goods Sold & \multicolumn{5}{|l|}{$395,705.00} \\ \hline Gross Profit & \multicolumn{5}{|l|}{$383,128.00} \\ \hline Gross Margin & \multicolumn{5}{|l|}{49.19%} \\ \hline Operating Income & \multicolumn{5}{|l|}{$102,156.00} \\ \hline OperatngIncomeOperatingMargin & \multicolumn{5}{|l|}{13.12%} \\ \hline Net Income (NI) & \multicolumn{5}{|l|}{$57,763.00} \\ \hline NI 1 Year Growth Rate & \multicolumn{5}{|l|}{} \\ \hline \\ \hline Return on Sales (ROS) & \multicolumn{5}{|l|}{7.42%} \\ \hline \\ \hline Total Assets & \multicolumn{5}{|l|}{$514,213.00} \\ \hline Total Stockholder Equity & \multicolumn{5}{|l|}{$28,971.00} \\ \hline \\ \hline \multicolumn{6}{|l|}{ Return on Assets (ROA) } \\ \hline & & & & & \\ \hline \multicolumn{6}{|l|}{ Return on Equity (ROE) } \\ \hline & & & & & \\ \hline Earnings per Share (EPS) & $0.69 & & & & \\ \hline -Diluted & & & & & \\ \hline \end{tabular} BALANCE SHEET Current Assets Inventories Current Liabilities Current Ratio Quick Ratio Total Assets Total Stockholder Equity Total Debt Long Term Debt Debt to Asset Ratio (D/A) Long Term Debt to Asset (LTD/A) Debt to Equity Ratio (D/E) Property \& Equipment, Net Fixed Asset Turnover (FAT) Total Asset Turnover (TAT) Cost of Goods Sold Inventories Inventory Turnover $297,013.00$145,423.00$187,338.00 1.59 0.81 $514,213.00 $28,971.00 $332,888.00 $289,250.00 64.74% 56.25% 1149.04% $74,097.00 10.51 1.51 $395,705.00 $145,423.00 2.72
 Step by Step Solution
There are 3 Steps involved in it
Step: 1

Get Instant Access to Expert-Tailored Solutions
See step-by-step solutions with expert insights and AI powered tools for academic success
Step: 2

Step: 3
Ace Your Homework with AI
Get the answers you need in no time with our AI-driven, step-by-step assistance
Get Started
Cloud Security Auditing
Authors: Suryadipta Majumdar, Taous Madi, Yushun Wang, Azadeh Tabiban, Momen Oqaily, Amir Alimohammadifar, Yosr Jarraya, Makan Pourzandi, Lingyu Wang, Mourad Debbabi
1st Edition
3030231305, 978-3030231309