

Question
REALLY NEED HELP PLEASE hello..i would love some help with reading this chart. this class i am struggling with and the assignment is due tonight
REALLY NEED HELP PLEASE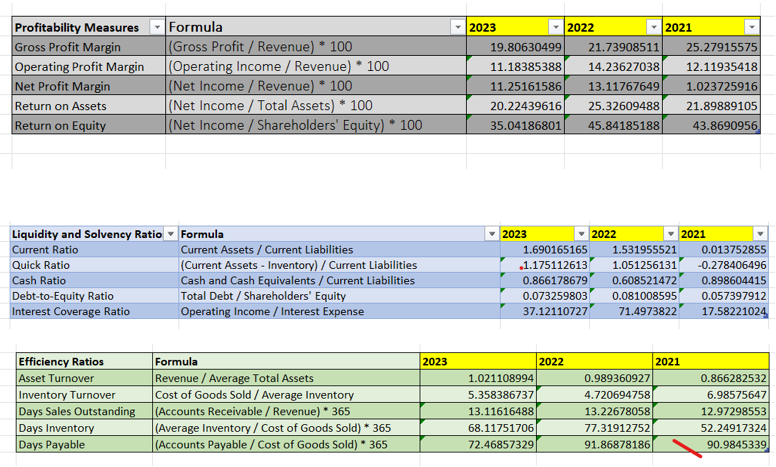 hello..i would love some help with reading this chart. this class i am struggling with and the assignment is due tonight
this is for Tesla
a. Using your Excel Workbook, look at the ratios you have calculated(see above) b. Figure out if the company is good at making money using the profitability ratios(return on equity, return on assets.) c. See how well the company uses its things to make money and how quickly it sells stuff. This would be your efficiency ratios (current ratio, cash ratio) d. Examine how much the company relies on borrowing and if it can cover its loan interest. Use your leverage ratios for this (debt-to-assets and interest coverage ratios).
\begin{tabular}{|c|c|c|c|c|c|} \hline Profitability Measures & Formula & - & 2023 & 2022 & 2021 \\ \hline Gross Profit Margin & (Gross Profit / Revenue) * 100 & & 19.80630499 & 21.73908511 & 25.27915575 \\ \hline Operating Profit Margin & (Operating Income / Revenue) 100 & & 11.18385388 & 14.23627038 & 12.11935418 \\ \hline Net Profit Margin & ( Net Income / Revenue) 100 & & 11.25161586 & 13.11767649 & 1.023725916 \\ \hline Return on Assets & (Net Income / Total Assets) 100 & & 20.22439616 & 25.32609488 & 21.89889105 \\ \hline Return on Equity & (Net Income / Shareholders' Equity) 100 & & 35.04186801 & 45.84185188 & 43.8690956 \\ \hline \end{tabular} \begin{tabular}{|c|c|c|c|c|c|c|c|c|} \hline Liquidity and Solvency Ratio v & Formula & - & 2023 & & 2022 & - & 2021 & \\ \hline Current Ratio & Current Assets / Current Liabilities & & \multicolumn{2}{|c|}{1.690165165} & \multicolumn{2}{|c|}{1.531955521} & \multicolumn{2}{|c|}{0.013752855} \\ \hline Quick Ratio & (Current Assets - Inventory) / Current Liabilities & \multicolumn{3}{|c|}{.1 .175112613} & \multicolumn{2}{|c|}{1.051256131} & \multicolumn{2}{|c|}{-0.278406496} \\ \hline Cash Ratio & Cash and Cash Equivalents / Current Liabilities & \multicolumn{3}{|c|}{0.866178679} & \multicolumn{2}{|c|}{0.608521472} & \multicolumn{2}{|c|}{0.898604415} \\ \hline Debt-to-Equity Ratio & Total Debt / Shareholders' Equity & \multicolumn{3}{|c|}{0.073259803} & \multicolumn{2}{|c|}{0.081008595} & \multicolumn{2}{|c|}{0.057397912} \\ \hline Interest Coverage Ratio & Operating Income / Interest Expense & \multicolumn{3}{|c|}{37.12110727} & \multicolumn{2}{|c|}{71.4973822} & \multicolumn{2}{|c|}{17.58221024} \\ \hline \end{tabular} \begin{tabular}{|l|l|r|r|r|} \hline Efficiency Ratios & Formula & 2023 & 2022 & 2021 \\ \hline Asset Turnover & Revenue / Average Total Assets & 1.021108994 & 0.989360927 & 0.866282532 \\ \hline Inventory Turnover & Cost of Goods Sold / Average Inventory & 5.358386737 & 4.720694758 & 6.98575647 \\ \hline Days Sales Outstanding & (Accounts Receivable / Revenue) * 365 & 13.11616488 & 13.22678058 & 12.97298553 \\ \hline Days Inventory & (Average Inventory / Cost of Goods Sold) * 365 & 68.11751706 & 77.31912752 & 52.24917324 \\ \hline Days Payable & (Accounts Payable / Cost of Goods Sold) *365 & 72.46857329 & 91.86878186 & 90.9845339 \\ \hline \end{tabular}Step by Step Solution
There are 3 Steps involved in it
Step: 1

Get Instant Access to Expert-Tailored Solutions
See step-by-step solutions with expert insights and AI powered tools for academic success
Step: 2

Step: 3
Ace Your Homework with AI
Get the answers you need in no time with our AI-driven, step-by-step assistance
Get Started
The Private Equity Toolkit A Step By Step Guide To Getting Deals Done From Sourcing To Exit
Authors: Tamara Sakovska
1st Edition
1119697107, 978-1119697107