Really not understanding these questions. Please post Excel formats.
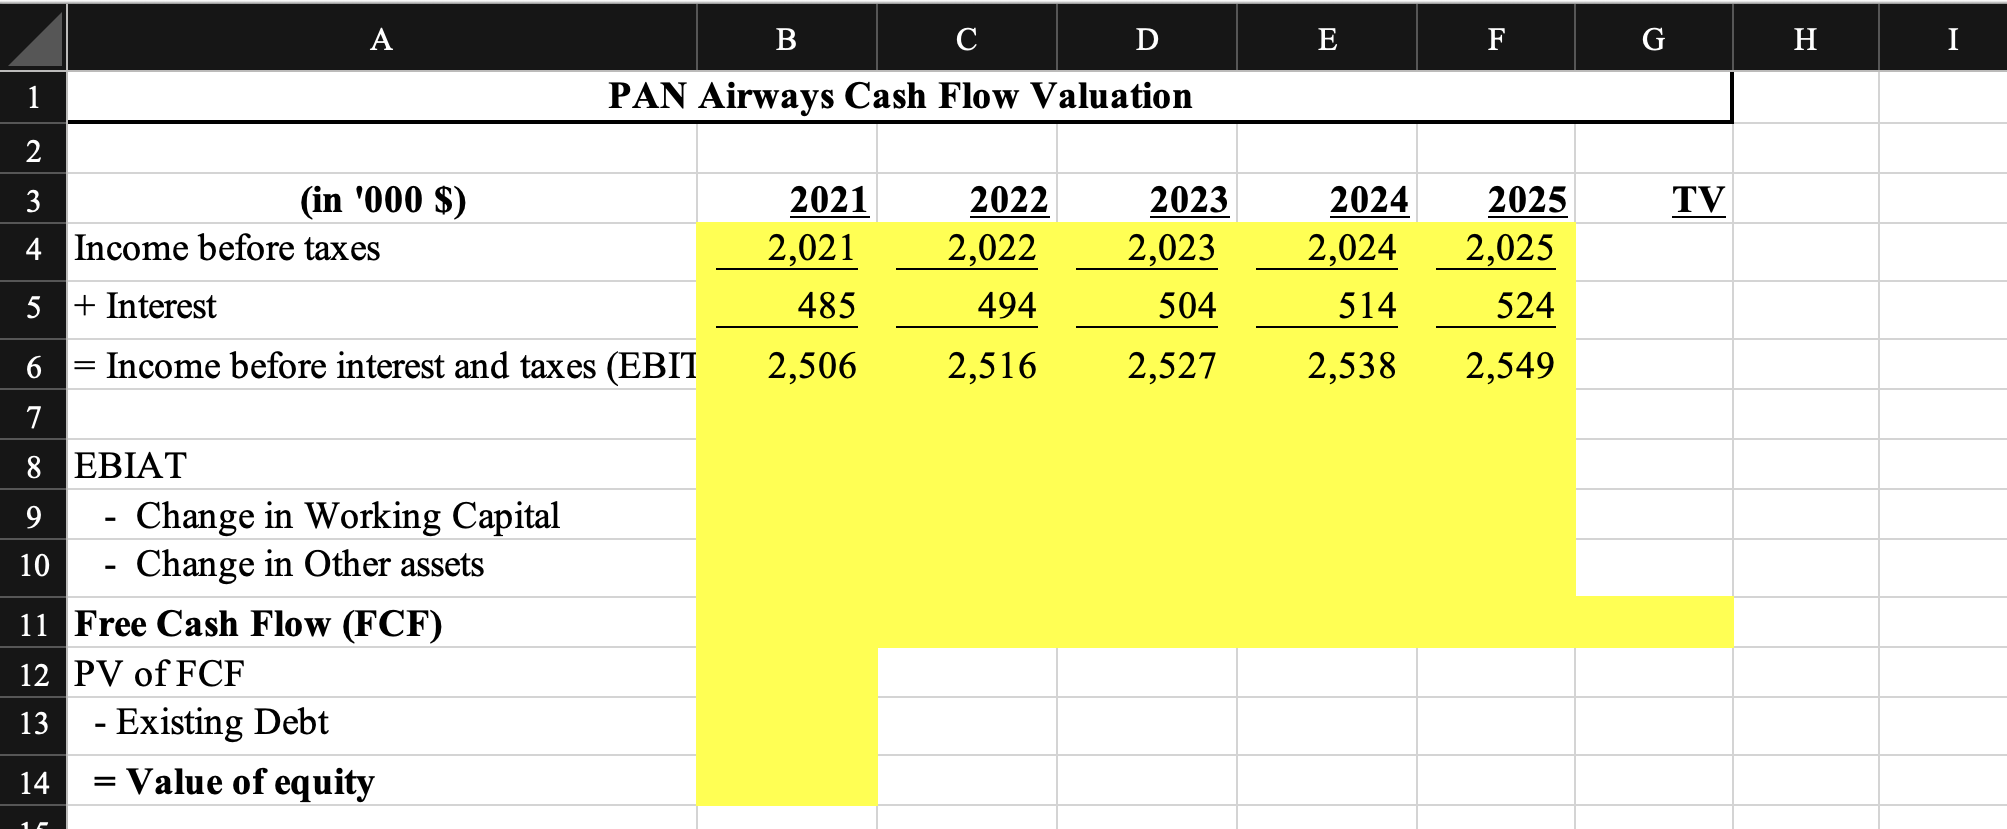
4. You must value PAN Airways using free cash flows to see the price of the equity.
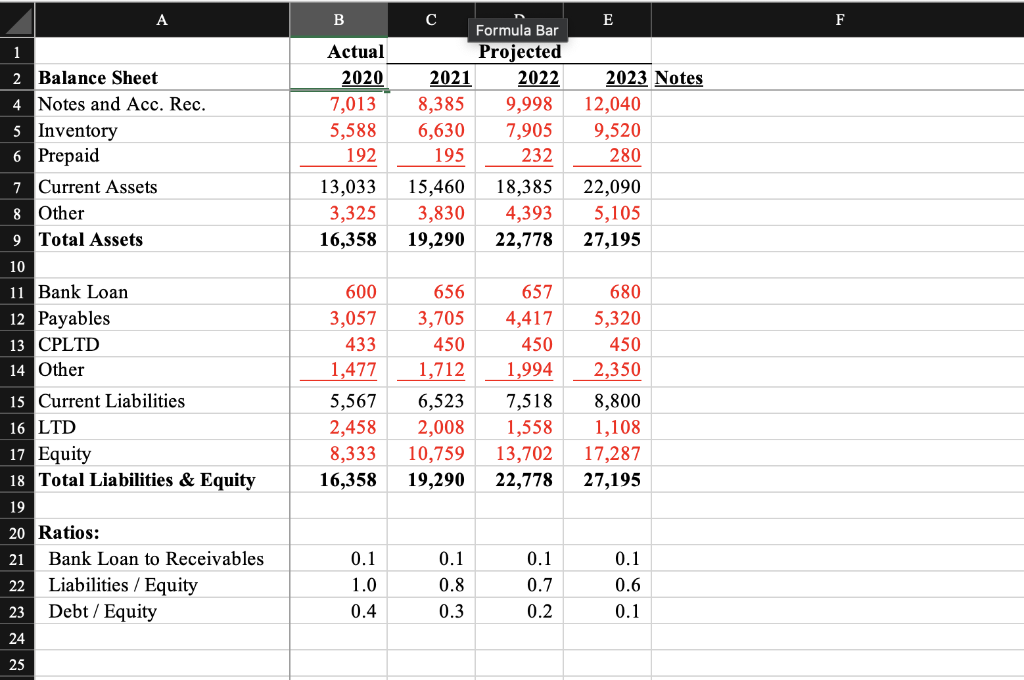
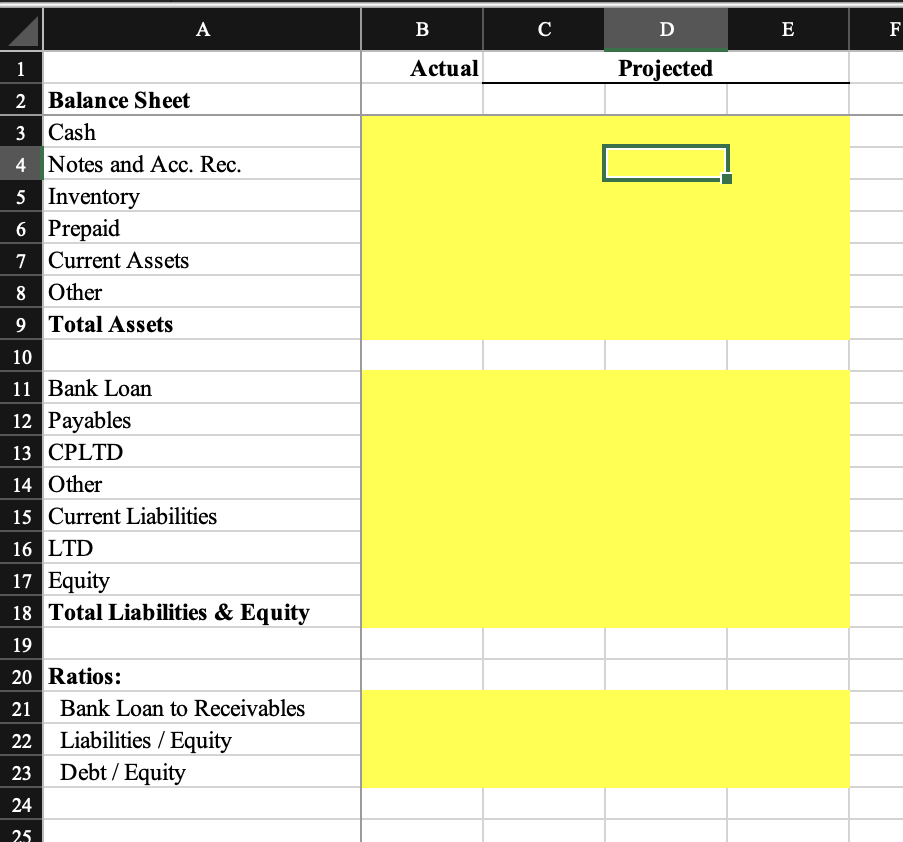
5. Last, you will consolidate the calculated balance sheet for PAN and the actual balance sheet for JTM and calculate the three ratios shown in the JTM balance sheet. All the data you need is in the template provided for you by JTMs CEO.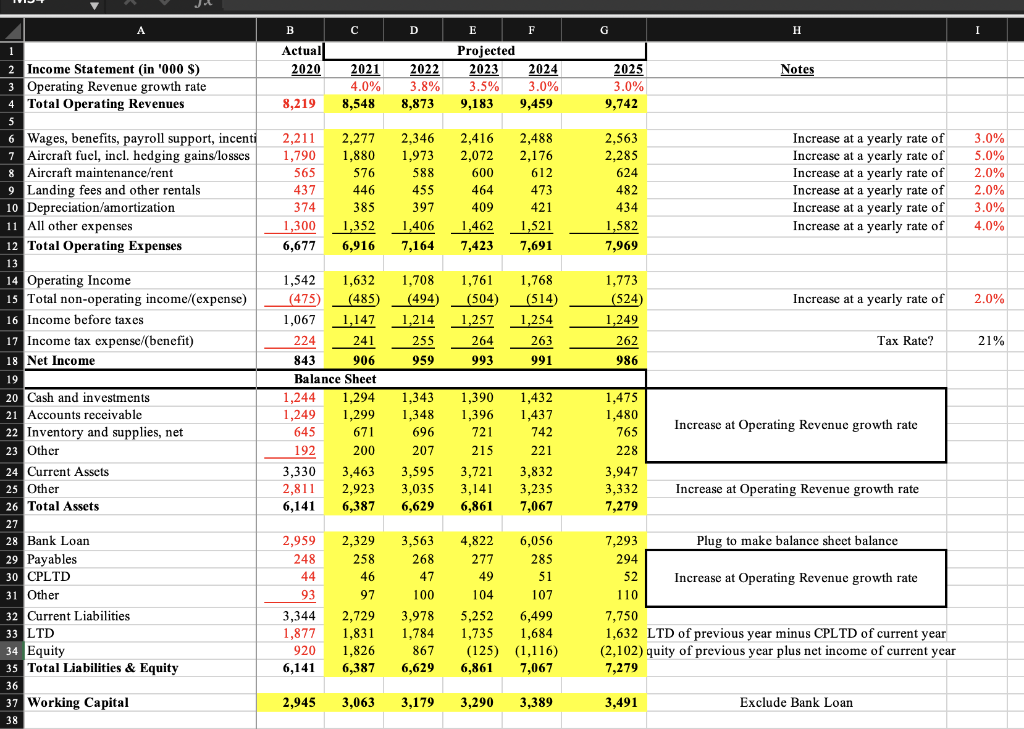
A B D G H I Actuall 2020 2021 4.0% 8,548 Notes E F F Projected 2023 2024 3.5% 3.0% 9,183 9,459 2022 3.8% 8,873 2025 3.0% 9,742 8,219 1 2 Income Statement (in '000 $) 3 Operating Revenue growth rate 4 Total Operating Revenues 5 6 Wages, benefits, payroll support, incenti 7 Aircraft fuel, incl. hedging gains/losses 8 Aircraft maintenance/rent 9 Landing fees and other rentals 10 Depreciation/amortization 11 All other expenses 12 Total Operating Expenses 13 14 Operating Income 15 Total non-operating income/expense) 16 Income before taxes 17 Income tax expense/(benefit) 18 Net Income 2,211 1,790 565 437 374 1,300 6,677 2,277 1,880 576 446 385 1,352 6,916 2,346 1,973 588 455 397 1,406 7,164 2,416 2,072 600 464 409 1,462 7,423 2,488 2,176 612 473 421 1,521 7,691 2,563 2,285 624 482 434 1,582 7,969 Increase at a yearly rate of Increase at a yearly rate of Increase at a yearly rate of Increase at a yearly rate of Increase at a yearly rate of Increase at a yearly rate of 3.0% 5.0% 2.0% 2.0% 3.0% 4.0% 1,708 (494) 1,214 Increase at a yearly rate of 2.0% 1,761 (504) 1,257 264 993 1,768 (514) 1,254 263 991 1,773 (524) 1,249 262 255 Tax Rate? 21% 959 986 19 1,542 1,632 (475) (485) 1,067 1,147 224 241 843 906 Balance Sheet 1,244 1,294 1,249 1,299 645 671 192 200 3,330 3,463 2,811 2,923 6,141 6,387 Increase at Operating Revenue growth rate 1,343 1,348 696 207 3,595 3,035 6,629 1,390 1,396 721 215 3,721 3,141 6,861 1,432 1,437 742 221 3,832 3,235 7,067 1,475 1,480 765 228 3,947 3,332 7,279 Increase at Operating Revenue growth rate 20 Cash and investments 21 Accounts receivable 22 Inventory and supplies, net 23 Other 24 Current Assets 25 Other 26 Total Assets 27 28 Bank Loan 29 Payables 30 CPLTD 31 Other 32 Current Liabilities 33 LTD 34 Equity 35 Total Liabilities & Equity 36 37 Working Capital 38 2,959 248 44 2,329 258 46 93 97 3,563 268 47 100 3,978 1.784 867 6,629 4,822 6,056 277 285 49 51 104 107 5,252 6,499 1,735 1,684 (125) (1,116) 6,861 7,067 7,293 Plug to make balance sheet balance 294 52 Increase at Operating Revenue growth rate 110 7,750 1,632 LTD of previous year minus CPLTD of current year (2,102) quity of previous year plus net income of current year 7,279 3,344 1,877 920 6,141 2,729 1,831 1,826 6,387 2,945 3,063 3,179 3,290 3,389 3,491 Exclude Bank Loan A B C D E F G H I 1 PAN Airways Cash Flow Valuation 2 3 (in '000 $) 4. Income before taxes TV 2021 2,021 2022 2,022 494 2023 2,023 2024 2,024 514 2025 2,025 5 + Interest 485 504 524 2,506 2,516 2,527 2,538 2,549 - - 6 = Income before interest and taxes (EBIT 7 8 EBIAT 9 Change in Working Capital 10 - Change in Other assets 11 Free Cash Flow (FCF) 12 PV of FCF 13 - Existing Debt 14 = Value of equity 1 A B E F Actual 2020 7,013 5,588 192 13,033 3,325 16,358 C Formula Bar Projected 2021 2022 8,385 9,998 6,630 7,905 195 232 2023 Notes 12,040 9,520 280 15,460 3,830 19,290 18,385 4,393 22,778 22,090 5,105 27,195 1 2 Balance Sheet 4 Notes and Acc. Rec. 5 Inventory 6 Prepaid 7 Current Assets 8 Other 9 Total Assets 10 11 Bank Loan 12 Payables 13 CPLTD 14 Other 15 Current Liabilities 16 LTD 17 Equity 18 Total Liabilities & Equity 19 20 Ratios: 21 Bank Loan to Receivables 22 Liabilities / Equity 23 Debt / Equity 24 600 3,057 433 1,477 5,567 2,458 8,333 16,358 656 3,705 450 1,712 6,523 2,008 10,759 19,290 657 4,417 450 1,994 7,518 1,558 13,702 22,778 680 5,320 450 2,350 8,800 1,108 17,287 27,195 0.1 1.0 0.4 0.1 0.8 0.3 0.1 0.7 0.2 0.1 0.6 0.1 25 A B C D E F Actual Projected 1 2 Balance Sheet 3 Cash 4 Notes and Acc. Rec. 5 Inventory 6 Prepaid 7 Current Assets 8 Other 9 Total Assets 10 11 Bank Loan 12 Payables 13 CPLTD 14 Other 15 Current Liabilities 16 LTD 17 Equity 18 Total Liabilities & Equity 19 20 Ratios: 21 Bank Loan to Receivables 22 Liabilities / Equity 23 Debt / Equity 24 25 A B D G H I Actuall 2020 2021 4.0% 8,548 Notes E F F Projected 2023 2024 3.5% 3.0% 9,183 9,459 2022 3.8% 8,873 2025 3.0% 9,742 8,219 1 2 Income Statement (in '000 $) 3 Operating Revenue growth rate 4 Total Operating Revenues 5 6 Wages, benefits, payroll support, incenti 7 Aircraft fuel, incl. hedging gains/losses 8 Aircraft maintenance/rent 9 Landing fees and other rentals 10 Depreciation/amortization 11 All other expenses 12 Total Operating Expenses 13 14 Operating Income 15 Total non-operating income/expense) 16 Income before taxes 17 Income tax expense/(benefit) 18 Net Income 2,211 1,790 565 437 374 1,300 6,677 2,277 1,880 576 446 385 1,352 6,916 2,346 1,973 588 455 397 1,406 7,164 2,416 2,072 600 464 409 1,462 7,423 2,488 2,176 612 473 421 1,521 7,691 2,563 2,285 624 482 434 1,582 7,969 Increase at a yearly rate of Increase at a yearly rate of Increase at a yearly rate of Increase at a yearly rate of Increase at a yearly rate of Increase at a yearly rate of 3.0% 5.0% 2.0% 2.0% 3.0% 4.0% 1,708 (494) 1,214 Increase at a yearly rate of 2.0% 1,761 (504) 1,257 264 993 1,768 (514) 1,254 263 991 1,773 (524) 1,249 262 255 Tax Rate? 21% 959 986 19 1,542 1,632 (475) (485) 1,067 1,147 224 241 843 906 Balance Sheet 1,244 1,294 1,249 1,299 645 671 192 200 3,330 3,463 2,811 2,923 6,141 6,387 Increase at Operating Revenue growth rate 1,343 1,348 696 207 3,595 3,035 6,629 1,390 1,396 721 215 3,721 3,141 6,861 1,432 1,437 742 221 3,832 3,235 7,067 1,475 1,480 765 228 3,947 3,332 7,279 Increase at Operating Revenue growth rate 20 Cash and investments 21 Accounts receivable 22 Inventory and supplies, net 23 Other 24 Current Assets 25 Other 26 Total Assets 27 28 Bank Loan 29 Payables 30 CPLTD 31 Other 32 Current Liabilities 33 LTD 34 Equity 35 Total Liabilities & Equity 36 37 Working Capital 38 2,959 248 44 2,329 258 46 93 97 3,563 268 47 100 3,978 1.784 867 6,629 4,822 6,056 277 285 49 51 104 107 5,252 6,499 1,735 1,684 (125) (1,116) 6,861 7,067 7,293 Plug to make balance sheet balance 294 52 Increase at Operating Revenue growth rate 110 7,750 1,632 LTD of previous year minus CPLTD of current year (2,102) quity of previous year plus net income of current year 7,279 3,344 1,877 920 6,141 2,729 1,831 1,826 6,387 2,945 3,063 3,179 3,290 3,389 3,491 Exclude Bank Loan A B C D E F G H I 1 PAN Airways Cash Flow Valuation 2 3 (in '000 $) 4. Income before taxes TV 2021 2,021 2022 2,022 494 2023 2,023 2024 2,024 514 2025 2,025 5 + Interest 485 504 524 2,506 2,516 2,527 2,538 2,549 - - 6 = Income before interest and taxes (EBIT 7 8 EBIAT 9 Change in Working Capital 10 - Change in Other assets 11 Free Cash Flow (FCF) 12 PV of FCF 13 - Existing Debt 14 = Value of equity 1 A B E F Actual 2020 7,013 5,588 192 13,033 3,325 16,358 C Formula Bar Projected 2021 2022 8,385 9,998 6,630 7,905 195 232 2023 Notes 12,040 9,520 280 15,460 3,830 19,290 18,385 4,393 22,778 22,090 5,105 27,195 1 2 Balance Sheet 4 Notes and Acc. Rec. 5 Inventory 6 Prepaid 7 Current Assets 8 Other 9 Total Assets 10 11 Bank Loan 12 Payables 13 CPLTD 14 Other 15 Current Liabilities 16 LTD 17 Equity 18 Total Liabilities & Equity 19 20 Ratios: 21 Bank Loan to Receivables 22 Liabilities / Equity 23 Debt / Equity 24 600 3,057 433 1,477 5,567 2,458 8,333 16,358 656 3,705 450 1,712 6,523 2,008 10,759 19,290 657 4,417 450 1,994 7,518 1,558 13,702 22,778 680 5,320 450 2,350 8,800 1,108 17,287 27,195 0.1 1.0 0.4 0.1 0.8 0.3 0.1 0.7 0.2 0.1 0.6 0.1 25 A B C D E F Actual Projected 1 2 Balance Sheet 3 Cash 4 Notes and Acc. Rec. 5 Inventory 6 Prepaid 7 Current Assets 8 Other 9 Total Assets 10 11 Bank Loan 12 Payables 13 CPLTD 14 Other 15 Current Liabilities 16 LTD 17 Equity 18 Total Liabilities & Equity 19 20 Ratios: 21 Bank Loan to Receivables 22 Liabilities / Equity 23 Debt / Equity 24 25