Answered step by step
Verified Expert Solution
Question
1 Approved Answer
Recent geo-political events and post-pandemic inflation concerns have seen large swings in commodity prices in recent years. Unsurprisingly, many of your clients are trying


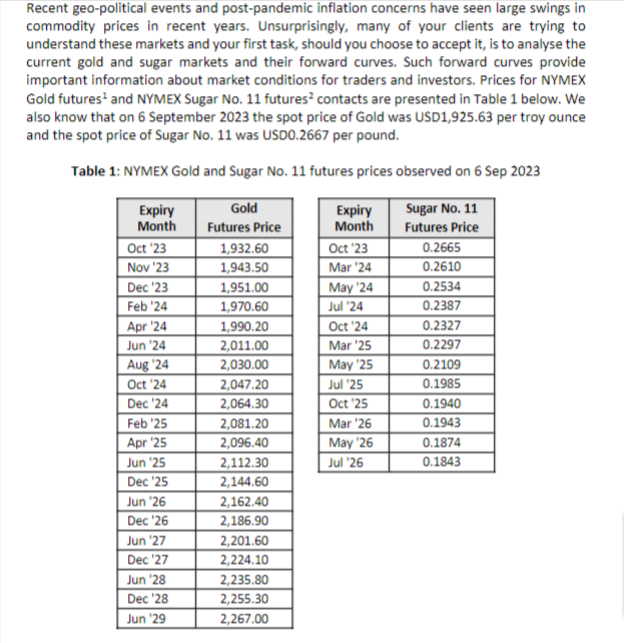
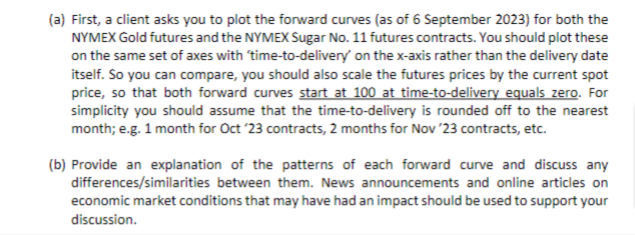
Recent geo-political events and post-pandemic inflation concerns have seen large swings in commodity prices in recent years. Unsurprisingly, many of your clients are trying to understand these markets and your first task, should you choose to accept it, is to analyse the current gold and sugar markets and their forward curves. Such forward curves provide important information about market conditions for traders and investors. Prices for NYMEX Gold futures and NYMEX Sugar No. 11 futures contacts are presented in Table 1 below. We also know that on 6 September 2023 the spot price of Gold was USD1,925.63 per troy ounce and the spot price of Sugar No. 11 was USD0.2667 per pound. Table 1: NYMEX Gold and Sugar No. 11 futures prices observed on 6 Sep 2023 Gold Sugar No. 11 Futures Price Futures Price Expiry Month Oct 23 Nov '23 Dec '23 Feb '24 Apr 24 Jun '24 Aug 24 Oct 24 Dec '24 Feb '25 Apr 25 Jun 25 Dec 25 Jun 26 Dec 26 Jun '27 Dec '27 Jun '28 Dec '28 Jun '29 1,932.60 1,943.50 1,951.00 1,970.60 1,990.20 2,011.00 2,030.00 2,047.20 2,064.30 2,081.20 2,096.40 2,112.30 2,144.60 2,162.40 2,186.90 2,201.60 2,224.10 2,235.80 2,255.30 2,267.00 Expiry Month Oct 23 Mar '24 May 24 Jul '24 Oct 24 Mar 25 May '25 Jul '25 Oct 25 Mar 26 May 26 Jul '26 0.2665 0.2610 0.2534 0.2387 0.2327 0.2297 0.2109 0.1985 0.1940 0.1943 0.1874 0.1843 (a) First, a client asks you to plot the forward curves (as of 6 September 2023) for both the NYMEX Gold futures and the NYMEX Sugar No. 11 futures contracts. You should plot these on the same set of axes with 'time-to-delivery on the x-axis rather than the delivery date itself. So you can compare, you should also scale the futures prices by the current spot price, so that both forward curves start at 100 at time-to-delivery equals zero. For simplicity you should assume that the time-to-delivery is rounded off to the nearest month; e.g. 1 month for Oct 23 contracts, 2 months for Nov '23 contracts, etc. (b) Provide an explanation of the patterns of each forward curve and discuss any differences/similarities between them. News announcements and online articles on economic market conditions that may have had an impact should be used to support your discussion.
Step by Step Solution
There are 3 Steps involved in it
Step: 1
a To plot the forward curves for NYMEX Gold and NYMEX Sugar No 11 futures contracts as of 6 September 2023 we need to calculate the prices relative to ...
Get Instant Access to Expert-Tailored Solutions
See step-by-step solutions with expert insights and AI powered tools for academic success
Step: 2

Step: 3

Ace Your Homework with AI
Get the answers you need in no time with our AI-driven, step-by-step assistance
Get Started


