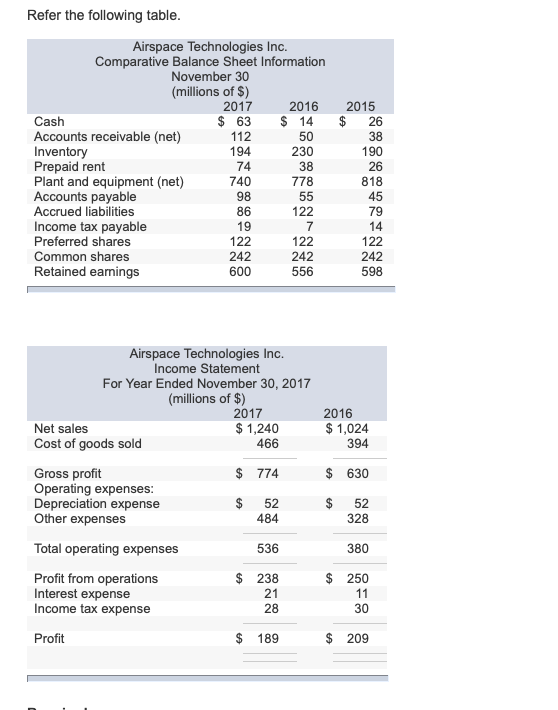
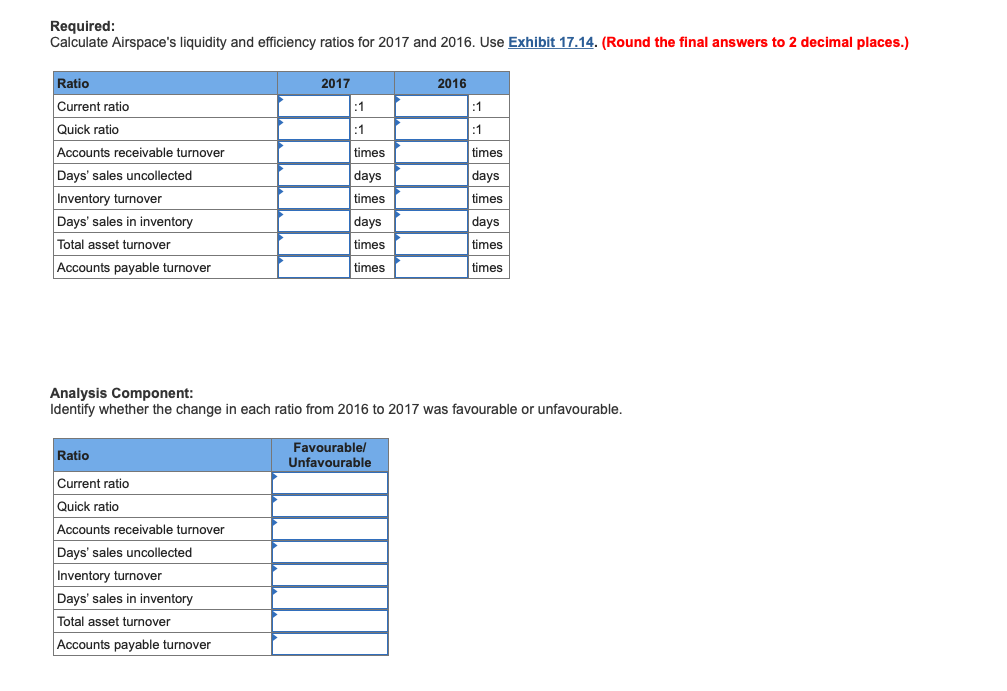
Refer the following table. Airspace Technologies Inc. Comparative Balance Sheet Information November 30 (millions of $) 2017 2016 2015 26 38 190 26 818 45 $ 14 Cash 63 Accounts receivable (net) Inventory Prepaid rent Plant and equipment (net) Accounts payable Accrued liabilities Income tax payable Preferred shares Common shares Retained earnings 112 50 194 230 38 74 740 98 86 19 122 242 600 778 55 122 79 14 122 7 122 242 598 242 556 Airspace Technologies Inc. Income Statement For Year Ended November 30, 2017 (millions of $) 2017 $1,240 466 2016 1,024 394 Net sales Cost of goods sold Gross profit Operating expenses: Depreciation expense Other expenses $ 774 630 52 328 52 484 Total operating expenses 536 380 $ 238 Profit from operations Interest expense Income tax expense 250 11 30 21 28 $ 209 Profit 189 Required Calculate Airspace's liquidity and efficiency ratios for 2017 and 2016. Use Exhibit 17.14. (Round the final answers to 2 decimal places.) Ratio 2017 2016 Current ratio :1 :1 Quick ratio :1 :1 Accounts receivable turnover times times Days' sales uncollected days days Inventory turnover times times Days' sales in inventory days days times Total asset turnover times Accounts payable turnover times times Analysis Component: Identify whether the change in each ratio from 2016 to 2017 was favourable or unfavourable. Favourable Unfavourable Ratio Current ratio Quick ratio Accounts receivable turnover Days' sales uncollected Inventory turnover Days' sales in inventory Total asset turnover Accounts payable turnover Refer the following table. Airspace Technologies Inc. Comparative Balance Sheet Information November 30 (millions of $) 2017 2016 2015 26 38 190 26 818 45 $ 14 Cash 63 Accounts receivable (net) Inventory Prepaid rent Plant and equipment (net) Accounts payable Accrued liabilities Income tax payable Preferred shares Common shares Retained earnings 112 50 194 230 38 74 740 98 86 19 122 242 600 778 55 122 79 14 122 7 122 242 598 242 556 Airspace Technologies Inc. Income Statement For Year Ended November 30, 2017 (millions of $) 2017 $1,240 466 2016 1,024 394 Net sales Cost of goods sold Gross profit Operating expenses: Depreciation expense Other expenses $ 774 630 52 328 52 484 Total operating expenses 536 380 $ 238 Profit from operations Interest expense Income tax expense 250 11 30 21 28 $ 209 Profit 189 Required Calculate Airspace's liquidity and efficiency ratios for 2017 and 2016. Use Exhibit 17.14. (Round the final answers to 2 decimal places.) Ratio 2017 2016 Current ratio :1 :1 Quick ratio :1 :1 Accounts receivable turnover times times Days' sales uncollected days days Inventory turnover times times Days' sales in inventory days days times Total asset turnover times Accounts payable turnover times times Analysis Component: Identify whether the change in each ratio from 2016 to 2017 was favourable or unfavourable. Favourable Unfavourable Ratio Current ratio Quick ratio Accounts receivable turnover Days' sales uncollected Inventory turnover Days' sales in inventory Total asset turnover Accounts payable turnover