Answered step by step
Verified Expert Solution
Question
1 Approved Answer
Refer the following table Focus Metals Inc Comparative Balance Sheet Information November 30 (millions of $) 2017 25 422 2016 95 268 Cash Accounts receivable
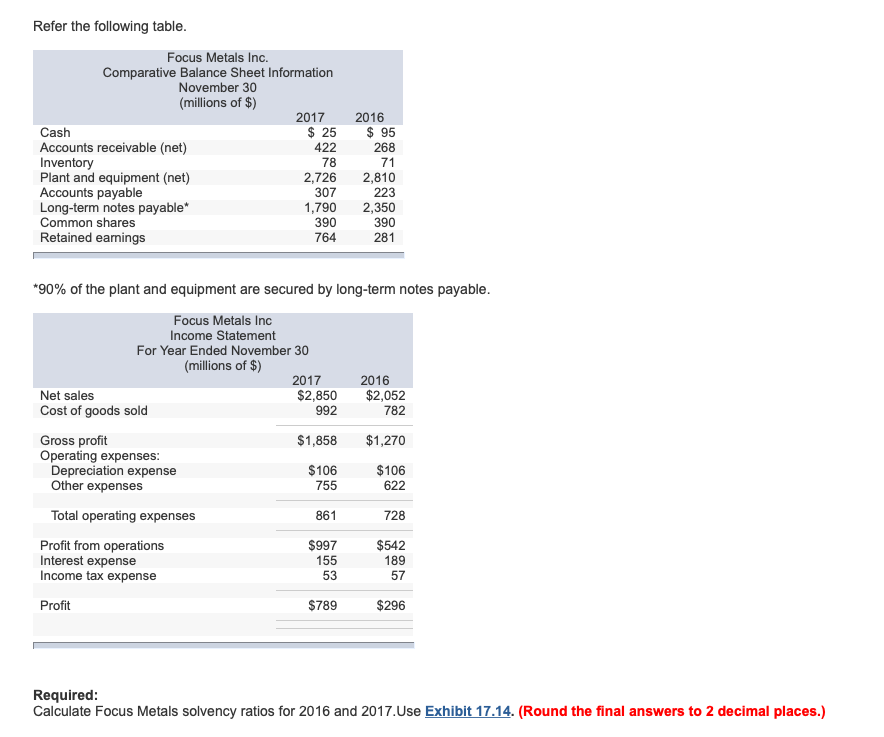
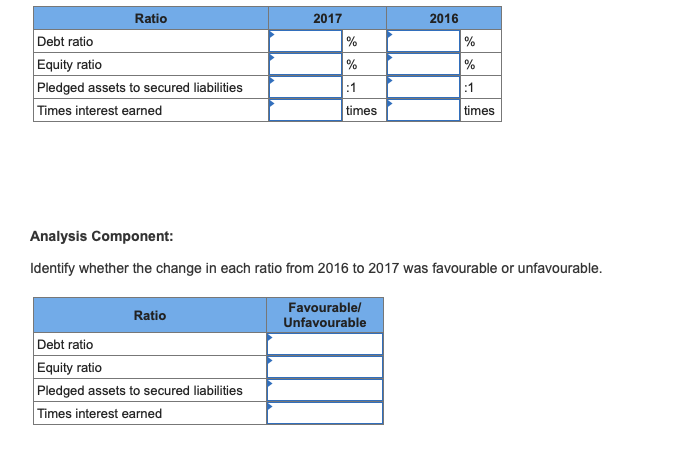
Refer the following table Focus Metals Inc Comparative Balance Sheet Information November 30 (millions of $) 2017 25 422 2016 95 268 Cash Accounts receivable (net) Inventory Plant and equipment (net) Accounts payable Long-term notes payable Common shares Retained earnings 78 71 2,726 307 1,790 390 764 2,810 223 2,350 390 281 *90% of the plant and equipment are secured by long-term notes payable Focus Metals Inc Income Statement For Year Ended November 30 (millions of $) 2017 2016 $2,052 782 Net sales $2,850 992 Cost of goods sold Gross profit Operating expenses: Depreciation expense Other expenses $1,858 $1,270 $106 $106 622 755 Total operating expenses 861 728 Profit from operations Interest expense Income tax expense $997 $542 189 155 53 57 Profit $789 $296 Required: Calculate Focus Metals solvency ratios for 2016 and 2017.Use Exhibit 17.14. (Round the final answers to 2 decimal places.) Ratio 2017 2016 Debt ratio % % Equity ratio Pledged assets to secured liabilities Times interest earned :1 1 times times Analysis Component: Identify whether the change in each ratio from 2016 to 2017 was favourable or unfavourable. Favourable Unfavourable Ratio Debt ratio Equity ratio Pledged assets to secured liabilities Times interest earned
Step by Step Solution
There are 3 Steps involved in it
Step: 1
Get Instant Access to Expert-Tailored Solutions
See step-by-step solutions with expert insights and AI powered tools for academic success
Step: 2
Step: 3
Ace Your Homework with AI
Get the answers you need in no time with our AI-driven, step-by-step assistance
Get Started