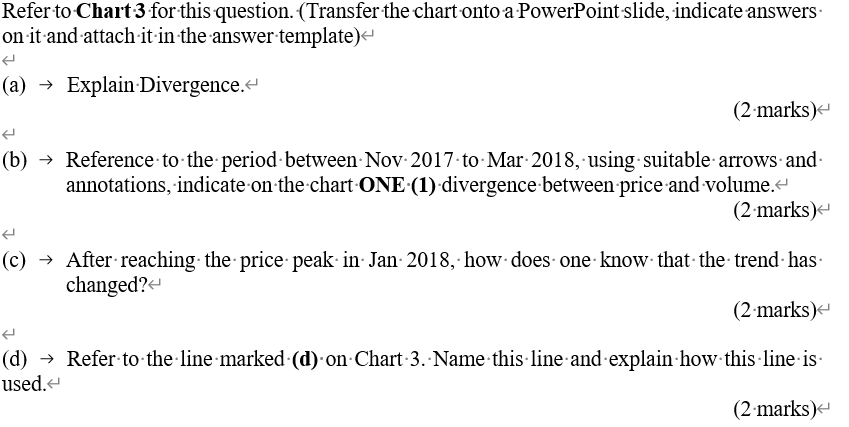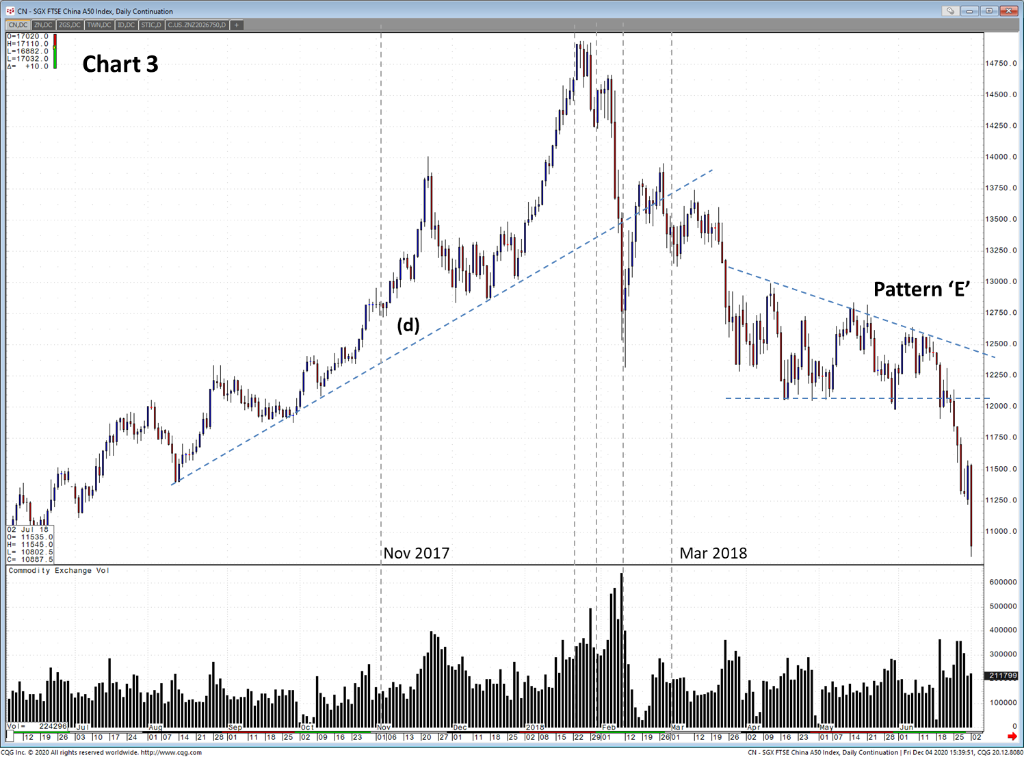

Refer to Chart 3 for this question. (Transfer the chart onto a PowerPoint slide, indicate answers on it and attach it in the answer template) (a) Explain Divergence. (2 marks (b) Reference to the period betweenNov-2017-to-Mar-2018, using suitable arrows and annotations, indicate on the chart-ONE (1) divergence between price and volume. (2 marks) (C) After reaching the price peak in Jan 2018, how does one know that the trend has changed? (2 marks) (d) Refer-to-the-line marked (d) on-Chart-3. Name this line and explain how this line is used. (2 marks) CN - SGX FTSE China A50 Index, Daily Continuation CNDC 2ND 20DC TWIN.DC D.DCSTICDC.US 22.2025750,0 17020.0 17110.0 L-16882.0 L-17032.0 - +10.0 Chart 3 14750.0 14500.0 14250.0 14000.0 13750.0 13500.0 13250.0 13000.0 Pattern 'E' 12750.0 (d) 125000 12250.0 12000.0 11750.0 11500.0 11250.0 11000.0 02 Jul 18 0-115350 H 11545.0 L-108025 C 10087.5 Commodity Exchange Vol Nov 2017 Mar 2018 600000 500000 400000 300000 211790 100000 Vol- 224290ST Aug 112 19 26 103 10 17 124 101 107 114 21 28 101 111 18 25 102 109 16 23 COG Inc. 2020 All rights reserved worldwide. http://www.cog.com 2018 TO 106 13 20 27 101 111 18 25 102 08 15 22 2901 112 19 2601 112 19 26 102 109 16 23 01 07 14 21 28 01 11 18 25 102 CN-SGK FTSE China ASO Index, Daily Continuation Fri Dec 04 2020 15:39:51, CQG 20.12.6060 Refer to Chart 3 for this question. (Transfer the chart onto a PowerPoint slide, indicate answers on it and attach it in the answer template) (a) Explain Divergence. (2 marks (b) Reference to the period betweenNov-2017-to-Mar-2018, using suitable arrows and annotations, indicate on the chart-ONE (1) divergence between price and volume. (2 marks) (C) After reaching the price peak in Jan 2018, how does one know that the trend has changed? (2 marks) (d) Refer-to-the-line marked (d) on-Chart-3. Name this line and explain how this line is used. (2 marks) CN - SGX FTSE China A50 Index, Daily Continuation CNDC 2ND 20DC TWIN.DC D.DCSTICDC.US 22.2025750,0 17020.0 17110.0 L-16882.0 L-17032.0 - +10.0 Chart 3 14750.0 14500.0 14250.0 14000.0 13750.0 13500.0 13250.0 13000.0 Pattern 'E' 12750.0 (d) 125000 12250.0 12000.0 11750.0 11500.0 11250.0 11000.0 02 Jul 18 0-115350 H 11545.0 L-108025 C 10087.5 Commodity Exchange Vol Nov 2017 Mar 2018 600000 500000 400000 300000 211790 100000 Vol- 224290ST Aug 112 19 26 103 10 17 124 101 107 114 21 28 101 111 18 25 102 109 16 23 COG Inc. 2020 All rights reserved worldwide. http://www.cog.com 2018 TO 106 13 20 27 101 111 18 25 102 08 15 22 2901 112 19 2601 112 19 26 102 109 16 23 01 07 14 21 28 01 11 18 25 102 CN-SGK FTSE China ASO Index, Daily Continuation Fri Dec 04 2020 15:39:51, CQG 20.12.6060


