Question
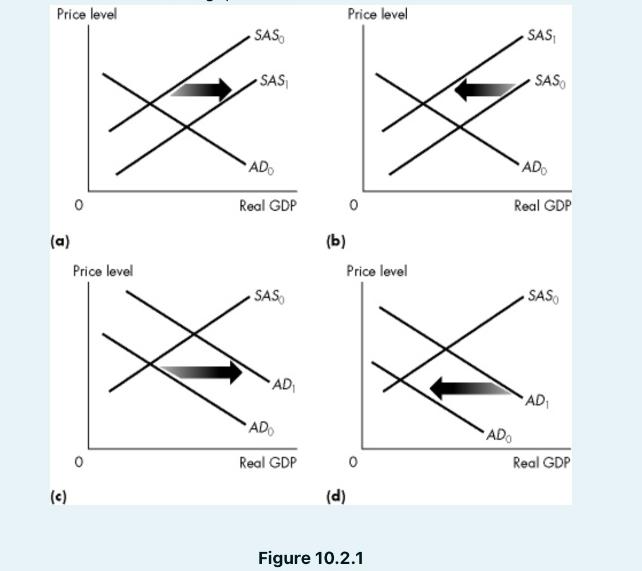
Refer to Figure 10.2.1. Which graph illustrates the effect of a decrease in the quantity of money? a. (a) only b. (d) only c.


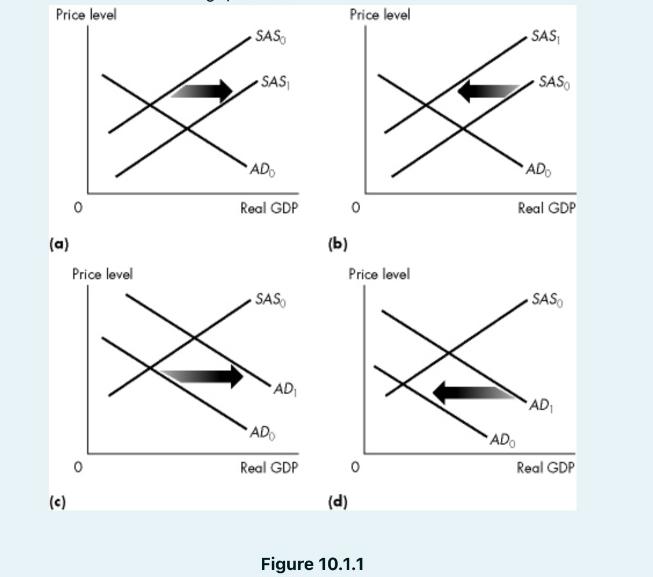
Refer to Figure 10.2.1. Which graph illustrates the effect of a decrease in the quantity of money? a. (a) only b. (d) only c. (c) only O d. Both (b) and (d) e. (b) only Price level (a) (c) Price level SAS SAS ADO Real GDP SASO AD ADO Real GDP Price level (b) (d) 0 Price level Figure 10.2.1 ADO SAS SASO ADO Real GDP SASO AD Real GDP Refer to Figure 10.1.1. Which graph illustrates the effect of an increase in factor prices? a. (c) b. (a) and (b) c. (a) (b) e. (d) O d. Price level (a) (c) Price level SAS SAS ADO Real GDP SASO AD ADO Real GDP (b) Price level Price level (d) Figure 10.1.1 ADO SAS SASO AD Real GDP SASO AD Real GDP
Step by Step Solution
3.46 Rating (156 Votes )
There are 3 Steps involved in it
Step: 1
The detailed answer for the above question is provided below For the first question which asks for the graph that illustrates the effect of a decrease ...
Get Instant Access to Expert-Tailored Solutions
See step-by-step solutions with expert insights and AI powered tools for academic success
Step: 2

Step: 3

Ace Your Homework with AI
Get the answers you need in no time with our AI-driven, step-by-step assistance
Get StartedRecommended Textbook for
Economics
Authors: R. Glenn Hubbard
6th edition
978-0134797731, 134797736, 978-0134106243
Students also viewed these General Management questions
Question
Answered: 1 week ago
Question
Answered: 1 week ago
Question
Answered: 1 week ago
Question
Answered: 1 week ago
Question
Answered: 1 week ago
Question
Answered: 1 week ago
Question
Answered: 1 week ago
Question
Answered: 1 week ago
Question
Answered: 1 week ago
Question
Answered: 1 week ago
Question
Answered: 1 week ago
Question
Answered: 1 week ago
Question
Answered: 1 week ago
Question
Answered: 1 week ago
Question
Answered: 1 week ago
Question
Answered: 1 week ago
Question
Answered: 1 week ago
Question
Answered: 1 week ago
Question
Answered: 1 week ago
Question
Answered: 1 week ago
Question
Answered: 1 week ago
Question
Answered: 1 week ago
View Answer in SolutionInn App


