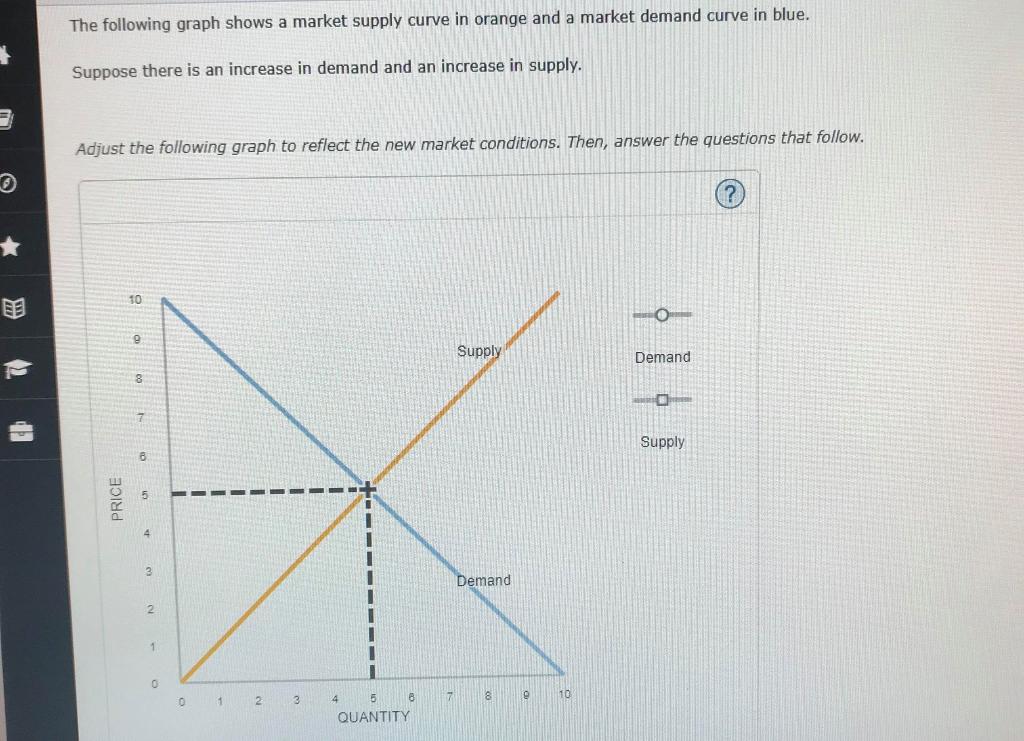
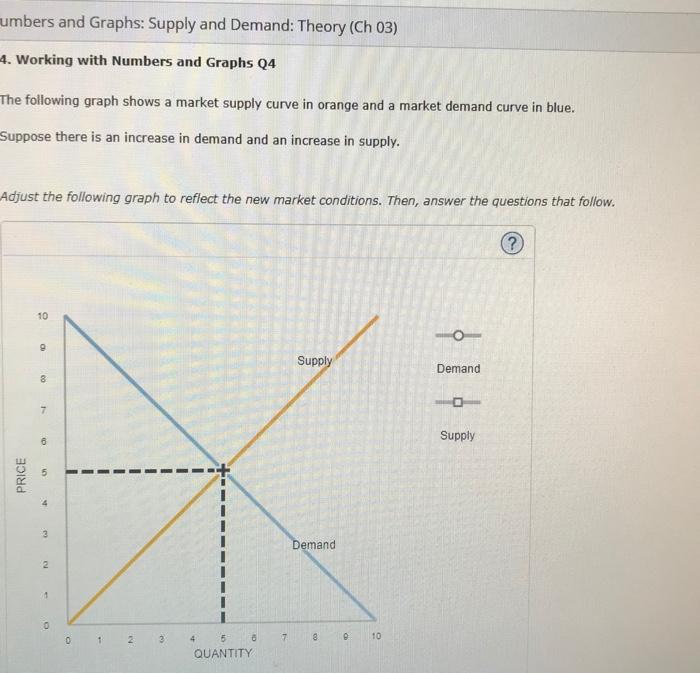
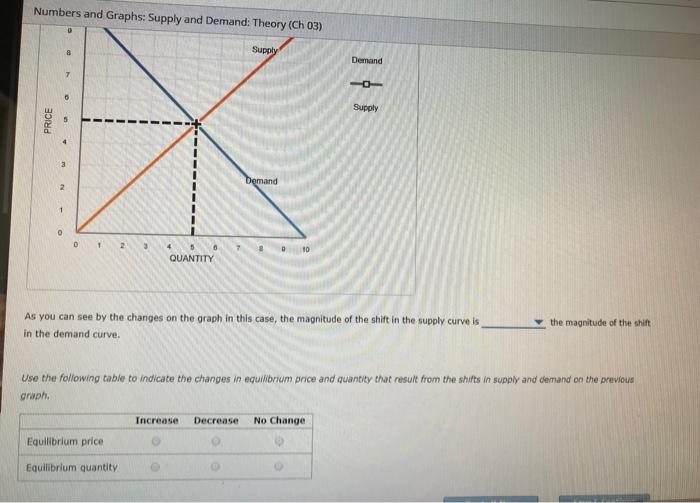
The following graph shows a market supply curve in orange and a market demand curve in...
Fantastic news! We've Found the answer you've been seeking!
Question:
![image text in transcribed](https://dsd5zvtm8ll6.cloudfront.net/questions/2024/07/668e27a14c24e_1720592285548.jpg)
![image text in transcribed](https://dsd5zvtm8ll6.cloudfront.net/questions/2024/07/668e27f628b00_1720592369113.jpg)
![image text in transcribed](https://dsd5zvtm8ll6.cloudfront.net/questions/2024/07/668e287725778_1720592497958.jpg)
![image text in transcribed](https://dsd5zvtm8ll6.cloudfront.net/questions/2024/07/668e288205300_1720592512560.jpg)
![image text in transcribed](https://dsd5zvtm8ll6.cloudfront.net/questions/2024/07/668e29225032a_1720592671128.jpg)
Transcribed Image Text:
The following graph shows a market supply curve in orange and a market demand curve in blue. Suppose there is an increase in demand and an increase in supply. Adjust the following graph to reflect the new market conditions. Then, answer the questions that follow. PRICE 10 о Supply Demand 8 7 5 4 3 2 Demand 0 1 2 3 4 5 B 7 8 9 10 QUANTITY Supply PRICE * 1 2 3 5 Demand 0 0 1 2 3 4 5 6 7 8 9 10 QUANTITY Supply As you can see by the changes on the graph in this case, the magnitude of the shift in the supply curve is in the demand curve. the magnitude of the shift Use the following table to indicate the changes in equilibrium price and quantity that result from the shifts in supply and demand on the previous graph. Equilibrium price Equilibrium quantity Increase Decrease No Change umbers and Graphs: Supply and Demand: Theory (Ch 03) 4. Working with Numbers and Graphs Q4 The following graph shows a market supply curve in orange and a market demand curve in blue. Suppose there is an increase in demand and an increase in supply. Adjust the following graph to reflect the new market conditions. Then, answer the questions that follow. PRICE 10 10 Οι 00 8 7 4 3 2 1 Supply Demand Demand 0 0 1 2 5 8 7 8 10 QUANTITY Supply ? Numbers and Graphs: Supply and Demand: Theory (Ch 03) Supply PRICE Demand 0 ° 1 3 10 QUANTITY Demand Supply As you can see by the changes on the graph in this case, the magnitude of the shift in the supply curve is in the demand curve. the magnitude of the shift equal to Use the following table to indicate the changes in equilibrium price and quantity that result from the shifts graph. more than demand on the previous less than Increase Decrease No Change Equilibrium price Equilibrium quantity Numbers and Graphs: Supply and Demand: Theory (Ch 03) Supply PRICE Demand 10 QUANTITY Demand Supply As you can see by the changes on the graph in this case, the magnitude of the shift in the supply curve is in the demand curve. the magnitude of the shift Use the following table to indicate the changes in equilibrium price and quantity that result from the shifts in supply and demand on the previous graph. Increase Decrease No Change Equilibrium price Equilibrium quantity The following graph shows a market supply curve in orange and a market demand curve in blue. Suppose there is an increase in demand and an increase in supply. Adjust the following graph to reflect the new market conditions. Then, answer the questions that follow. PRICE 10 о Supply Demand 8 7 5 4 3 2 Demand 0 1 2 3 4 5 B 7 8 9 10 QUANTITY Supply PRICE * 1 2 3 5 Demand 0 0 1 2 3 4 5 6 7 8 9 10 QUANTITY Supply As you can see by the changes on the graph in this case, the magnitude of the shift in the supply curve is in the demand curve. the magnitude of the shift Use the following table to indicate the changes in equilibrium price and quantity that result from the shifts in supply and demand on the previous graph. Equilibrium price Equilibrium quantity Increase Decrease No Change umbers and Graphs: Supply and Demand: Theory (Ch 03) 4. Working with Numbers and Graphs Q4 The following graph shows a market supply curve in orange and a market demand curve in blue. Suppose there is an increase in demand and an increase in supply. Adjust the following graph to reflect the new market conditions. Then, answer the questions that follow. PRICE 10 10 Οι 00 8 7 4 3 2 1 Supply Demand Demand 0 0 1 2 5 8 7 8 10 QUANTITY Supply ? Numbers and Graphs: Supply and Demand: Theory (Ch 03) Supply PRICE Demand 0 ° 1 3 10 QUANTITY Demand Supply As you can see by the changes on the graph in this case, the magnitude of the shift in the supply curve is in the demand curve. the magnitude of the shift equal to Use the following table to indicate the changes in equilibrium price and quantity that result from the shifts graph. more than demand on the previous less than Increase Decrease No Change Equilibrium price Equilibrium quantity Numbers and Graphs: Supply and Demand: Theory (Ch 03) Supply PRICE Demand 10 QUANTITY Demand Supply As you can see by the changes on the graph in this case, the magnitude of the shift in the supply curve is in the demand curve. the magnitude of the shift Use the following table to indicate the changes in equilibrium price and quantity that result from the shifts in supply and demand on the previous graph. Increase Decrease No Change Equilibrium price Equilibrium quantity
Expert Answer:
Answer rating: 100% (QA)
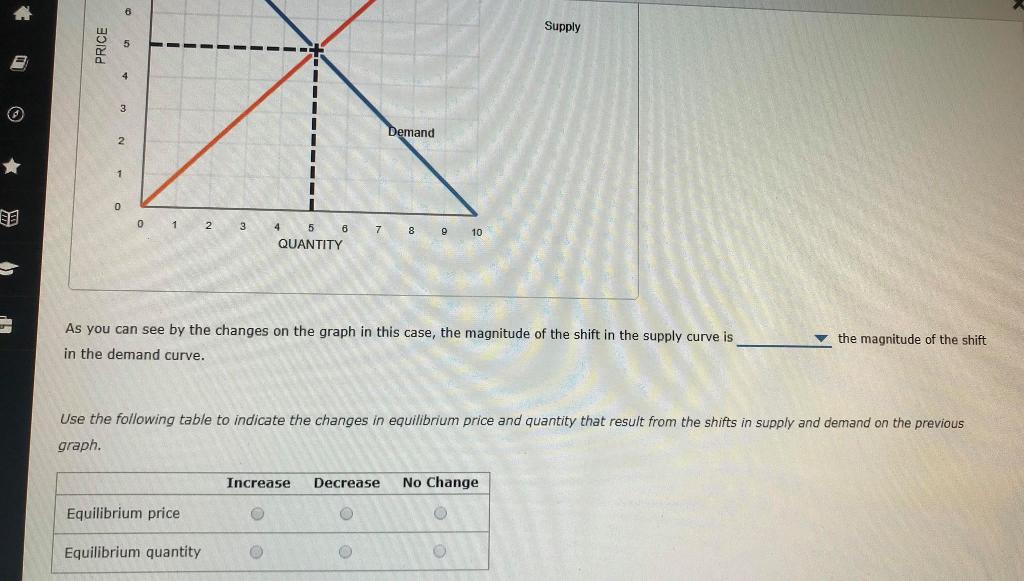
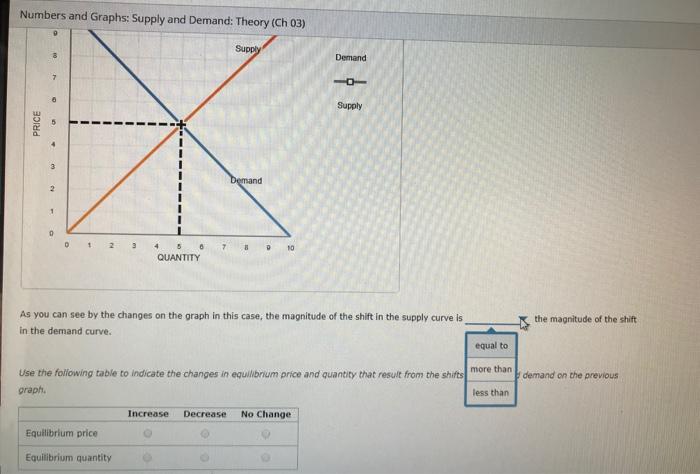
1 Understanding the Initial Graph The initial graph displays a market supply curve in orange and a market demand curve in blue The point where these two curves intersect represents the equilibrium pri... View the full answer
Posted Date:
Students also viewed these economics questions
-
E 7-8 Midyear purchase of subsidiarys bonds Sanur Corporation is a 90 percent subsidiary of Pare Corporation. On January 1, 2016, Sanur issued $1,000,000 par, 10 percent 5-year bonds with an...
-
Does the reaction p + 7/3Li 4/2He + required energy, or does it release energy? How much energy?
-
could some one show me how to do this one Ulld peel 13 Homework eBook 34 Show Me How Calculator Print Item Dividends Per Share Year 1 Year 2 Oceanic Company has 25,000 shares of cumulative preferred...
-
A large lake is home to three different types of herons: blue herons, grey herons, and paisley herons. There are 14 blue herons, 10 grey herons, and 9 paisley herons. A local researcher wishes to...
-
Consider the project information in the table below: Draw and analyze a project network diagram to answer the following questions: a. If you were to start on this project, which are the activities...
-
Lacey, Inc., had the following sales and purchase transactions during 2011. Beginning inventory consisted of 80 items at \(\$ 120\) each. Lacey uses the FIFO cost flow assumption and keeps perpetual...
-
Refer to the Camp Sunshine data presented in E5-9. Required: 1. Perform a least-squares regression analysis on Camp Sunshines data. 2. Using the regression output, create a cost equation (Y = A + BX)...
-
The following information pertains to the first year of operation for Sonic Boom Radios, Inc. Required: Prepare Sonic Booms full absorption costing income statement and variable costing income...
-
Jane Crawford, the president of Crawford Enterprises, is considering two investment opportunities. Because of limited resources, she will be able to invest in only one of them. Project A is to...
-
thirty percent of restaurants do not serve breakfast. a diner selects a random sample of eight restaurants and is interested in the number that serve breakfast a) calculate the probability that...
![Mobile App Logo](https://dsd5zvtm8ll6.cloudfront.net/includes/images/mobile/finalLogo.png)
Study smarter with the SolutionInn App