

Answered step by step
Verified Expert Solution
Question
1 Approved Answer
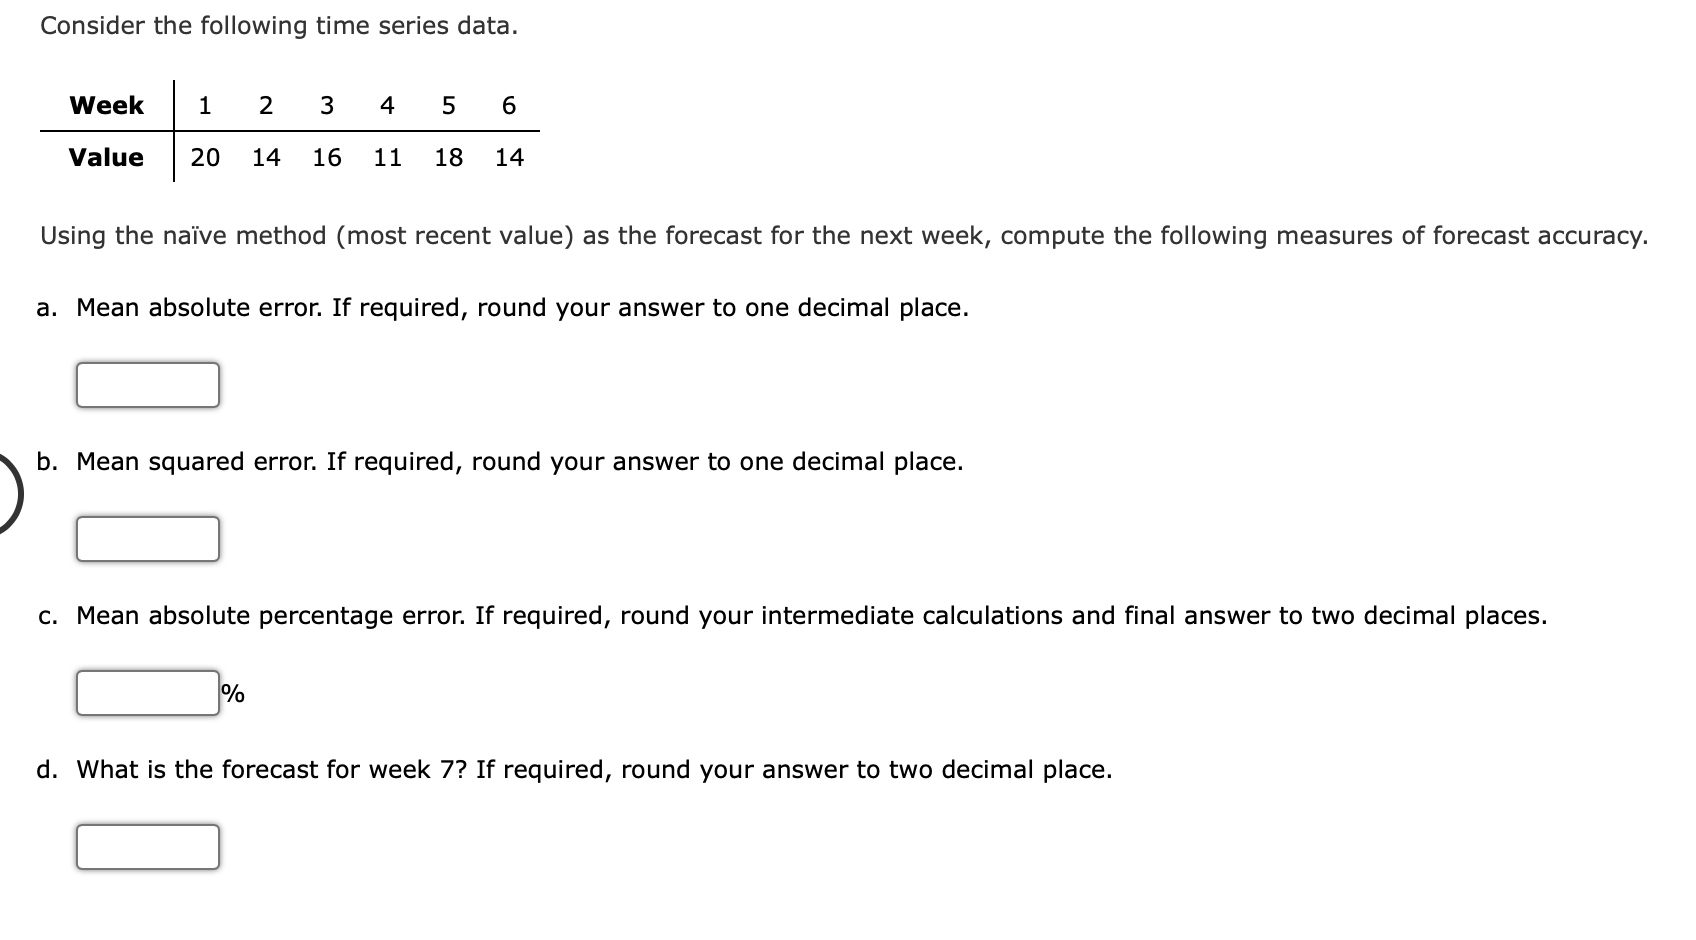
Refer to picture. Consider the following time series data. Week 1 2 3 4 5 6 Value 20 14 16 11 18 14 Using the
 Refer to picture.
Step by Step Solution
There are 3 Steps involved in it
Step: 1

Get Instant Access to Expert-Tailored Solutions
See step-by-step solutions with expert insights and AI powered tools for academic success
Step: 2

Step: 3
Ace Your Homework with AI
Get the answers you need in no time with our AI-driven, step-by-step assistance
Get Started
An Empire In Pawn Being Lectures And Essays On Indian Colonial And Domestic Finance Preference Free Trade Etc
Authors: A. J. (Alexander Johnstone) Wilson
1st Edition
1290631565, 9781290631563