

Question
Refer to the ( Al Anwar Ceramics) compute the following: CEL CEL (Common earnings leverage) = Net income - Preferred dividends / Net income +
Refer to the ( Al Anwar Ceramics) compute the following:
- CEL
CEL (Common earnings leverage) = Net income - Preferred dividends / Net income + ( 1 - ) x Interest expense + MI in earnings
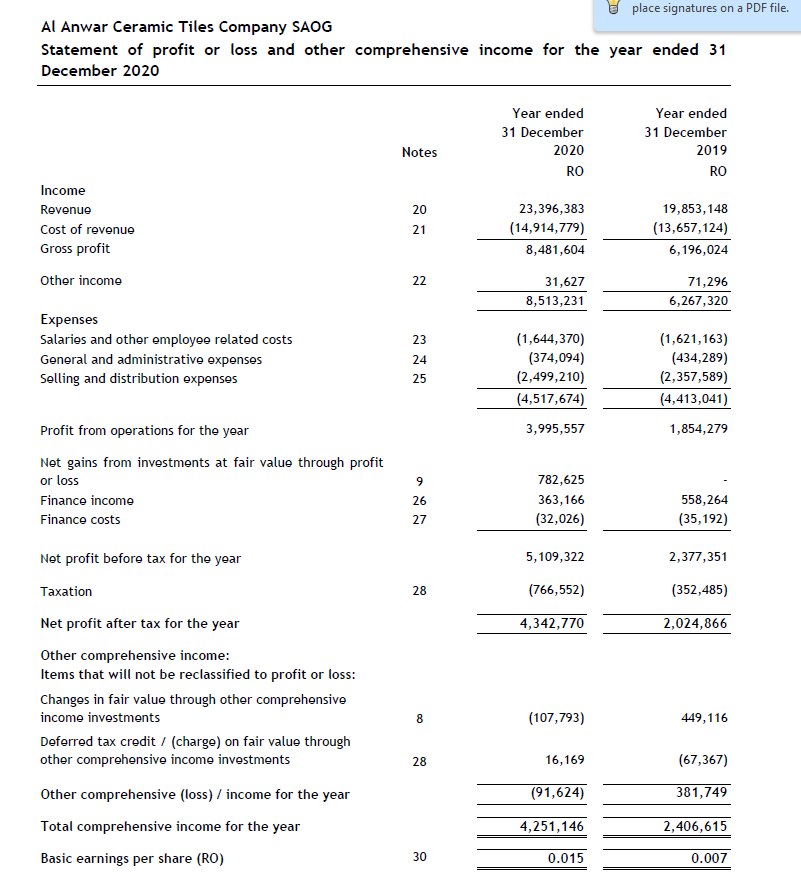
2. Earnings Per Share (EPS): (No need to compute, only mention the announced one in the Income statement)
3. Altmans Z-Score: (in the formula, set Market value/ Book value =1 if you dont find Market value)
(((( and please Check my answer )))
- ROCE
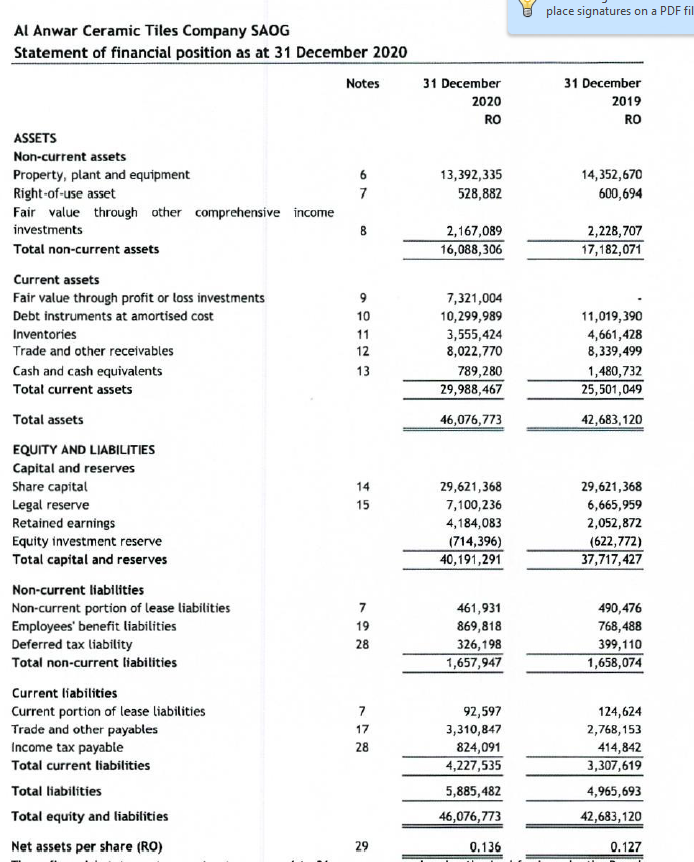
Return on Capital Employed (ROCE) = Net profit before tax / Capital Employed
Capital employed = Total assets - current liabilities
= $46,076,773 - $4,227,535 = $41,849,238
ROCE = 5,109,322 / 41,849,238
= 0.1220
= 12.20%
- CSL
Capital Structure Leverage (CSL) = Total asset / Share Capital
= $46,076,773 / $29,621,368 = 1.5555
- Current Ratio:
Current ratio = Current assets / current liabilities
= $29,988,467 / $4,227,535 = 7.0936
- Quick Ratio (Acid Test Ratio):
Quick Ratio = Current assets - inventory / current liabilities
= $26,433,043 / $4,227,535
= 6.2525
- Accounts Payable Turnover:
Accounts Payable Turnover: Purchase / average A/R
Purchase = cost of goods sold beginning inventory + ending inventory
= 14,914,779 - 4,661,428 + 3,555,424
= 13,608,775
A/P = 13,608,775 / { 2,768,153 + 3,310,847} / 2
= 4.47
- Interest Coverage Ratio:
Interest Coverage Ratio = Earnings before interest and tax / Interest expense
Earnings before interest and tax = Net Income + Tax + Interest
= 4,342,770 + 799,552 + 32,026
= 5,141,348
Interest coverage = Earnings before interest and tax (EBIT) / Interest
= 5,141,348 / 32,026
=160.53
- Long- Term Debt Ratio
Long- Term Debt Ratio = long term debt / Equity
= 461,931 + 869,818 / 29,621,368
=1,331,749 / 29,621,369
=0.0450
- Debt/ Equity Ratio:
Debt/ equity ratio = long term debt / shareholders equity
Debt/ equity ratio = long term liability / owners fund x100
2019 = 1,657,947 / 9,347,978 x 100 = 17.73
2020 = 1,658,074 / 3,566,455 x 100 = 46.49
Shareholders fund | owners fund
|
| 2019 | 2020 |
| Equity capital | 29,621,368 | 29,624,138 |
|
| 6,043,187 | 6,385,840 |
|
| - | - |
|
| 35,664,555 | 9,347,978 |
- Long- Term Debt to Assets Ratio:
L.T Debt to assets ratio = long term debt / total Assets x 100
2019 = 1658074 / 17182071 x 100 = 9.65
2020 = 1657947 / 16088366 x 100 = 10.31
place signatures on a PDF fil Al Anwar Ceramic Tiles Company SAOG Statement of financial position as at 31 December 2020 Notes 31 December 2020 31 December 2019 RO RO 6 7 13,392,335 528,882 14,352,670 600,694 8 2,167,089 16,088,306 2,228,707 17,182,071 ASSETS Non-current assets Property, plant and equipment Right-of-use asset Fair value through other comprehensive income investments Total non-current assets Current assets Fair value through profit or loss investments Debt instruments at amortised cost Inventories Trade and other receivables Cash and cash equivalents Total current assets 9 10 11 12 13 7,321,004 10,299,989 3,555,424 8,022,770 789,280 29,988,467 11,019,390 4,661,428 8,339,499 1,480,732 25,501,049 Total assets 46,076, 773 42,683, 120 14 15 29,621,368 7,100,236 4,184,083 (714,396) 40,191,291 29,621,368 6,665,959 2,052,872 (622,772) 37,717,427 EQUITY AND LIABILITIES Capital and reserves Share capital Legal reserve Retained earnings Equity investment reserve Total capital and reserves Non-current liabilities Non-current portion of lease liabilities Employees' benefit liabilities Deferred tax liability Total non-current liabilities Current liabilities Current portion of lease liabilities Trade and other payables Income tax payable Total current liabilities Total liabilities Total equity and liabilities Net assets per share (RO) 7 19 28 461,931 869,818 326, 198 1,657,947 490,476 768,488 399, 110 1,658,074 7 17 28 92,597 3,310,847 824,091 4,227,535 5,885,482 46,076,773 124,624 2,768,153 414,842 3,307,619 4,965,693 42,683,120 29 0.136 0.127 place signatures on a PDF file. Al Anwar Ceramic Tiles Company SAOG Statement of profit or loss and other comprehensive income for the year ended 31 December 2020 Year ended 31 December 2020 RO Year ended 31 December 2019 RO Notes Income Revenue Cost of revenue Gross profit 20 21 23,396,383 (14,914,779) 8,481,604 19,853,148 (13,657,124) 6,196,024 Other income 22 31,627 8,513,231 71,296 6,267,320 Expenses Salaries and other employee related costs General and administrative expenses Selling and distribution expenses 23 24 25 (1,644,370) (374,094) (2,499,210) (4,517,674) (1,621,163) (434,289) (2,357,589) (4,413,041) Profit from operations for the year 3,995,557 1,854,279 Net gains from investments at fair value through profit or loss Finance income Finance costs 9 26 27 782,625 363,166 (32,026) 558,264 (35,192) Net profit before tax for the year 5,109,322 2,377,351 Taxation 28 (766,552) (352,485) 4,342,770 2,024,866 Net profit after tax for the year Other comprehensive income: Items that will not be reclassified to profit or loss: Changes in fair value through other comprehensive income investments Deferred tax credit / (charge) on fair value through other comprehensive income investments 8 (107,793) 449,116 28 16,169 (67,367) (91,624) 381,749 Other comprehensive (loss) / income for the year Total comprehensive income for the year 4,251,146 2,406,615 Basic earnings per share (RO) 30 0.015 0.007 place signatures on a PDF fil Al Anwar Ceramic Tiles Company SAOG Statement of financial position as at 31 December 2020 Notes 31 December 2020 31 December 2019 RO RO 6 7 13,392,335 528,882 14,352,670 600,694 8 2,167,089 16,088,306 2,228,707 17,182,071 ASSETS Non-current assets Property, plant and equipment Right-of-use asset Fair value through other comprehensive income investments Total non-current assets Current assets Fair value through profit or loss investments Debt instruments at amortised cost Inventories Trade and other receivables Cash and cash equivalents Total current assets 9 10 11 12 13 7,321,004 10,299,989 3,555,424 8,022,770 789,280 29,988,467 11,019,390 4,661,428 8,339,499 1,480,732 25,501,049 Total assets 46,076, 773 42,683, 120 14 15 29,621,368 7,100,236 4,184,083 (714,396) 40,191,291 29,621,368 6,665,959 2,052,872 (622,772) 37,717,427 EQUITY AND LIABILITIES Capital and reserves Share capital Legal reserve Retained earnings Equity investment reserve Total capital and reserves Non-current liabilities Non-current portion of lease liabilities Employees' benefit liabilities Deferred tax liability Total non-current liabilities Current liabilities Current portion of lease liabilities Trade and other payables Income tax payable Total current liabilities Total liabilities Total equity and liabilities Net assets per share (RO) 7 19 28 461,931 869,818 326, 198 1,657,947 490,476 768,488 399, 110 1,658,074 7 17 28 92,597 3,310,847 824,091 4,227,535 5,885,482 46,076,773 124,624 2,768,153 414,842 3,307,619 4,965,693 42,683,120 29 0.136 0.127 place signatures on a PDF file. Al Anwar Ceramic Tiles Company SAOG Statement of profit or loss and other comprehensive income for the year ended 31 December 2020 Year ended 31 December 2020 RO Year ended 31 December 2019 RO Notes Income Revenue Cost of revenue Gross profit 20 21 23,396,383 (14,914,779) 8,481,604 19,853,148 (13,657,124) 6,196,024 Other income 22 31,627 8,513,231 71,296 6,267,320 Expenses Salaries and other employee related costs General and administrative expenses Selling and distribution expenses 23 24 25 (1,644,370) (374,094) (2,499,210) (4,517,674) (1,621,163) (434,289) (2,357,589) (4,413,041) Profit from operations for the year 3,995,557 1,854,279 Net gains from investments at fair value through profit or loss Finance income Finance costs 9 26 27 782,625 363,166 (32,026) 558,264 (35,192) Net profit before tax for the year 5,109,322 2,377,351 Taxation 28 (766,552) (352,485) 4,342,770 2,024,866 Net profit after tax for the year Other comprehensive income: Items that will not be reclassified to profit or loss: Changes in fair value through other comprehensive income investments Deferred tax credit / (charge) on fair value through other comprehensive income investments 8 (107,793) 449,116 28 16,169 (67,367) (91,624) 381,749 Other comprehensive (loss) / income for the year Total comprehensive income for the year 4,251,146 2,406,615 Basic earnings per share (RO) 30 0.015 0.007Step by Step Solution
There are 3 Steps involved in it
Step: 1

Get Instant Access to Expert-Tailored Solutions
See step-by-step solutions with expert insights and AI powered tools for academic success
Step: 2

Step: 3
Ace Your Homework with AI
Get the answers you need in no time with our AI-driven, step-by-step assistance
Get Started
Entrepreneurship In Finance Successfully Launching And Managing A Hedge Fund In Asia
Authors: Henri Arslanian
1st Edition
331943912X,3319439138