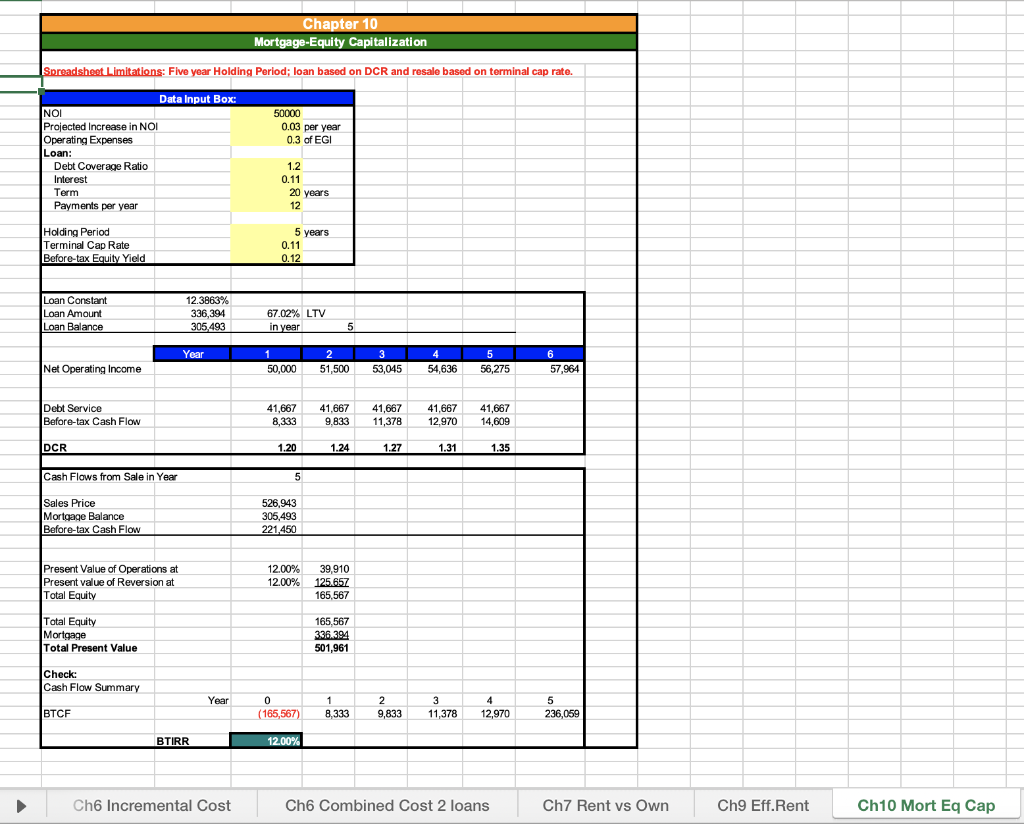
 Refer to the Ch10_Mort Eq Cap tab in the Excel Workbook provided on the website. This replicates the example discussed earlier. a. Suppose that there is an aggressive lender that is willing to allow the debt coverage ratio (DCR) to be as low as 1.0. Keep all other assumptions, including the loan interest rate and equity discount rate (before-tax equity yield), the same. How does this affect the amount that can be borrowed and the property value? b. Refer to part (a). Is it reasonable to assume that the loan interest rate and equity discount rate would be the same? If not, would you expect each to be higher or lower? Why?
Chapter 10 Mortgage-Equity Capitalization Spreadsheet Limitations: Five year Holding Period; loan based on DCR and resale based on terminal cap rate. 50000 0.03 per year 0.3 of EGI Data Input Box: NOI Projected Increase in NOI Operating Expenses Loan: Debt Coverage Ratio Interest Term Payments per year 1.2 0.11 20 years 12 Holding Period Terminal Cap Rate Before-tax Equity Yield 5 years 0.11 0.12 Loan Constant Loan Amount Loan Balance 12.3863% 336,394 305,493 67.02% LTV in year 5 Year 1 50,000 2 51,500 3 53,045 4 54,636 5 5 56,275 6 57,964 Net Operating Income Debt Service Before-tax Cash Flow 41,667 8,333 41,667 9.833 41,667 11,378 41,667 12,970 41,667 14,609 DCR 1.20 1.24 1.27 1.31 1.35 Cash Flows from Sale in Year 5 Sales Price Mortgage Balance Before-tax Cash Flow 526,943 305,493 221,450 Present Value of Operations at Present value of Reversion at Total Equity 12.00% 12.00% 39,910 125.657 165,567 Total Equity Mortgage Total Present Value 165,567 336.394 501,961 Check: Cash Flow Summary Year 0 0 (165,567) 1 8,333 2 9,833 3 3 11,378 BTCF 4 12,970 5 236,059 BTIRR 12.00% Ch6 Incremental Cost Ch6 Combined Cost 2 loans Ch7 Rent vs Own Ch9 Eff.Rent Ch10 Mort Eq Cap Chapter 10 Mortgage-Equity Capitalization Spreadsheet Limitations: Five year Holding Period; loan based on DCR and resale based on terminal cap rate. 50000 0.03 per year 0.3 of EGI Data Input Box: NOI Projected Increase in NOI Operating Expenses Loan: Debt Coverage Ratio Interest Term Payments per year 1.2 0.11 20 years 12 Holding Period Terminal Cap Rate Before-tax Equity Yield 5 years 0.11 0.12 Loan Constant Loan Amount Loan Balance 12.3863% 336,394 305,493 67.02% LTV in year 5 Year 1 50,000 2 51,500 3 53,045 4 54,636 5 5 56,275 6 57,964 Net Operating Income Debt Service Before-tax Cash Flow 41,667 8,333 41,667 9.833 41,667 11,378 41,667 12,970 41,667 14,609 DCR 1.20 1.24 1.27 1.31 1.35 Cash Flows from Sale in Year 5 Sales Price Mortgage Balance Before-tax Cash Flow 526,943 305,493 221,450 Present Value of Operations at Present value of Reversion at Total Equity 12.00% 12.00% 39,910 125.657 165,567 Total Equity Mortgage Total Present Value 165,567 336.394 501,961 Check: Cash Flow Summary Year 0 0 (165,567) 1 8,333 2 9,833 3 3 11,378 BTCF 4 12,970 5 236,059 BTIRR 12.00% Ch6 Incremental Cost Ch6 Combined Cost 2 loans Ch7 Rent vs Own Ch9 Eff.Rent Ch10 Mort Eq Cap
 Refer to the Ch10_Mort Eq Cap tab in the Excel Workbook provided on the website. This replicates the example discussed earlier. a. Suppose that there is an aggressive lender that is willing to allow the debt coverage ratio (DCR) to be as low as 1.0. Keep all other assumptions, including the loan interest rate and equity discount rate (before-tax equity yield), the same. How does this affect the amount that can be borrowed and the property value? b. Refer to part (a). Is it reasonable to assume that the loan interest rate and equity discount rate would be the same? If not, would you expect each to be higher or lower? Why?


