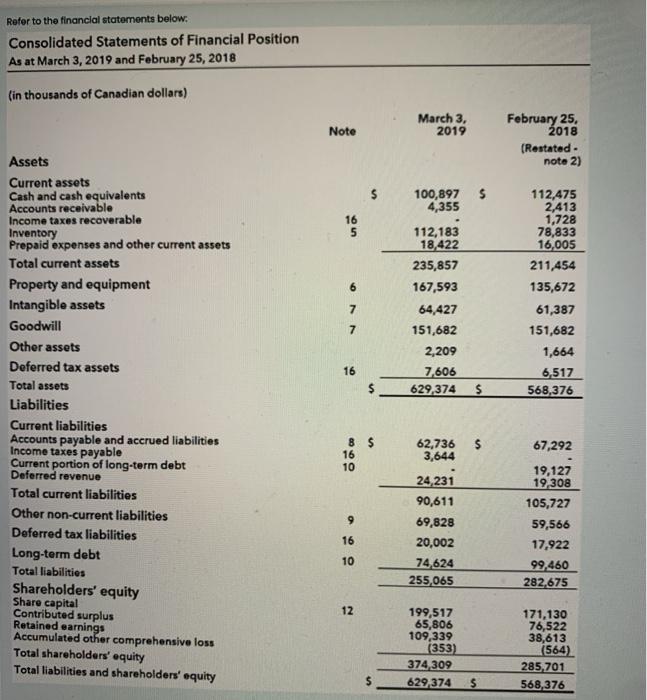
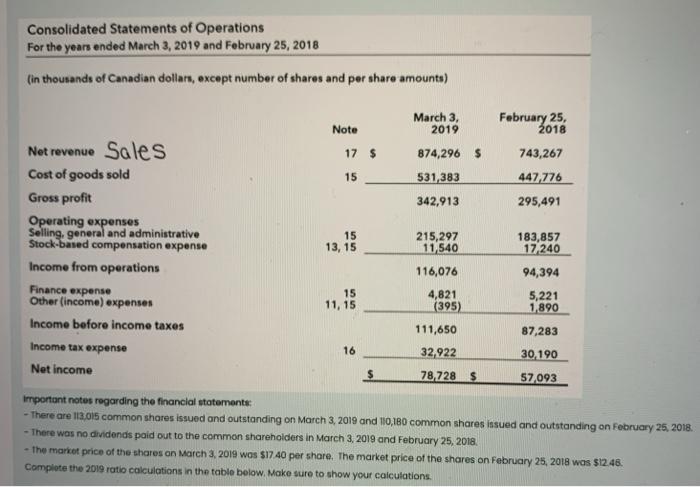
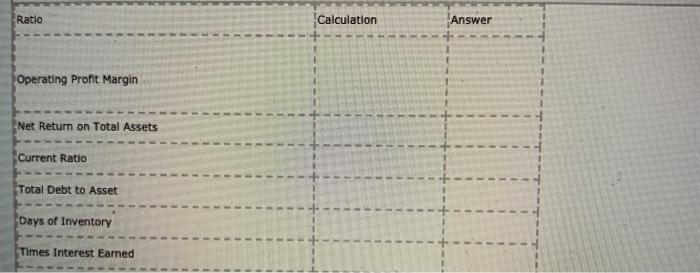
Refer to the financial statements below: Consolidated Statements of Financial Position As at March 3, 2019 and February 25, 2018 (in thousands of Canadian dollars) March 3, 2019 Note February 25, 2018 (Restated note 2) $ 100,897 4,355 16 5 6 112,475 2,413 1,728 78,833 16,005 211,454 135,672 61,387 151,682 1,664 6,517 568,376 112,183 18,422 235,857 167,593 64,427 151,682 2,209 7.606 629,374 7 7 16 $ $ Assets Current assets Cash and cash equivalents Accounts receivable Income taxes recoverable Inventory Prepaid expenses and other current assets Total current assets Property and equipment Intangible assets Goodwill Other assets Deferred tax assets Total assets Liabilities Current liabilities Accounts payable and accrued liabilities Income taxes payable Current portion of long-term debt Deferred revenue Total current liabilities Other non-current liabilities Deferred tax liabilities Long-term debt Total liabilities Shareholders' equity Share capital Contributed surplus Retained earnings Accumulated other comprehensive loss Total shareholders' equity Total liabilities and shareholders' equity 67,292 8 $ 16 10 62,736 3,644 24,231 90,611 69,828 20,002 74,624 255,065 9 19,127 19 308 105,727 59,566 17,922 99,460 282,675 16 10 12 199,517 65,806 109,339 (353) 374 309 629 374 171,130 76,522 38,613 (564) 285,701 568,376 $ Consolidated Statements of Operations For the year ended March 3, 2019 and February 25, 2018 (in thousands of Canadian dollars, except number of shares and per share amounts) March 3, 2019 February 25, 2018 Note 17 $ 743,267 874,296 $ 531,383 15 447 776 Net revenue Sales Cost of goods sold Gross profit Operating expenses Stock-based compensation expense Selling, general and administrative Income from operations 342,913 295,491 15 13, 15 215,297 11 540 183,857 17240 116,076 94,394 15 11,15 5,221 1,890 Finance expense Other (income) expenses Income before income taxes Income tax expense Net income 4,821 (395) 111,650 32,922 78 7285 16 87,283 30,190 57,093 Important notes regarding the financial statement - There are 113,015 common shares issued and outstanding on March 3, 2019 and 110,180 common shares insued and outstanding on February 25, 2018 - There was no dividends paid out to the common shareholders in March 3, 2019 and February 25, 2018 - the market price of the shares on March 3, 2019 was $17.40 per share. The market price of the shares on February 25, 2018 was $12.48. Complete the 2019 ratio calculations in the table below. Make sure to show your calculations. Ratio Calculation Answer Operating Profit Margin Net Return on Total Assets Current Ratio - Total Debt to Asset Days of Inventory - Times Interest Earned