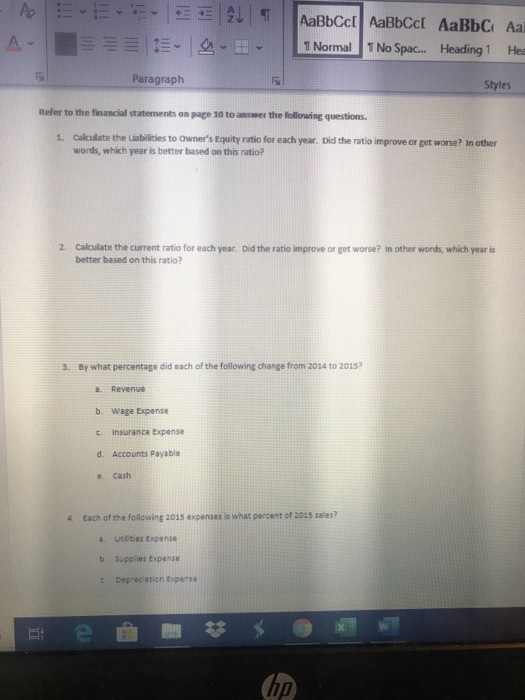
Refer to the financial statements to answer the following questions
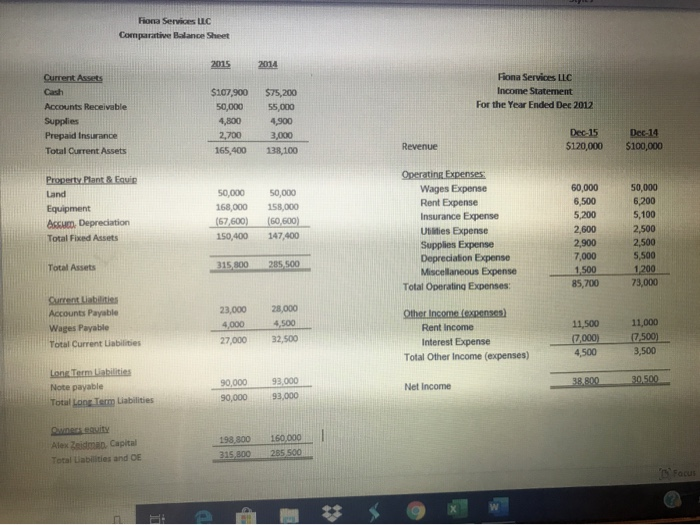
Fiona Services LLC Comparative Balance Sheet 2015 2014 Current Assets Fiona Services LLC Income Statement For the Year Ended Dec 2012 Accounts Receivable Supplies Prepaid Insurance Total Current Assets $107,900 50,000 4,800 2,700 165,400 $75,200 55,000 4,900 3,000 138,100 Dec-14 Revenue Dec 15 $120,000 $100,000 Property Plant & Equip Land Equipment Accue, Depreciation Total Fixed Assets 50,000 168,000 (67,600) 150,400 50,000 158,000 (60,600) 147,400 Operating Expenses Wages Expense Rent Expense Insurance Expense Utilities Expense Supplies Expense Depreciation Expense Miscellaneous Expense Total Operating Expenses 60,000 6,500 5,200 2,600 2,900 7,000 1500 85,700 50,000 6,200 5,100 2,500 2,500 5,500 1 200 73,000 Total Assets 315 800285,500 Current Liabilities Accounts Payable Wages Payable Total Current Liabilities 23,000 4,000 27,000 28,000 4.500 32,500 Other Income (expenses) Rent Income Interest Expense Total Other Income (expenses) 11,500 17 000) 4,500 11,000 17,500) 3,500 38,800 30.500 Long Term Liabilities Note payable Total Long Term Liabilities 90,000 90,000 93.000 93,000 Net Income Owners equity Alex Zeidman Capital Total abilities and DE 198,800 315.800 160,000 255 500 Focus MEE A- E AL S E AaBbCct AaBbCct AaBbci Aar 1 Normal 1 No Spac... Heading 1 Hea Paragraph Styles Refer to the financial statements on page 10 to answer the following questions. 1. Calculate the abilities to Owner's Equity ratio for each year. Did the ratio improve or get worse? In other words, which year is better based on this ratio? 2. Calculate the current ratio for each year. Did the ratio improve or get worse? In other words, which year is better based on this ratio? By what percentage did each of the following change from 2014 to 2015? a. Revenue b wage Expense C insurance Expense d. Accounts Payable e Cash 4. Each of the following 2015 experts is what percent of 2015 sales? Utilities Expande b Supplies Expense Depreciation Expense