Answered step by step
Verified Expert Solution
Question
1 Approved Answer
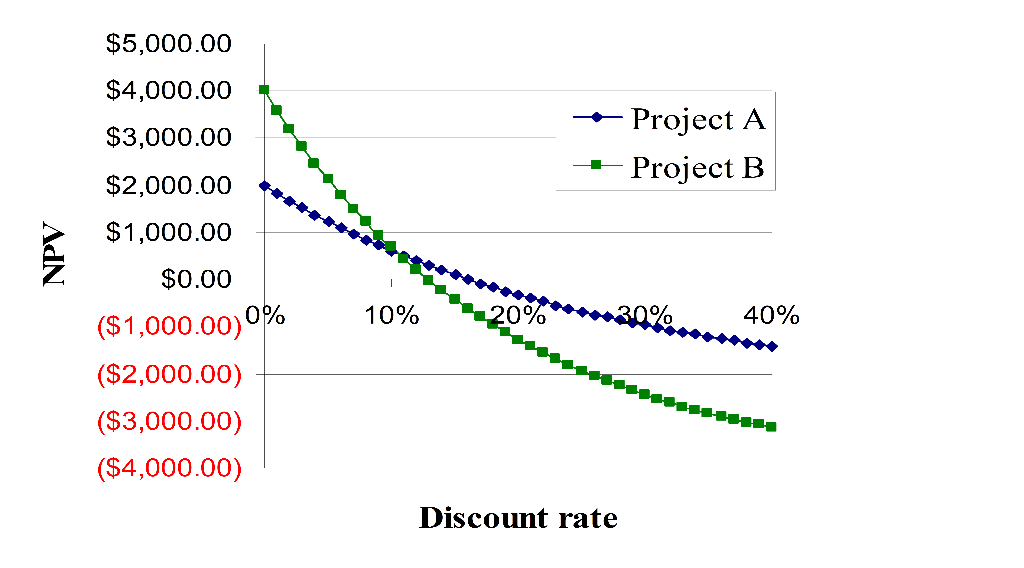
Refer to the graph of mutually exclusive projects shown above Kindly explain with reasoning the below a. At an 8% cost of capital, which project

Refer to the graph of mutually exclusive projects shown above Kindly explain with reasoning the below
a. At an 8% cost of capital, which project has a higher NPV?
b. Where on the graph would there be a conflict between the NPV and IRR methods? In other words, under what conditions would the NPV method tell you that project B is better and the IRR method tell you that project A is better?
c. What does the slope of these NPV profile curves tell us ?
.
+ Project A + Project B NPV $5,000.00 $4,000.00 $3,000.00 $2,000.00 $1,000.00 $0.00 ($1.000.000% ($2,000.00) ($3,000.00) ($4,000.00) 10% 20% 30% 40% Discount rateStep by Step Solution
There are 3 Steps involved in it
Step: 1

Get Instant Access to Expert-Tailored Solutions
See step-by-step solutions with expert insights and AI powered tools for academic success
Step: 2

Step: 3

Ace Your Homework with AI
Get the answers you need in no time with our AI-driven, step-by-step assistance
Get Started


