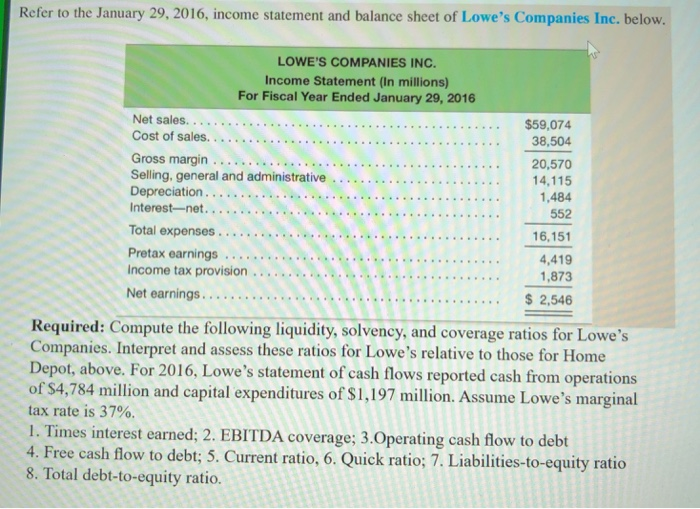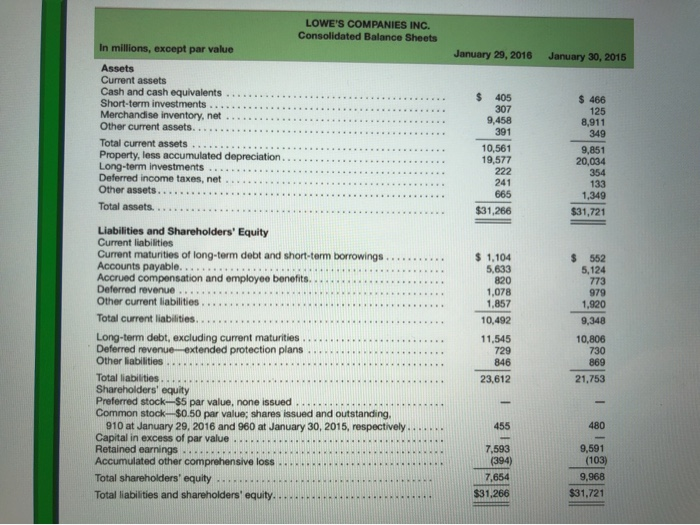
Refer to the January 29, 2016, income statement and balance sheet of Lowe's Companies Inc. below. LOWE'S COMPANIES INC. Income Statement (In millions) For Fiscal Year Ended January 29, 2016 Net sales.............................................. Cost of sales.................................. ... Gross margin ....................................... Selling, general and administrative Depreciation.. tion......................................... Interest-net........................................ Total expenses... Pretax earnings Income tax provision ... Net earnings $59,074 38,504 20,570 14,115 1,484 552 16.151 4,419 1,873 $ 2,546 Required: Compute the following liquidity, solvency, and coverage ratios for Lowe's Companies. Interpret and assess these ratios for Lowe's relative to those for Home Depot, above. For 2016, Lowe's statement of cash flows reported cash from operations of $4,784 million and capital expenditures of $1,197 million. Assume Lowe's marginal tax rate is 37%. 1. Times interest earned; 2. EBITDA coverage; 3.Operating cash flow to debt 4. Free cash flow to debt; 5. Current ratio, 6. Quick ratio; 7. Liabilities-to-equity ratio 8. Total debt-to-equity ratio. LOWE'S COMPANIES INC. Consolidated Balance Sheets In millions, except par value January 29, 2016 January 30, 2015 Assets Current assets Cash and cash equivalents. Short-term investments .... Merchandise inventory, net. Other current assets..... Total current assets ........... Property, less accumulated depreciation Long-term investments .... Deferred income taxes, net... Other assets... Total assets..... $ 405 307 9,458 391 10,561 19,577 222 $ 466 125 8.911 349 9.851 20,034 354 133 1.349 241 665 $31,266 $31,721 $ 552 5,124 773 $ 1,104 5,633 820 1,078 1,857 10,492 11,545 729 Liabilities and Shareholders' Equity Current liabilities Current maturities of long-term debt and short-term borrowings.. Accounts payable... Accrued compensation and employee benefits. Deferred revenue.... Other current liabilities Total current liabilities. Long-term debt, excluding current maturities .. Deferred revenue-extended protection plans. Other liabilities. Total liabilities Shareholders' equity Preferred stock-$5 par value, none issued Common stock $0.50 par value;shares issued and outstanding, 910 at January 29, 2016 and 960 at January 30, 2015, respectively Capital in excess of par value ... Retained earnings ............ Accumulated other comprehensive loss Total shareholders' equity Total liabilities and shareholders' equity..... 979 1,920 9,348 10,806 730 869 21,753 846 23,612 455 480 7,593 (394) 7,654 $31,266 9,591 (103) 9,968 $31.721


