

Question
Refer to the Mini-S&P contract in Figure 22.1. Assume the closing price for this day. a. If the margin requirement is 30% of the futures
Refer to the Mini-S&P contract in Figure 22.1. Assume the closing price for this day.
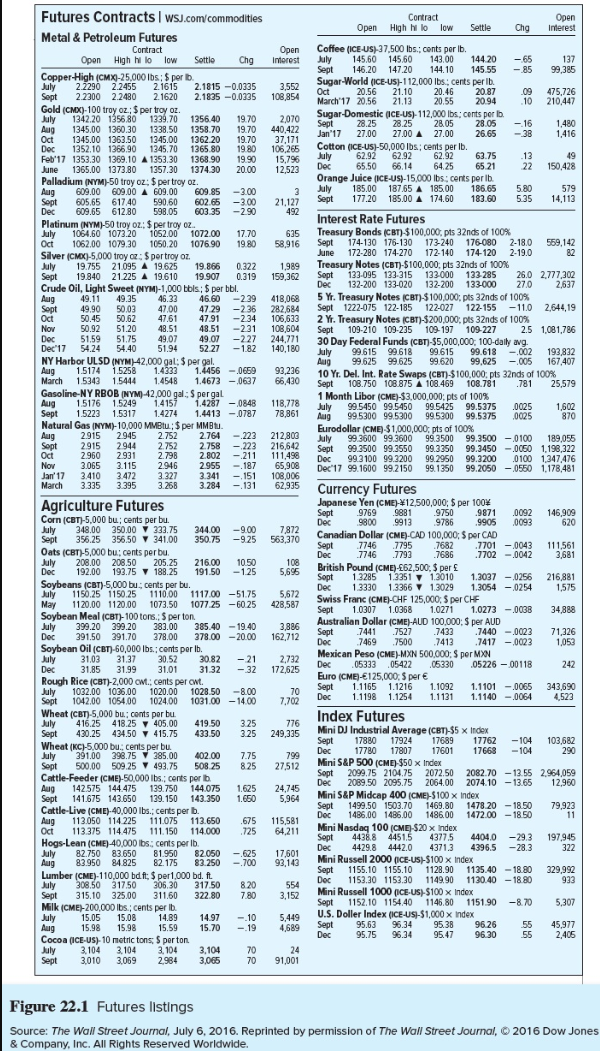
a. If the margin requirement is 30% of the futures price times the contract multiplier of $50, how much must you deposit with your broker to trade the September maturity contract? (Round your answer to 2 decimal places.)
b. If the September futures price were to increase to 2,089.73, what percentage return would you earn on your net investment if you entered the long side of the contract at the price shown in the figure? (Do not round intermediate calculations. Round your answer to 2 decimal places.)
c. If the September futures price falls by 1%, what is your percentage return? (Negative amount should be indicated by a minus sign. Round your answer to 2 decimal places.)
Open Futures Contracts I wsj.com/commodities Metal & Petroleum Futures Open Contract High hilo low Settle Chg interest Open interest - 65 -85 99,385 3,552 108,854 .09 10 475,726 210,447 Coffee (ICE-US)-37,500 lbs.: cents per lb. July 145.60 145.50 143.00 144 20 Sept 146.20 147.20 144.10 145.55 Sugar-World (ICE-US)-112,000 lbs.: cents per lb. Oct 20.56 21.10 20.46 20.87 March 17 20.56 21.13 20.55 20.94 Sugar Domestic (ICE-US)-112,000 lbs: cents per lb. Sept 28.25 28.25 28.05 28.05 Jan'17 27.00 27.00 A 27.00 26.65 Cotton (ICE-US)-50,000 lbs: cents per lb. July 62.92 62.92 62.92 63.75 Dec 65.50 66.14 64.25 65.21 Orange Juice (ICE-US)-15.000 lbs.: cents per lb. July 185.00 187.65 A 185.00 186.65 Sept 177.20 185.00 A 174.60 183.60 -16 -38 2070 4 40.422 37,171 105.265 15.796 12,523 1,480 1,416 us .13 22 49 150,428 c ents 36. 5.80 5.35 579 14,113 21,127 492 625 58,916 Contract Open High hilo low Sottle Chg Copper High (CMX)-25,000 lbs: $ per lb. July 2.2290 2.2455 2.1615 2.1815 -0.0335 Sept 2.2300 2.2480 2.1620 2 .1835 -0.0335 Gold (CMX)-100 tray oz: $ per troy oz. July 1342.201356 80 1334.70 1356 40 19.70 Aug 1345.00 1360.30 1338.50 1358.70 19.70 Oct 1345.00 1363.50 1345.00 1362.20 19.70 Doc 1352.10 1366 90 1345.70 1365.80 1980 Feb 17 1353.30 1369,10 A 1353.30 1368 90 19.90 June 1365.00 1373.80 1357.30 1374.30 20.00 Palladium (NYM)-50 troy oz: $ per troy oz. Aug 609.00 609.00 A 609.00 609.85 -2.00 Sept 605,65 617.40 590 60 602 65 -3.00 Dec 609.65 612.80 598.05 603.35 -2.90 Platinum (NYM)-50 troy oz: $ per troy oz. July 1064.60 1073.20 1052.00 1072.00 17.70 Oct 1062.00 1079.30 1050.20 1076.90 19.80 Silver (CMX)-5,000 troy oz: Sper troy oz. 19.755 21.095 A 19.625 19.866 0.322 Sept 19.840 21.225 A 19.610 19.907 0.319 Crude Oil, Light Sweet (NYM)-1,000 tbls: $ per bbl. Aug 49.11 49.25 46.22 46.60 -2.29 49.90 50.03 47,00 47.29 -236 Oct 50.45 50.62 47.61 47.91 -2 34 Now 50.92 51.20 48.51 48.51 -231 Doc 51.59 51.75 49.07 49.07 - 227 Dec 17 54.24 54.40 51.94 52.27 -1.82 NY Harbor ULSD (NYM)-42,000 gal: $ per gal. Aug 1.5174 1.5258 1.4223 1.4456 -0659 March 1.5343 1.5444 1.4548 1.4673 - 0637 Gasoline-NY RBOBNYM) -42,000 gal: S pergal Aug 15176 1.5249 14157 1.4287 -0842 Sept 1.5223 1.53171.4274 1.4413 -.0787 Natural Gas (NYM)-10,000 MMBtu: $ per MMBtu. Aug 2.915 2.945 2.752 2.764 -223 Sept 2915 2944 2752 2.758 - 222 2960 2931 2.798 2.802 - 211 Now 3.065 3.115 2 946 2955 -187 Jan'17 3.410 3.472 3.327 3.341 - 151 March 3,335 3.395 3.268 3.284 - 131 My 1,989 159,362 418,068 282.684 106,633 108,604 244.771 140,180 Interest Rate Futures Treasury Bonds (CBT) $100.000 pts 32nds of 100% Sept 174-130 176-130 173-240 176-0802-18.0 559,142 June 172-280 174-270 172-140 174-1202-19.0 82 Treasury Notes (CBT)-$100,000, pts 32nds of 100% Sept 133-095 133 315 133.000 133 285 26.0 2.777,302 Dec 132-200 133-020 132-200 133.000 27.0 2,637 5 Yr. Treasury Notes (CBT) $100,000, pts 32nds of 100% Sept 1222-075 122-185 122-027 122-155 -110 2,644,19 2 Yr. Treasury Notes (CBT)-$200,000: pts 32nds of 100% Sept 109-210 109-235 109-197 109 227 2.5 1,081,786 30 Day Federal Funds (CBT)-$5,000,000, 100-daily avg. July 99.615 99.618 99.615 99.618 -002 193,832 Aug 99.625 99.625 99.620 99,625 -005 167,407 10 Yr. Del. Int. Rate Swaps (CBT)-$100,000 pts 32nds of 100% Sept 108.750 108.875 108.469 108.781 781 25.579 1 Month Libor (CME)-$3,000,000: pts of 100% July 99.5450 99.5450 99.5425 99.5375 .0025 1,602 Aug 99.5300 99.5300 99.5300 99.5375 0025 870 Eurodollar (CME) $1,000,000: pts of 100% July 99.3600 99.3600 99.3500 99.3500 -.0100 189,055 Sept 99.3500 99.3550 99.3350 99.3450 -0050 1.198,322 Dec 99.3100 99.3200 99.2950 99.3200 .0100 1,347,476 Dec 17 99.1600 99.2150 99.1350 99.2050 -0550 1.178,481 93.236 66,430 118.778 78,861 Oct 212,803 216.642 111.496 65.908 108,006 62.935 -9.00 7,872 -925563,370 108 10.50 -1.25 5,695 -51.75 5.672 -6025428,587 Currency Futures Japanese Yen (CME) 12,500,000; $ per 100% Sept 9769 9881 9750 9871 .0092 146,909 Dec 9800 9913 9786 9 905 .0093 620 Canadian Dollar (CME)-CAD 100,000; $ per CAD Sept 7745 7795 7682 7701 - 0043 111.561 Dec 7746 7793 .7686 7702 - 0042 3 ,681 British Pound (CME)-E62,500 $ per Sopt 1.3285 13351 7130101.2037 -0256 216.881 Dec 13330 1.3366 1.3029 1.3054 -.0254 1,575 Swiss Franc (CME)-CHF 125,000, 5 per CHF Sept 1.0307 1.0368 1.0271 1.0273 -0038 Australian Dollar (CME)-AUD 100,000: $ per AUD Sept 7441 7527 .7433 .7440 -.0023 7 1,326 Doc 7469 .7500 74137417 - 00231053 Mexican Peso (CME)-MXN 500,000: $ per MXN Dec 05333 05422 05330 .05226 - 00118 242 Euro (CME)-125,000: $ per Sept 1.1165 1.1216 1.1092 1.1101 -0065 343,690 Dec 1.1198 1.1254 1.1131 1.1140 - 0064 4,523 -19.40 - 20.00 3,886 162,712 -21 -32 2.732 172,625 -8.00 - 14.00 70 7.702 Agriculture Futures Corn (CBT)-5,000 bu; cents per bu. July 348.00 350.00 333.75 344.00 Sept 356.25 356.50 341.00 350.75 Oats (CBT)-5,000 bu, cents per bu. July 208.00 208.50 205.25 216.00 Dec 192.00 193.75 188.25 191.50 Soybeans (CBT)-5,000 bu., cents per bu. July 1150.25 1150.25 111000 111700 May 1120.00 1120.00 1073.50 1077 25 Soybean Meal (CBT)-100 tons.: $ perton July 399.20 399.20 383.00 385.40 Dec 391.50 391.70 378.00 378.00 Soybean Oil (CBT)-60,000 lbs.; cents per lb. July 31.03 31.37 30.52 30.82 Dec 31.85 31.99 31.01 31.32 Rough Rice (CBT)-2,000 wt., cents per cwt. July 1032.00 1035.00 1020.00 1028.50 Sopt 1042.00 1054.00 1024.00 1031.00 Wheat (CBT)-5,000 bu; conts per bu. July 416.25 418.25 7405.00 419.50 Sept 430.25 434.50 415.75 4 33.50 Wheat (KC) 5,000 bu., cents per bu. July 391.00 398,75 385.00 402.00 Sept 500.00 509.25 493.75 508.25 Cattle-Feeder (CME)-50,000 lbs., cents per lb. Aug 142575 144.475 139.750 144.075 Sept 141.675 143.650 139.150 143.350 Cattle-Live (CME) 40,000 lbs., cents per b. Aug 113.050 114 225 111075 112 650 Oct 113 375 114.475 111.150 114.000 Hogs-Lean (CME)-40,000 lbs: cents per lb. July 82.750 83.650 81.950 82.050 Aug 83.950 84 825 82 17582.250 Lumber (CME)-110,000 bd.ft: $ per1,000 bd. ft. July 308,50 31750 306 30 31750 Sept 315.10 325.00 311.60 322.80 Milk (CME)-200,000 lbs., cents per lb. July 15.05 15.08 14.89 14.97 Aug 15.98 15.98 15.59 15.70 Cocoa (ICE-US)-10 metric tons: Sperton July 3.104 3.104 3.104 3.104 Sept 3.010 3.069 2,984 3,065 3.25 3.25 776 249,335 -104 -104 103,682 290 7.75 825 799 27.512 - 13.55 - 13.65 2.964,059 12,960 1.625 1.650 24,745 5,964 -18.50 - 18.50 79.923 11 675 725 115. 581 64,211 Index Futures Mini DJ Industrial Average (CBT)-5 x Index Sept 17880 179241768917762 Dec 17780 17807 17601 17668 Mini S&P 500 (CME) $50 x Index Sept 2099.75 2104.75 2072.50 2082.70 Dec 2089.50 2095.75 2064.00 2074.10 Mini S&P Midcap 400 (CME-S100 x Index Sept 1499.50 1503.70 1469.80 147820 Doc 1486.00 1486.00 1486.00 1472.00 Mini Nasdaq 100 (CME)-$20 x Index Sept 44388 4451.5 43775 44040 Dec 4429.8 4442.0 43713 4 396.5 Mini Russell 2000 (ICE-US-$100 x Index Sept 1155.10 1155,10 1128.90 1135.40 Dec 1153.30 1153.30 1149.90 1130.40 Mini Russell 1000 (ICE-US)-$100 x Index Sept 1152.10 1154.40 1146.80 1151.90 U.S. Doller Index (ICE-US-$1,000 x Index Sept 95.63 96.34 95.38 96.26 Dec 95.7596.34 95.47 96.30 -293197.945 -28.3 17501 - 625 - 700 93.143 329.992 -18.80 -18.80 820 7.80 554 3,152 -8.70 5,307 -10 - 19 4 5.449 ,689 5 5 55 45,977 2,405 70 70 24 91,001 Figure 22.1 Futures listings Source: The Wall Street Journal, July 6, 2016. Reprinted by permission of The Wall Street Journal, & Company, Inc. All Rights Reserved Worldwide. 2016 Dow Jones Open Futures Contracts I wsj.com/commodities Metal & Petroleum Futures Open Contract High hilo low Settle Chg interest Open interest - 65 -85 99,385 3,552 108,854 .09 10 475,726 210,447 Coffee (ICE-US)-37,500 lbs.: cents per lb. July 145.60 145.50 143.00 144 20 Sept 146.20 147.20 144.10 145.55 Sugar-World (ICE-US)-112,000 lbs.: cents per lb. Oct 20.56 21.10 20.46 20.87 March 17 20.56 21.13 20.55 20.94 Sugar Domestic (ICE-US)-112,000 lbs: cents per lb. Sept 28.25 28.25 28.05 28.05 Jan'17 27.00 27.00 A 27.00 26.65 Cotton (ICE-US)-50,000 lbs: cents per lb. July 62.92 62.92 62.92 63.75 Dec 65.50 66.14 64.25 65.21 Orange Juice (ICE-US)-15.000 lbs.: cents per lb. July 185.00 187.65 A 185.00 186.65 Sept 177.20 185.00 A 174.60 183.60 -16 -38 2070 4 40.422 37,171 105.265 15.796 12,523 1,480 1,416 us .13 22 49 150,428 c ents 36. 5.80 5.35 579 14,113 21,127 492 625 58,916 Contract Open High hilo low Sottle Chg Copper High (CMX)-25,000 lbs: $ per lb. July 2.2290 2.2455 2.1615 2.1815 -0.0335 Sept 2.2300 2.2480 2.1620 2 .1835 -0.0335 Gold (CMX)-100 tray oz: $ per troy oz. July 1342.201356 80 1334.70 1356 40 19.70 Aug 1345.00 1360.30 1338.50 1358.70 19.70 Oct 1345.00 1363.50 1345.00 1362.20 19.70 Doc 1352.10 1366 90 1345.70 1365.80 1980 Feb 17 1353.30 1369,10 A 1353.30 1368 90 19.90 June 1365.00 1373.80 1357.30 1374.30 20.00 Palladium (NYM)-50 troy oz: $ per troy oz. Aug 609.00 609.00 A 609.00 609.85 -2.00 Sept 605,65 617.40 590 60 602 65 -3.00 Dec 609.65 612.80 598.05 603.35 -2.90 Platinum (NYM)-50 troy oz: $ per troy oz. July 1064.60 1073.20 1052.00 1072.00 17.70 Oct 1062.00 1079.30 1050.20 1076.90 19.80 Silver (CMX)-5,000 troy oz: Sper troy oz. 19.755 21.095 A 19.625 19.866 0.322 Sept 19.840 21.225 A 19.610 19.907 0.319 Crude Oil, Light Sweet (NYM)-1,000 tbls: $ per bbl. Aug 49.11 49.25 46.22 46.60 -2.29 49.90 50.03 47,00 47.29 -236 Oct 50.45 50.62 47.61 47.91 -2 34 Now 50.92 51.20 48.51 48.51 -231 Doc 51.59 51.75 49.07 49.07 - 227 Dec 17 54.24 54.40 51.94 52.27 -1.82 NY Harbor ULSD (NYM)-42,000 gal: $ per gal. Aug 1.5174 1.5258 1.4223 1.4456 -0659 March 1.5343 1.5444 1.4548 1.4673 - 0637 Gasoline-NY RBOBNYM) -42,000 gal: S pergal Aug 15176 1.5249 14157 1.4287 -0842 Sept 1.5223 1.53171.4274 1.4413 -.0787 Natural Gas (NYM)-10,000 MMBtu: $ per MMBtu. Aug 2.915 2.945 2.752 2.764 -223 Sept 2915 2944 2752 2.758 - 222 2960 2931 2.798 2.802 - 211 Now 3.065 3.115 2 946 2955 -187 Jan'17 3.410 3.472 3.327 3.341 - 151 March 3,335 3.395 3.268 3.284 - 131 My 1,989 159,362 418,068 282.684 106,633 108,604 244.771 140,180 Interest Rate Futures Treasury Bonds (CBT) $100.000 pts 32nds of 100% Sept 174-130 176-130 173-240 176-0802-18.0 559,142 June 172-280 174-270 172-140 174-1202-19.0 82 Treasury Notes (CBT)-$100,000, pts 32nds of 100% Sept 133-095 133 315 133.000 133 285 26.0 2.777,302 Dec 132-200 133-020 132-200 133.000 27.0 2,637 5 Yr. Treasury Notes (CBT) $100,000, pts 32nds of 100% Sept 1222-075 122-185 122-027 122-155 -110 2,644,19 2 Yr. Treasury Notes (CBT)-$200,000: pts 32nds of 100% Sept 109-210 109-235 109-197 109 227 2.5 1,081,786 30 Day Federal Funds (CBT)-$5,000,000, 100-daily avg. July 99.615 99.618 99.615 99.618 -002 193,832 Aug 99.625 99.625 99.620 99,625 -005 167,407 10 Yr. Del. Int. Rate Swaps (CBT)-$100,000 pts 32nds of 100% Sept 108.750 108.875 108.469 108.781 781 25.579 1 Month Libor (CME)-$3,000,000: pts of 100% July 99.5450 99.5450 99.5425 99.5375 .0025 1,602 Aug 99.5300 99.5300 99.5300 99.5375 0025 870 Eurodollar (CME) $1,000,000: pts of 100% July 99.3600 99.3600 99.3500 99.3500 -.0100 189,055 Sept 99.3500 99.3550 99.3350 99.3450 -0050 1.198,322 Dec 99.3100 99.3200 99.2950 99.3200 .0100 1,347,476 Dec 17 99.1600 99.2150 99.1350 99.2050 -0550 1.178,481 93.236 66,430 118.778 78,861 Oct 212,803 216.642 111.496 65.908 108,006 62.935 -9.00 7,872 -925563,370 108 10.50 -1.25 5,695 -51.75 5.672 -6025428,587 Currency Futures Japanese Yen (CME) 12,500,000; $ per 100% Sept 9769 9881 9750 9871 .0092 146,909 Dec 9800 9913 9786 9 905 .0093 620 Canadian Dollar (CME)-CAD 100,000; $ per CAD Sept 7745 7795 7682 7701 - 0043 111.561 Dec 7746 7793 .7686 7702 - 0042 3 ,681 British Pound (CME)-E62,500 $ per Sopt 1.3285 13351 7130101.2037 -0256 216.881 Dec 13330 1.3366 1.3029 1.3054 -.0254 1,575 Swiss Franc (CME)-CHF 125,000, 5 per CHF Sept 1.0307 1.0368 1.0271 1.0273 -0038 Australian Dollar (CME)-AUD 100,000: $ per AUD Sept 7441 7527 .7433 .7440 -.0023 7 1,326 Doc 7469 .7500 74137417 - 00231053 Mexican Peso (CME)-MXN 500,000: $ per MXN Dec 05333 05422 05330 .05226 - 00118 242 Euro (CME)-125,000: $ per Sept 1.1165 1.1216 1.1092 1.1101 -0065 343,690 Dec 1.1198 1.1254 1.1131 1.1140 - 0064 4,523 -19.40 - 20.00 3,886 162,712 -21 -32 2.732 172,625 -8.00 - 14.00 70 7.702 Agriculture Futures Corn (CBT)-5,000 bu; cents per bu. July 348.00 350.00 333.75 344.00 Sept 356.25 356.50 341.00 350.75 Oats (CBT)-5,000 bu, cents per bu. July 208.00 208.50 205.25 216.00 Dec 192.00 193.75 188.25 191.50 Soybeans (CBT)-5,000 bu., cents per bu. July 1150.25 1150.25 111000 111700 May 1120.00 1120.00 1073.50 1077 25 Soybean Meal (CBT)-100 tons.: $ perton July 399.20 399.20 383.00 385.40 Dec 391.50 391.70 378.00 378.00 Soybean Oil (CBT)-60,000 lbs.; cents per lb. July 31.03 31.37 30.52 30.82 Dec 31.85 31.99 31.01 31.32 Rough Rice (CBT)-2,000 wt., cents per cwt. July 1032.00 1035.00 1020.00 1028.50 Sopt 1042.00 1054.00 1024.00 1031.00 Wheat (CBT)-5,000 bu; conts per bu. July 416.25 418.25 7405.00 419.50 Sept 430.25 434.50 415.75 4 33.50 Wheat (KC) 5,000 bu., cents per bu. July 391.00 398,75 385.00 402.00 Sept 500.00 509.25 493.75 508.25 Cattle-Feeder (CME)-50,000 lbs., cents per lb. Aug 142575 144.475 139.750 144.075 Sept 141.675 143.650 139.150 143.350 Cattle-Live (CME) 40,000 lbs., cents per b. Aug 113.050 114 225 111075 112 650 Oct 113 375 114.475 111.150 114.000 Hogs-Lean (CME)-40,000 lbs: cents per lb. July 82.750 83.650 81.950 82.050 Aug 83.950 84 825 82 17582.250 Lumber (CME)-110,000 bd.ft: $ per1,000 bd. ft. July 308,50 31750 306 30 31750 Sept 315.10 325.00 311.60 322.80 Milk (CME)-200,000 lbs., cents per lb. July 15.05 15.08 14.89 14.97 Aug 15.98 15.98 15.59 15.70 Cocoa (ICE-US)-10 metric tons: Sperton July 3.104 3.104 3.104 3.104 Sept 3.010 3.069 2,984 3,065 3.25 3.25 776 249,335 -104 -104 103,682 290 7.75 825 799 27.512 - 13.55 - 13.65 2.964,059 12,960 1.625 1.650 24,745 5,964 -18.50 - 18.50 79.923 11 675 725 115. 581 64,211 Index Futures Mini DJ Industrial Average (CBT)-5 x Index Sept 17880 179241768917762 Dec 17780 17807 17601 17668 Mini S&P 500 (CME) $50 x Index Sept 2099.75 2104.75 2072.50 2082.70 Dec 2089.50 2095.75 2064.00 2074.10 Mini S&P Midcap 400 (CME-S100 x Index Sept 1499.50 1503.70 1469.80 147820 Doc 1486.00 1486.00 1486.00 1472.00 Mini Nasdaq 100 (CME)-$20 x Index Sept 44388 4451.5 43775 44040 Dec 4429.8 4442.0 43713 4 396.5 Mini Russell 2000 (ICE-US-$100 x Index Sept 1155.10 1155,10 1128.90 1135.40 Dec 1153.30 1153.30 1149.90 1130.40 Mini Russell 1000 (ICE-US)-$100 x Index Sept 1152.10 1154.40 1146.80 1151.90 U.S. Doller Index (ICE-US-$1,000 x Index Sept 95.63 96.34 95.38 96.26 Dec 95.7596.34 95.47 96.30 -293197.945 -28.3 17501 - 625 - 700 93.143 329.992 -18.80 -18.80 820 7.80 554 3,152 -8.70 5,307 -10 - 19 4 5.449 ,689 5 5 55 45,977 2,405 70 70 24 91,001 Figure 22.1 Futures listings Source: The Wall Street Journal, July 6, 2016. Reprinted by permission of The Wall Street Journal, & Company, Inc. All Rights Reserved Worldwide. 2016 Dow JonesStep by Step Solution
There are 3 Steps involved in it
Step: 1

Get Instant Access to Expert-Tailored Solutions
See step-by-step solutions with expert insights and AI powered tools for academic success
Step: 2

Step: 3
Ace Your Homework with AI
Get the answers you need in no time with our AI-driven, step-by-step assistance
Get Started
Handbook Of Digital Currency Bitcoin Innovation Financial Instruments And Big Data
Authors: David Lee Kuo Chuen
1st Edition
0128021179, 978-0128021170