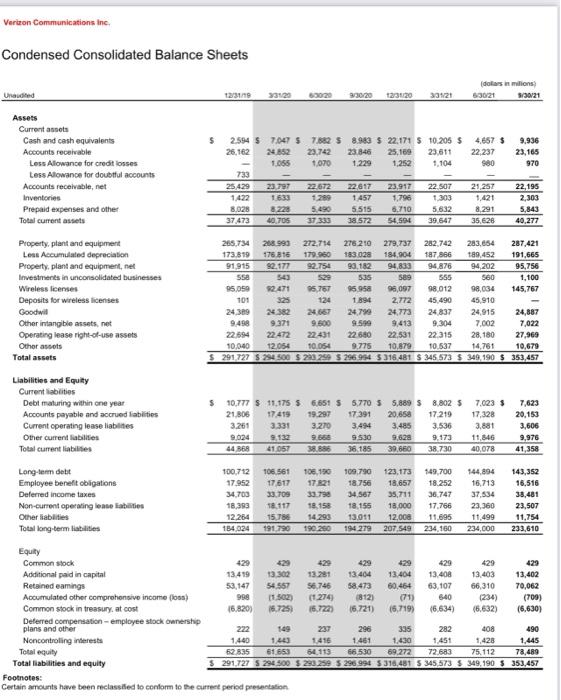
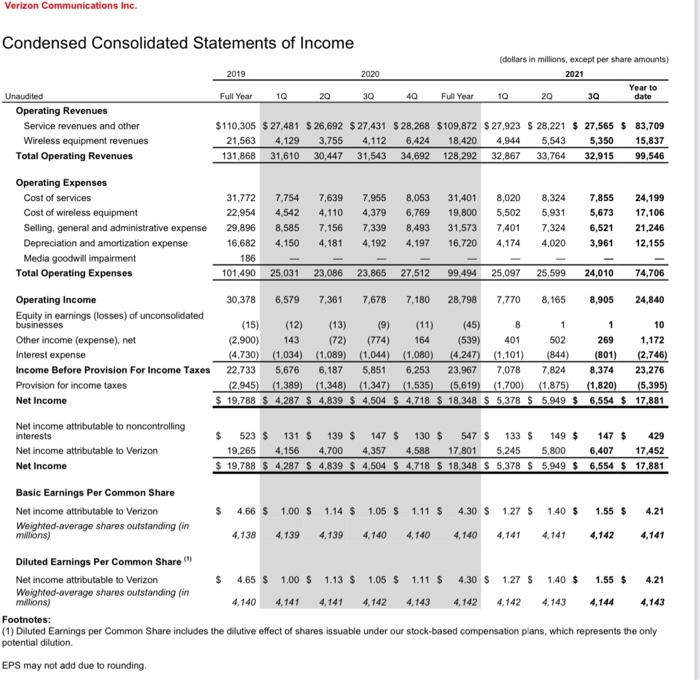
Refer to the (Verizon) companys financial statements and accompanying notes to answer the following questions.
- Of the companys provision for income taxes, what portion is current expense and what portion is deferred expense?
- For the year end, what amounts were reported by the company as (1) deferred tax assets and (2) deferred tax liabilities?
Verizon Communications in Condensed Consolidated Balance Sheets dolars i milions 53021 5/30/21 Una die 12/31/10 33120 69020 3/30/20 123120 33121 $ 4.657 $ 22,237 980 9,936 23,165 970 Assets Current assets Cash and cash equivalents Accounts receivable Less Allowance for credit losses Less Allowance for doubtful accounts Accounts receivable, net Inventories Prepaid expenses and other Total current assets 2.594 $ 7.047 $ 7.582 58.983 $ 22.171 5 10.205 $ 26,162 24852 23,742 23.846 25,169 23.611 1.055 1.070 1.229 1.252 1.104 733 25 429 23797 22.672 22617 23,917 22 507 1422 1.633 1.289 1457 1,798 1.303 8.028 8228 5.490 5.515 6.710 5832 37.473 40.705 38.572 54.594 39.647 21,257 1,421 8,291 35.628 22,195 2,303 5.843 40,277 Property, plant and equipment Loss Accumulated depreciation Property, plant and equipment, net Investments in unconsolidated businesses Wireless licenses Deposits for wireless licenses Goodwill Other intangible assets, net Operating lease right-of-use assets Other assets Total assets 265.734 208.990 272.714 278.210 279.737 282.742 283.654 287,421 173.819 176.818 179.950 183.028 184.904 187 966 189,452 191,665 91.915 92.977 92.754 90.182 94,833 94,876 94,202 95,756 ssa 543 529 535 589 555 560 1,100 95.050 52.471 96,767 $5.950 98,097 98.012 98,034 145,767 101 325 124 1.894 2.772 45.490 45,910 2439 24.382 24790 24,773 24 837 24.915 24,887 9.498 9.371 9.500 9:59 9,413 9.304 7.002 7,022 22.594 22472 22431 22680 22,531 22315 28.180 27,965 10.040 12.054 10.054 9.775 10,879 10.537 14,761 10.679 S291,727 S 28500 $ 220299 296.994 5 316 481 S 345 573 $ 349,190 $ 353,457 Liabilities and Equity Current liabilities Debt maturing within one year Accounts payable and accrued liabilities Current operating lease liabilities Other current liabilities Total current liabilities $10,777 $ 11,175 5 6.651 S 5.770 S 5,889 S 8.8025 21.306 17.419 19.297 17.391 20,658 17.219 3.261 3.331 3.270 3.4 3,485 3,536 9.024 9.133 9.668 9.530 9,628 9.173 44 868 41.057 36.185 39.660 38.730 7.623 3 17,328 3,881 11,846 40,078 7,623 20,150 3,606 9,976 41,358 Long-term debit Employee benefit obligations Deferred income taxes Non-current operating lease abilities Other liabilities Total long term liabilities 100,712 17.952 34.700 18,393 12.284 184024 106 561 17617 33.709 18.117 15.788 191.796 108,190 1721 33.790 18.158 14 293 190 200 109.790 18.756 34567 18.155 13.011 194.279 123,173 18,657 35,711 18,000 12.008 207.549 149,700 18.252 36.747 17.766 11.695 234,160 144,894 16,713 37.534 23,360 11,499 234,000 143,352 16,516 38,481 23,507 11.754 233,610 Equity Common stock 429 429 429 429 429 429 429 429 Additional paid in capital 13 419 13.302 13.281 13 404 13.404 13.408 13.403 13,402 Retained eamings 53.147 54 557 56.746 58,473 60,464 63.107 66,310 70,062 Accumulated other comprehensive income (109) 998 [5.502) (1274) 812) (71) 640 (234) (700) Common stock in treasury at cost 16.820) 16.7253 16.7223 16,721) 15.719) (6.634) (6.632) (6,630) Deferred compensation - employee stock ownership plans and other 222 149 287 296 335 282 408 490 Noncontrolling interest 1440 1416 1.461 1.430 1,428 1,445 Total equily 52.835 61 653 64,113 66530 69.272 72.683 75. 112 78,489 Total liabilities and equity S291.727 S 288.500 $ 288 289 290 994 310.481 S 345573 5 349.1905 353.457 Footnotes: Certain amounts have been reclassified to conform to the current period presentation 1451 Verizon Communications Inc. Condensed Consolidated Statements of Income date 5,350 - (dollars in millions, except per share amounts) 2019 2020 2021 Year to Unaudited Full Year 30 40 Full Year 10 20 30 Operating Revenues Service revenues and other $110,305 $ 27.481 S 26,692 $ 27.431 $ 28,268 $109,872 $ 27,923 $ 28,221 $ 27,565 $ 83,709 Wireless equipment revenues 21,563 4,129 3,755 4,112 6,424 18,420 4,944 5,543 15,837 Total Operating Revenues 131,868 31.610 30,447 31.543 34,692 128.292 32.867 33.764 32,915 99,546 Operating Expenses Cost of services 31,772 7,754 7.639 7.955 8,053 31,401 8,020 8,324 7.855 24,199 Cost of wireless equipment 22,954 4,542 4,110 4,379 6,769 19,800 5,502 5,931 5,673 17,106 Selling, general and administrative expense 29.896 8,585 7,156 7,339 8,493 31,573 7,401 7.324 6,521 21,246 Depreciation and amortization expense 16.682 4,150 4,181 4,192 4.197 16,720 4.174 4,020 3,961 12,155 Media goodwill impairment 186 Total Operating Expenses 101,490 25.031 23,086 23.865 27,512 99,494 25,097 25,599 24,010 74,706 Operating Income 30,378 6,579 7,361 7,678 7.180 28,798 7.770 8,165 8,905 24,840 Equity in earnings (losses) of unconsolidated businesses (15) (12) (13) (9) (11) (45) 8 1 1 10 Other income (expense), net (2.900) 143 (72) (774) 164 (539) 401 502 269 1,172 Interest expense (4.730) (1.034) (1,089) (1.044) (1.080) (4.247) (1.101) (844) (801) (2.746) Income Before Provision For Income Taxes 22.733 5,676 6,187 5,851 6,253 23,967 7,078 7,824 8,374 23,276 Provision for income taxes (2.945) (1.389) (1,348) (1.347) (1,535) (5,619) (1.700) (1,875) (1,820) (5,395) Net Income $ 19.788 S 4.287 $ 4,839 $ 4,504 S 4.718 S 18,348 S 5,378 $ 5.949 $ 6,554 S 17,881 Net income attributable to noncontrolling interests $ 523 $ 131 $ 139 $ 147 $ 130 $ 547 $ 133 $ 149 $ 147 $ 429 Net income attributable to Verizon 19,265 4,156 4,700 4,357 4,588 17.801 5,245 5,800 6,407 17,452 Net Income $ 19,788 $ 4.287 S 4,839 $ 4,504 S 4.718 S 18.348 S 5,378 S 5.949 $ 6,554 $ 17,881 Basic Earnings Per Common Share Net income attributable to Verizon $ 4.66 $ 1.00 $ 1.14 $ 1.05 $ 1.11 $ 4.30 $ 1.27 $ 1.40 $ 1.55 $ 4.21 Weighted average shares outstanding (in millions) 4,138 4,139 4.139 4.140 4.140 4,140 4,141 4.141 4.142 4.21 Diluted Earnings Per Common Share Net income attributable to Verizon $ 4.65 $ 1.00 $ 1.13 $ 1.05 $ 1.11 $ 4.30 $ 1.27 $ 1.40 $ 1.55 $ Weighted-average shares outstanding (in millions) 4.140 4,141 4,141 4.142 4.143 4.142 4.142 4.143 4,144 4.143 Footnotes: (1) Diluted Earnings per Common Share includes the dilutive effect of shares issuable under our stock-based compensation plans, which represents the only potential dilution EPS may not add due to rounding, Verizon Communications in Condensed Consolidated Balance Sheets dolars i milions 53021 5/30/21 Una die 12/31/10 33120 69020 3/30/20 123120 33121 $ 4.657 $ 22,237 980 9,936 23,165 970 Assets Current assets Cash and cash equivalents Accounts receivable Less Allowance for credit losses Less Allowance for doubtful accounts Accounts receivable, net Inventories Prepaid expenses and other Total current assets 2.594 $ 7.047 $ 7.582 58.983 $ 22.171 5 10.205 $ 26,162 24852 23,742 23.846 25,169 23.611 1.055 1.070 1.229 1.252 1.104 733 25 429 23797 22.672 22617 23,917 22 507 1422 1.633 1.289 1457 1,798 1.303 8.028 8228 5.490 5.515 6.710 5832 37.473 40.705 38.572 54.594 39.647 21,257 1,421 8,291 35.628 22,195 2,303 5.843 40,277 Property, plant and equipment Loss Accumulated depreciation Property, plant and equipment, net Investments in unconsolidated businesses Wireless licenses Deposits for wireless licenses Goodwill Other intangible assets, net Operating lease right-of-use assets Other assets Total assets 265.734 208.990 272.714 278.210 279.737 282.742 283.654 287,421 173.819 176.818 179.950 183.028 184.904 187 966 189,452 191,665 91.915 92.977 92.754 90.182 94,833 94,876 94,202 95,756 ssa 543 529 535 589 555 560 1,100 95.050 52.471 96,767 $5.950 98,097 98.012 98,034 145,767 101 325 124 1.894 2.772 45.490 45,910 2439 24.382 24790 24,773 24 837 24.915 24,887 9.498 9.371 9.500 9:59 9,413 9.304 7.002 7,022 22.594 22472 22431 22680 22,531 22315 28.180 27,965 10.040 12.054 10.054 9.775 10,879 10.537 14,761 10.679 S291,727 S 28500 $ 220299 296.994 5 316 481 S 345 573 $ 349,190 $ 353,457 Liabilities and Equity Current liabilities Debt maturing within one year Accounts payable and accrued liabilities Current operating lease liabilities Other current liabilities Total current liabilities $10,777 $ 11,175 5 6.651 S 5.770 S 5,889 S 8.8025 21.306 17.419 19.297 17.391 20,658 17.219 3.261 3.331 3.270 3.4 3,485 3,536 9.024 9.133 9.668 9.530 9,628 9.173 44 868 41.057 36.185 39.660 38.730 7.623 3 17,328 3,881 11,846 40,078 7,623 20,150 3,606 9,976 41,358 Long-term debit Employee benefit obligations Deferred income taxes Non-current operating lease abilities Other liabilities Total long term liabilities 100,712 17.952 34.700 18,393 12.284 184024 106 561 17617 33.709 18.117 15.788 191.796 108,190 1721 33.790 18.158 14 293 190 200 109.790 18.756 34567 18.155 13.011 194.279 123,173 18,657 35,711 18,000 12.008 207.549 149,700 18.252 36.747 17.766 11.695 234,160 144,894 16,713 37.534 23,360 11,499 234,000 143,352 16,516 38,481 23,507 11.754 233,610 Equity Common stock 429 429 429 429 429 429 429 429 Additional paid in capital 13 419 13.302 13.281 13 404 13.404 13.408 13.403 13,402 Retained eamings 53.147 54 557 56.746 58,473 60,464 63.107 66,310 70,062 Accumulated other comprehensive income (109) 998 [5.502) (1274) 812) (71) 640 (234) (700) Common stock in treasury at cost 16.820) 16.7253 16.7223 16,721) 15.719) (6.634) (6.632) (6,630) Deferred compensation - employee stock ownership plans and other 222 149 287 296 335 282 408 490 Noncontrolling interest 1440 1416 1.461 1.430 1,428 1,445 Total equily 52.835 61 653 64,113 66530 69.272 72.683 75. 112 78,489 Total liabilities and equity S291.727 S 288.500 $ 288 289 290 994 310.481 S 345573 5 349.1905 353.457 Footnotes: Certain amounts have been reclassified to conform to the current period presentation 1451 Verizon Communications Inc. Condensed Consolidated Statements of Income date 5,350 - (dollars in millions, except per share amounts) 2019 2020 2021 Year to Unaudited Full Year 30 40 Full Year 10 20 30 Operating Revenues Service revenues and other $110,305 $ 27.481 S 26,692 $ 27.431 $ 28,268 $109,872 $ 27,923 $ 28,221 $ 27,565 $ 83,709 Wireless equipment revenues 21,563 4,129 3,755 4,112 6,424 18,420 4,944 5,543 15,837 Total Operating Revenues 131,868 31.610 30,447 31.543 34,692 128.292 32.867 33.764 32,915 99,546 Operating Expenses Cost of services 31,772 7,754 7.639 7.955 8,053 31,401 8,020 8,324 7.855 24,199 Cost of wireless equipment 22,954 4,542 4,110 4,379 6,769 19,800 5,502 5,931 5,673 17,106 Selling, general and administrative expense 29.896 8,585 7,156 7,339 8,493 31,573 7,401 7.324 6,521 21,246 Depreciation and amortization expense 16.682 4,150 4,181 4,192 4.197 16,720 4.174 4,020 3,961 12,155 Media goodwill impairment 186 Total Operating Expenses 101,490 25.031 23,086 23.865 27,512 99,494 25,097 25,599 24,010 74,706 Operating Income 30,378 6,579 7,361 7,678 7.180 28,798 7.770 8,165 8,905 24,840 Equity in earnings (losses) of unconsolidated businesses (15) (12) (13) (9) (11) (45) 8 1 1 10 Other income (expense), net (2.900) 143 (72) (774) 164 (539) 401 502 269 1,172 Interest expense (4.730) (1.034) (1,089) (1.044) (1.080) (4.247) (1.101) (844) (801) (2.746) Income Before Provision For Income Taxes 22.733 5,676 6,187 5,851 6,253 23,967 7,078 7,824 8,374 23,276 Provision for income taxes (2.945) (1.389) (1,348) (1.347) (1,535) (5,619) (1.700) (1,875) (1,820) (5,395) Net Income $ 19.788 S 4.287 $ 4,839 $ 4,504 S 4.718 S 18,348 S 5,378 $ 5.949 $ 6,554 S 17,881 Net income attributable to noncontrolling interests $ 523 $ 131 $ 139 $ 147 $ 130 $ 547 $ 133 $ 149 $ 147 $ 429 Net income attributable to Verizon 19,265 4,156 4,700 4,357 4,588 17.801 5,245 5,800 6,407 17,452 Net Income $ 19,788 $ 4.287 S 4,839 $ 4,504 S 4.718 S 18.348 S 5,378 S 5.949 $ 6,554 $ 17,881 Basic Earnings Per Common Share Net income attributable to Verizon $ 4.66 $ 1.00 $ 1.14 $ 1.05 $ 1.11 $ 4.30 $ 1.27 $ 1.40 $ 1.55 $ 4.21 Weighted average shares outstanding (in millions) 4,138 4,139 4.139 4.140 4.140 4,140 4,141 4.141 4.142 4.21 Diluted Earnings Per Common Share Net income attributable to Verizon $ 4.65 $ 1.00 $ 1.13 $ 1.05 $ 1.11 $ 4.30 $ 1.27 $ 1.40 $ 1.55 $ Weighted-average shares outstanding (in millions) 4.140 4,141 4,141 4.142 4.143 4.142 4.142 4.143 4,144 4.143 Footnotes: (1) Diluted Earnings per Common Share includes the dilutive effect of shares issuable under our stock-based compensation plans, which represents the only potential dilution EPS may not add due to rounding


