

Question
Refer to this Figure and answer the following questions: Explain for each. I. The figure represents: downward sloping demand curves indifference curves where utility is
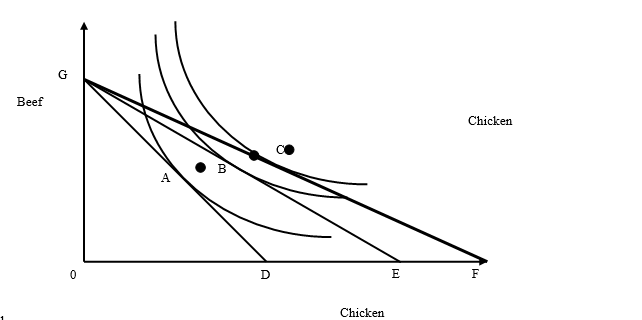
Refer to this Figure and answer the following questions: Explain for each.
I. The figure represents:
- downward sloping demand curves
- indifference curves where utility is constant
- marginal utility curves, relating beef to chicken
- total utility curves relating income to chicken
II. Line GD represents which of the following:
- the consumer's indifference curve
- the consumer's budget constraint.
- the prices of beef and chicken
- the supply of beef and chicken
III. A shift of the line GD to GE indicates which of the following:
- the price of chicken has fallen
- the price of chicken has risen
- the price of beef has risen
- Can't say
IV. A movement of an Individual from Point A to Point C implies:
- The consumer is consuming more of beef and chicken
- The consumer is at a higher level of satisfaction
- The consumer is consuming less of beef and chicken
- Both a and b
Step by Step Solution
There are 3 Steps involved in it
Step: 1

Get Instant Access to Expert-Tailored Solutions
See step-by-step solutions with expert insights and AI powered tools for academic success
Step: 2

Step: 3
Ace Your Homework with AI
Get the answers you need in no time with our AI-driven, step-by-step assistance
Get Started
Strategic Management And Business Policy Toward Global Sustainability
Authors: Thomas L. Wheelen, J. David Hunger
13th Edition
9780132998079, 132998076, 978-0132153225