Question
Reference: Survey of Accounting 6th edition You will be working through the two years of Milavec Financial Statements provided in this project assignment sheet from
Reference: Survey of Accounting 6th edition
You will be working through the two years of Milavec Financial Statements provided in this project assignment sheet from (POV) Investors considering investing $100,000, who will more purchase Preferred Stock, 6%, $100 par You should should produce
A visually appealing summary that presents your conclusions and provides easy-to understand analytics to support your conclusion.
Supplemental work to provide the supporting calculations/computations and descriptions of your analysis. Using the Investor POV I would recommend "yes, invest" or "no, do not invest?
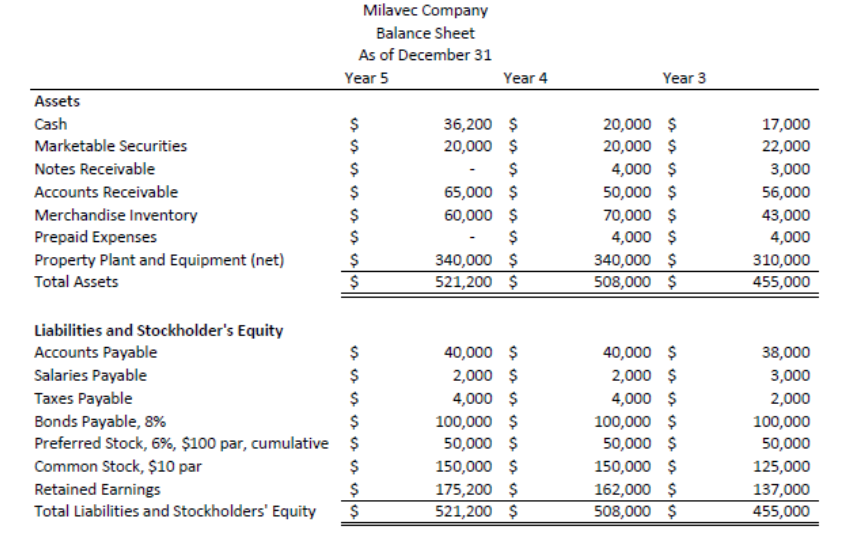
What is year 3 and year 4 Ratios base on the Milavec Company?
Debt to asset ratio: Total liabilities/total Equity=
Current Ratio: Current Assets/Current Liabilities=
Quick Ratio: Quick Assets/Current Liabilities=
Return on Investment: Net Income/Average Total Assets=
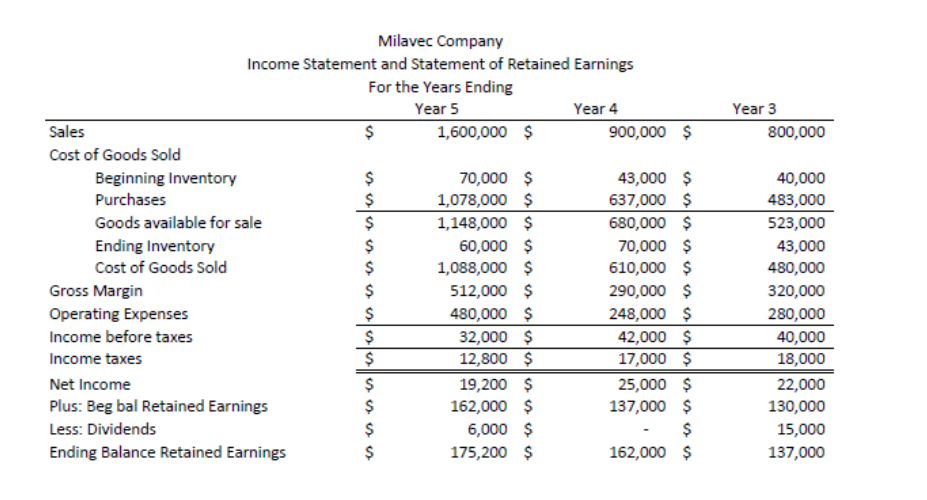
Year 3 800,000 Milavec Company Income Statement and Statement of Retained Earnings For the Years Ending Year 5 Year 4 Sales $ 1,600,000 $ 900,000 $ Cost of Goods Sold Beginning Inventory $ 70,000 $ 43,000 $ Purchases $ 1,078,000 $ 637,000 $ Goods available for sale $ 1,148,000 $ 680,000 $ Ending Inventory $ 60,000 $ 70,000 $ Cost of Goods Sold $ 1,088,000 $ 610,000 $ Gross Margin $ 512,000 $ 290,000 $ Operating Expenses $ 480,000 $ 248,000 $ Income before taxes $ 32,000 $ 42,000 $ Income taxes $ 12,800 $ 17,000 $ Net Income $ 19,200 $ 25,000 $ Plus: Beg bal Retained Earnings $ 162,000 $ 137,000 $ Less: Dividends $ 6,000 $ $ Ending Balance Retained Earnings $ 175,200 $ 162,000 $ | || 40,000 483,000 523,000 43,000 480,000 320,000 280,000 40,000 18,000 22,000 130,000 15,000 137,000 Milavec Company Balance Sheet As of December 31 Year 5 Year 4 Year 3 Assets Cash Marketable Securities Notes Receivable Accounts Receivable Merchandise Inventory Prepaid Expenses Property Plant and Equipment (net) Total Assets $ $ $ $ $ $ $ $ 36,200 $ 20,000 $ $ 65,000 $ 60,000 $ $ 340,000 $ 521,200 $ 20,000 $ 20,000 $ 4,000 $ 50,000 $ 70,000 $ 4,000 $ 340,000 $ 508,000 $ 17,000 22,000 3,000 56,000 43,000 4,000 310,000 455,000 Liabilities and Stockholder's Equity Accounts Payable $ Salaries Payable $ Taxes Payable $ Bonds Payable, 8% $ Preferred Stock, 6%, $100 par, cumulative $ Common Stock, $10 par $ Retained Earnings $ Total Liabilities and Stockholders' Equity $ 40,000 $ 2,000 $ 4,000 $ 100,000 $ 50,000 $ 150,000 $ 175,200 $ 521,200 $ 40,000 $ 2,000 $ 4,000 $ 100,000 $ 50,000 $ 150,000 $ 162,000 $ 508,000 $ 38,000 3,000 2,000 100,000 50,000 125,000 137,000 455,000
Step by Step Solution
There are 3 Steps involved in it
Step: 1
Get Instant Access to Expert-Tailored Solutions
See step-by-step solutions with expert insights and AI powered tools for academic success
Step: 2
Step: 3
Ace Your Homework with AI
Get the answers you need in no time with our AI-driven, step-by-step assistance
Get Started