

Reference the following case study to assess the following questions: How was the lean effort at the
Fantastic news! We've Found the answer you've been seeking!
Question:
Reference the following case study to assess the following questions:
How was the lean effort at the financial services firm structured organizationally?
What role did the Kaizen event play in improving the way that the project was structured?
After the team had narrowed the focus to nine "quick hit" projects, what were the most significant results (outline for four of the projects)? Which lean tools may/could have been used in order to realize these results?
Transcribed Image Text:
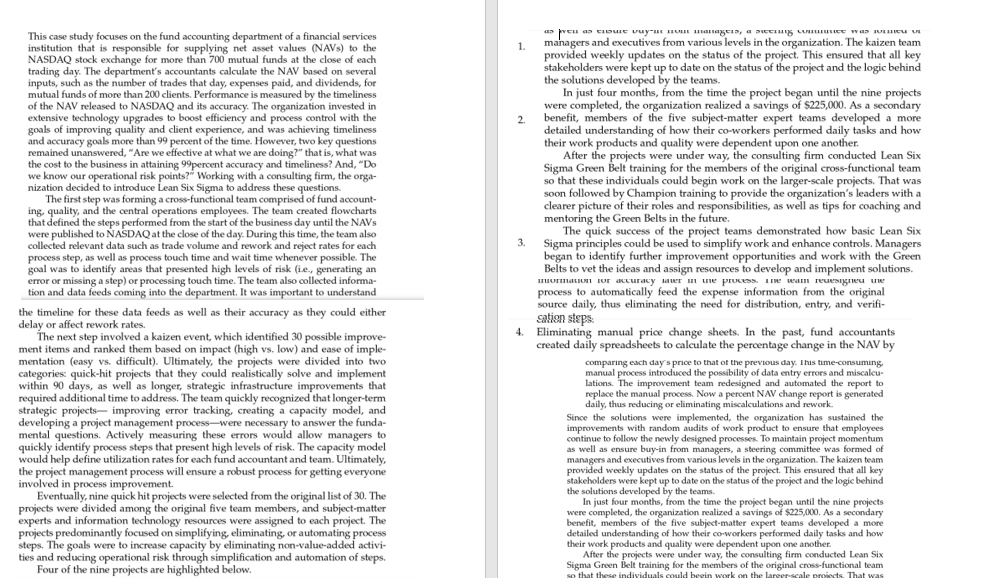
This case study focuses on the fund accounting department of a financial services institution that is responsible for supplying net asset values (NAVs) to the NASDAQ stock exchange for more than 700 mutual funds at the close of each trading day. The department's accountants calculate the NAV based on several inputs, such as the number of trades that day, expenses paid, and dividends, for mutual funds of more than 200 clients. Performance is measured by the timeliness of the NAV released to NASDAQ and its accuracy. The organization invested in extensive technology upgrades to boost efficiency and process control with the goals of improving quality and client experience, and was achieving timeliness and accuracy goals more than 99 percent of the time. However, two key questions remained unanswered, "Are we effective at what we are doing?" that is, what was the cost to the business in attaining 99percent accuracy and timeliness? And, "Do we know our operational risk points?" Working with a consulting firm, the orga- nization decided to introduce Lean Six Sigma to address these questions. The first step was forming a cross-functional team comprised of fund account- ing, quality, and the central operations employees. The team created flowcharts that defined the steps performed from the start of the business day until the NAVs were published to NASDAQ at the close of the day. During this time, the team also collected relevant data such as trade volume and rework and reject rates for each process step, as well as process touch time and wait time whenever possible. The goal was to identify areas that presented high levels of risk (ie., generating an error or missing a step) or processing touch time. The team also collected informa- tion and data feeds coming into the department. It was important to understand the timeline for these data feeds as well as their accuracy as they could either delay or affect rework rates. The next step involved a kaizen event, which identified 30 possible improve- ment items and ranked them based on impact (high vs. low) and ease of imple- mentation (easy vs. difficult). Ultimately, the projects were divided into two categories: quick-hit projects that they could realistically solve and implement within 90 days, as well as longer, strategic infrastructure improvements that required additional time to address. The team quickly recognized that longer-term strategic projects improving error tracking, creating a capacity model, and developing a project management process-were necessary to answer the funda- mental questions. Actively measuring these errors would allow managers to quickly identify process steps that present high levels of risk. The capacity model would help define utilization rates for each fund accountant and team. Ultimately, the project management process will ensure a robust process for getting everyone involved in process improvement. Eventually, nine quick hit projects were selected from the original list of 30. The projects were divided among the original five team members, and subject-matter experts and information technology resources were assigned to each project. The projects predominantly focused on simplifying, eliminating, or automating process steps. The goals were to increase capacity by eliminating non-value-added activi- ties and reducing operational risk through simplification and automation of steps. Four of the nine projects are highlighted below. 1. 2. , was managers and executives from various levels in the organization. The kaizen team provided weekly updates on the status of the project. This ensured that all key stakeholders were kept up to date on the status of the project and the logic behind the solutions developed by the teams. In just four months, from the time the project began until the nine projects were completed, the organization realized a savings of $225,000. As a secondary benefit, members of the five subject-matter expert teams developed a more detailed understanding of how their co-workers performed daily tasks and how their work products and quality were dependent upon one another. After the projects were under way, the consulting firm conducted Lean Six Sigma Green Belt training for the members of the original cross-functional team so that these individuals could begin work on the larger-scale projects. That was soon followed by Champion training to provide the organization's leaders with a clearer picture of their roles and responsibilities, as well as tips for coaching and mentoring the Green Belts in the future. The quick success of the project teams demonstrated how basic Lean Six 3. Sigma principles could be used to simplify work and enhance controls. Managers began to identify further improvement opportunities and work with the Green Belts to vet the ideas and assign resources to develop and implement solutions. information for accuracy aver in une process. Ine eam redesignea une process to automatically feed the expense information from the original source daily, thus eliminating the need for distribution, entry, and verifi- sation steps: 4. Eliminating manual price change sheets. In the past, fund accountants created daily spreadsheets to calculate the percentage change in the NAV by comparing each day's price to that of the previous day. This time-consuming, manual process introduced the possibility of data entry errors and miscalcu- lations. The improvement team redesigned and automated the report to replace the manual process. Now a percent NAV change report is generated daily, thus reducing or eliminating miscalculations and rework. Since the solutions were implemented, the organization has sustained the improvements with random audits of work product to ensure that employees continue to follow the newly designed processes. To maintain project momentum as well as ensure buy-in from managers, a steering committee was formed of managers and executives from various levels in the organization. The kaizen team provided weekly updates on the status of the project. This ensured that all key stakeholders were kept up to date on the status of the project and the logic behind the solutions developed by the teams. In just four months, from the time the project began until the nine projects were completed, the organization realized a savings of $225,000. As a secondary benefit, members of the five subject-matter expert teams developed a more detailed understanding of how their co-workers performed daily tasks and how their work products and quality were dependent upon one another. After the projects were under way, the consulting firm conducted Lean Six Sigma Green Belt training for the members of the original cross-functional team so that these individuals could begin work on the larger-scale proiects. That was This case study focuses on the fund accounting department of a financial services institution that is responsible for supplying net asset values (NAVs) to the NASDAQ stock exchange for more than 700 mutual funds at the close of each trading day. The department's accountants calculate the NAV based on several inputs, such as the number of trades that day, expenses paid, and dividends, for mutual funds of more than 200 clients. Performance is measured by the timeliness of the NAV released to NASDAQ and its accuracy. The organization invested in extensive technology upgrades to boost efficiency and process control with the goals of improving quality and client experience, and was achieving timeliness and accuracy goals more than 99 percent of the time. However, two key questions remained unanswered, "Are we effective at what we are doing?" that is, what was the cost to the business in attaining 99percent accuracy and timeliness? And, "Do we know our operational risk points?" Working with a consulting firm, the orga- nization decided to introduce Lean Six Sigma to address these questions. The first step was forming a cross-functional team comprised of fund account- ing, quality, and the central operations employees. The team created flowcharts that defined the steps performed from the start of the business day until the NAVs were published to NASDAQ at the close of the day. During this time, the team also collected relevant data such as trade volume and rework and reject rates for each process step, as well as process touch time and wait time whenever possible. The goal was to identify areas that presented high levels of risk (ie., generating an error or missing a step) or processing touch time. The team also collected informa- tion and data feeds coming into the department. It was important to understand the timeline for these data feeds as well as their accuracy as they could either delay or affect rework rates. The next step involved a kaizen event, which identified 30 possible improve- ment items and ranked them based on impact (high vs. low) and ease of imple- mentation (easy vs. difficult). Ultimately, the projects were divided into two categories: quick-hit projects that they could realistically solve and implement within 90 days, as well as longer, strategic infrastructure improvements that required additional time to address. The team quickly recognized that longer-term strategic projects improving error tracking, creating a capacity model, and developing a project management process-were necessary to answer the funda- mental questions. Actively measuring these errors would allow managers to quickly identify process steps that present high levels of risk. The capacity model would help define utilization rates for each fund accountant and team. Ultimately, the project management process will ensure a robust process for getting everyone involved in process improvement. Eventually, nine quick hit projects were selected from the original list of 30. The projects were divided among the original five team members, and subject-matter experts and information technology resources were assigned to each project. The projects predominantly focused on simplifying, eliminating, or automating process steps. The goals were to increase capacity by eliminating non-value-added activi- ties and reducing operational risk through simplification and automation of steps. Four of the nine projects are highlighted below. 1. 2. , was managers and executives from various levels in the organization. The kaizen team provided weekly updates on the status of the project. This ensured that all key stakeholders were kept up to date on the status of the project and the logic behind the solutions developed by the teams. In just four months, from the time the project began until the nine projects were completed, the organization realized a savings of $225,000. As a secondary benefit, members of the five subject-matter expert teams developed a more detailed understanding of how their co-workers performed daily tasks and how their work products and quality were dependent upon one another. After the projects were under way, the consulting firm conducted Lean Six Sigma Green Belt training for the members of the original cross-functional team so that these individuals could begin work on the larger-scale projects. That was soon followed by Champion training to provide the organization's leaders with a clearer picture of their roles and responsibilities, as well as tips for coaching and mentoring the Green Belts in the future. The quick success of the project teams demonstrated how basic Lean Six 3. Sigma principles could be used to simplify work and enhance controls. Managers began to identify further improvement opportunities and work with the Green Belts to vet the ideas and assign resources to develop and implement solutions. information for accuracy aver in une process. Ine eam redesignea une process to automatically feed the expense information from the original source daily, thus eliminating the need for distribution, entry, and verifi- sation steps: 4. Eliminating manual price change sheets. In the past, fund accountants created daily spreadsheets to calculate the percentage change in the NAV by comparing each day's price to that of the previous day. This time-consuming, manual process introduced the possibility of data entry errors and miscalcu- lations. The improvement team redesigned and automated the report to replace the manual process. Now a percent NAV change report is generated daily, thus reducing or eliminating miscalculations and rework. Since the solutions were implemented, the organization has sustained the improvements with random audits of work product to ensure that employees continue to follow the newly designed processes. To maintain project momentum as well as ensure buy-in from managers, a steering committee was formed of managers and executives from various levels in the organization. The kaizen team provided weekly updates on the status of the project. This ensured that all key stakeholders were kept up to date on the status of the project and the logic behind the solutions developed by the teams. In just four months, from the time the project began until the nine projects were completed, the organization realized a savings of $225,000. As a secondary benefit, members of the five subject-matter expert teams developed a more detailed understanding of how their co-workers performed daily tasks and how their work products and quality were dependent upon one another. After the projects were under way, the consulting firm conducted Lean Six Sigma Green Belt training for the members of the original cross-functional team so that these individuals could begin work on the larger-scale proiects. That was
Expert Answer:
Answer rating: 100% (QA)
Assessment of the Lean Effort at the Financial Services Firm 1 Organizational Structure of the Lean Effort Crossfunctional team The initiative involve... View the full answer

Posted Date:
Students also viewed these human resource management questions
-
Read the case study Apply Lean Six Sigma in a Financial Services Firms and address the following questions: How was the lean effort at the financial services firm structured organizationally? What...
-
Thank you for your help a. Calculate the monthly repayment on the following housing loan: Loan $600000 Years 19 Rate 6% or .06 pa compounded monthly Answer to the nearest dollar. b. Project A has an...
-
Planning is one of the most important management functions in any business. A front office managers first step in planning should involve determine the departments goals. Planning also includes...
-
Solve each system. If a system is inconsistent or has dependent equations, say so. -5x + 2y = -4 6x + 3y = -6
-
For each of the four parts of question 6, calculate the values of these areas in dollars. How much of the deadweight loss is due to the overproduction of steel by higher-cost U.S. steel producers,...
-
Coffee Bean, Inc. (CBI) buys coffee beans from around the world and roasts, blends, and packages them for resale. The major cost is direct materials; however, there is substantial manufacturing...
-
Is outsourcing by U.S. firms to foreign countries beneficial to the U.S. economy? Weigh the pros and cons, and offer your conclusions.
-
Sage Learning Centers was established on July 20, 2016, to provide educational services. The services provided during the remainder of the month are as follows: July 21. Issued Invoice No. 1 to J....
-
Use the simplex method. Minimize g 11x+9y+ 12z subject to x + y + (x, y, z) = 9 = Z 6 y + 2z 8 X 2.
-
Suppose you were to buy a taxable bond yielding 532 and a nontaxable bond yielding 37 After all taxes have been paid you realize the return for both bonds is identical Based on this information what...
-
Determine the angle (theta) through which the conic with each equation should be rotated. Then write the equation in standard form. 8. 18x2+12xy + 13y - 198=0
-
1. Write a function that accepts the name and grade of the student. Grade distribution should be the following: A: Score >=90 B: Score >=80 C: Score >=70 D: Score >=60 The function should return the...
-
The following information is provided by Maunlad Mfg. Corp.: Cost of goods manufacturedP470,000 Labor cost100,000 Factory overhead50,000 Finished goods, beg.30,000 Finished goods, end20,000 Cost of...
-
1. [10+6 pts] Let f(x) = x-1+x4 (a) Find f'(x) using the definition of the derivative. No marks will be given if the definition is not used. (b) If f(x) is differentiable at x = a, with a > 0,...
-
Carolyn just turned 52 years of age and works for the state of California.She started working there on her 23rd birthday, just after she graduated from college. This coming year will be her 30th year...
-
Please documentation of all data used in the above models using the data structure notation. Example: Order= order#+order date+ {product data} +...
-
The outer loop controls the number of students. Note that the inner loop of this program is always executed exactly three times, once for each day of the long weekend. Modify the code so that the...
-
Rocket Fireworks is evaluating a new firework, the Asian Candle, that can be sold for $45 each. The following information pertains to the Asian Candle: a. What are the estimated life-cycle revenues?...
-
Taylor Processing Company uses a weighted-average process costing system and manufactures a single product-a premium rug shampoo and cleaner. The manufacturing activity for the month of October has...
-
Nicholas Company manufactures basketballs and soccer balls. For both products, materials are added at the beginning of the production process and conversion costs are incurred uniformly. Nicholas...

Study smarter with the SolutionInn App