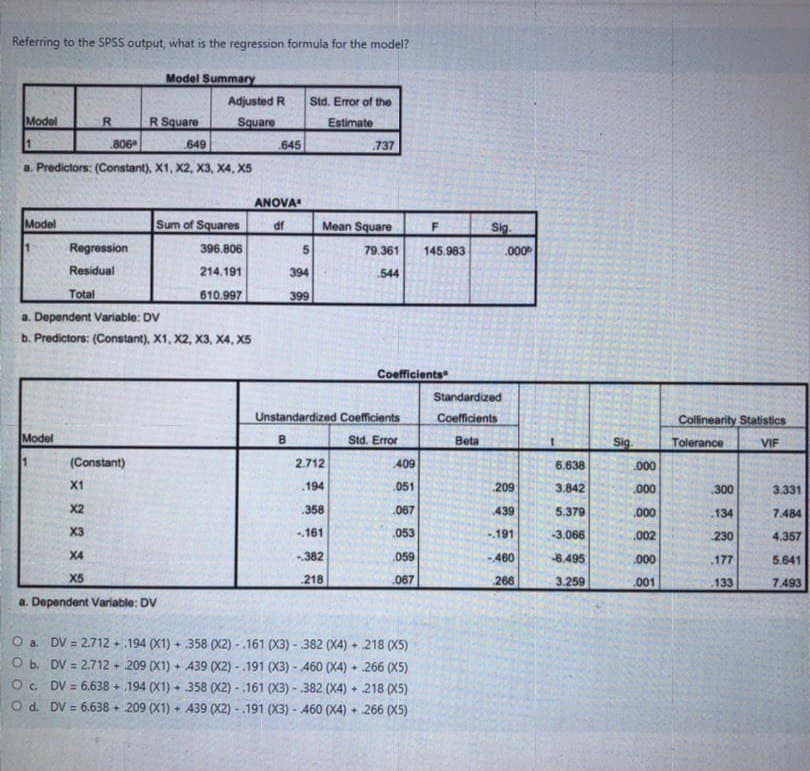
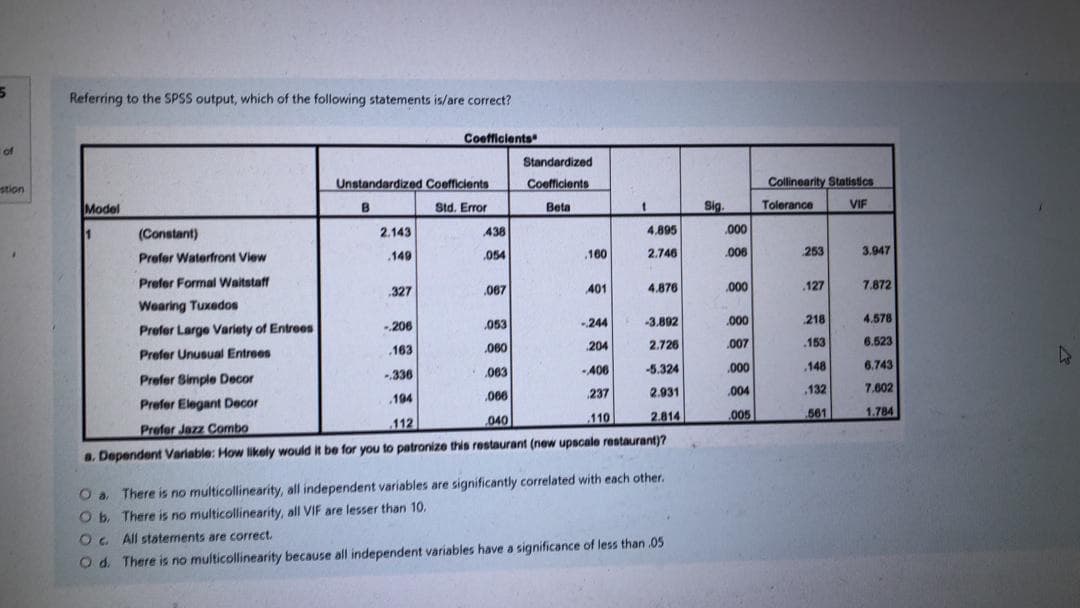
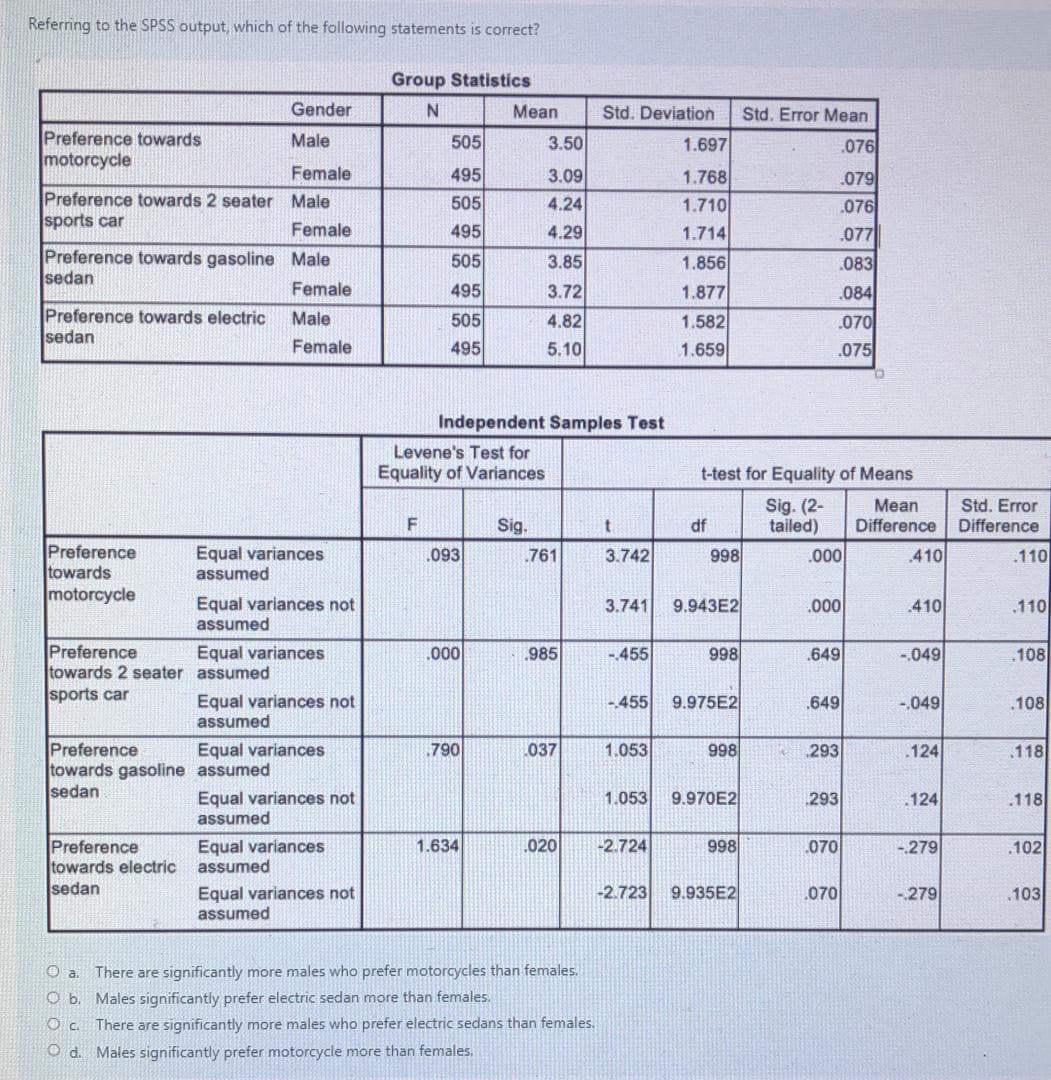
Referring to the SPSS output, what is the regression formula for the model? Model Summary Adjusted R Sid. Error of the R Square Square Estimate 806- 649 645 .737 a. Predictors: (Constant), X1, X2, X3, X4, x5 ANOVA Modal Sum of Squares Mean Square Sig Regression 396.806 79.361 145,983 Residual 214.191 394 544 Total 610.997 399 a. Dependent Variable: DV b. Predictors: (Constant), X1. X2, X3, X4. x5 Coefficients" Standardized Unstandardized Coefficients Coefficients Collinearity Statistics Mod B Sid. Error Beta Tolerance VIF (Constant) 2.712 409 6.638 X1 .194 051 209 3.842 300 3.331 X2 .358 067 439 .134 7.484 X3 -.161 053 .191 3.066 .002 230 4.357 XA -.382 059 - 480 6.495 000 .177 5.641 X5 218 .067 268 3.259 001 .133 7.493 a. Dependent Variable: DV O a. DV = 2.712 - .194 (X1) - 358 (X2) -.161 (X3) - 382 (X4) - 218 (X5) O b. DV = 2.712 + 209 (X1) + 439 (X2) - .191 (X3) - 460 (X4) + 266 (X5) OF DV = 6.638 + .194 (X1) - 358 (X2) - .161 (X3) - 382 (X4) + 218 (X5) Old. DV = 6.638 + 209 (X1) + 439 (X2) -.191 (X3) - 460 (X4) - 266 (X5)Referring to the SPSS output, which of the following statements is/are correct? Coefficients" Standardized Unstandardized Coefficients Coefficients Collinearity Statistics Model B Sid. Error Beta Sig Tolerance VIF (Constant) 2.143 438 4.895 000 Prefer Waterfront View .149 054 160 2.746 DOB 253 3.947 Prefer Formal Waitstaff .327 067 401 4.876 127 7.872 Wearing Tuxedos Prefer Large Variety of Entrees -.206 053 -244 -3.892 218 4.578 Prefer Unusual Entrees .163 060 204 2.726 .007 .153 6.523 Prefer Simple Decor -,336 .083 -,406 -5.324 .000 .148 6.743 Prefer Elegant Decor .194 086 237 2.931 004 .132 7.602 Prefer Jazz Combo 112 040 110 2.814 .005 .561 1.784 a. Dependent Variable: How likely would it be for you to patronize this restaurant (new upscale restaurant)? O a, There is no multicollinearity, all independent variables are significantly correlated with each other. O b, There is no multicollinearity, all VIF are lesser than 10. O c. All statements are correct. O:d. There is no multicollinearity because all independent variables have a significance of less than .05Referring to the SPSS output, which of the following statements is correct? Group Statistics Gender N Mean Std. Deviation Std. Error Mean Preference towards Male 505 3.50 1.697 076 motorcycle Female 495 3.09 1.768 079 Preference towards 2 seater Male 505 4.24 1.710 076 sports car Female 495 4.29 1.714 077 Preference towards gasoline Male 505 3.85 1.856 083 sedan Female 495 3.72 1.877 084 Preference towards electric Male 505 4.82 1.582 070 sedan Female 495 5.10 1.659 .075 Independent Samples Test Levene's Test for Equality of Variances t-test for Equality of Means Sig. (2- Mean Std. Error Sig df tailed) Difference Difference Preference Equal variances 093 761 3.742 998 000 410 .110 towards assumed motorcycle Equal variances not 3.741 9.943E2 000 410 .110 assumed Preference Equal variances 000 985 - 455 998 649 -.049 108 towards 2 seater assumed sports car Equal variances not .455 9.975E2 649 -.049 108 assumed Preference Equal variances 790 037 1.053 998 293 124 118 towards gasoline assumed sedan Equal variances not 053 9.970E2 293 124 .118 assumed Preference Equal variances 1.634 020 2.724 998 070 .279 .102 towards electric assumed sedan Equal variances not 2.723 9.935E2 .070 -.279 .103 assumed O a. There are significantly more males who prefer motorcycles than females. O b. Males significantly prefer electric sedan more than females. c. There are significantly more males who prefer electric sedans than females. d. Males significantly prefer motorcycle more than females