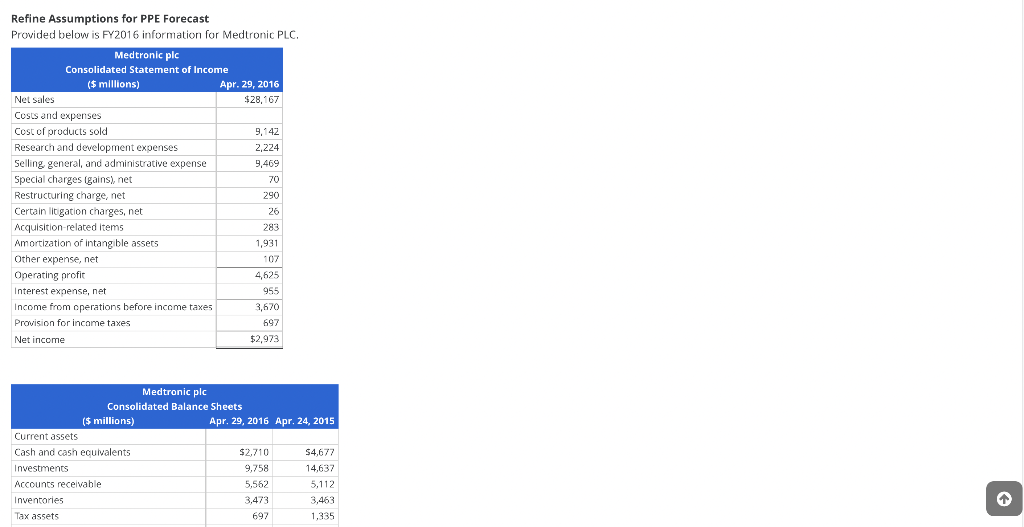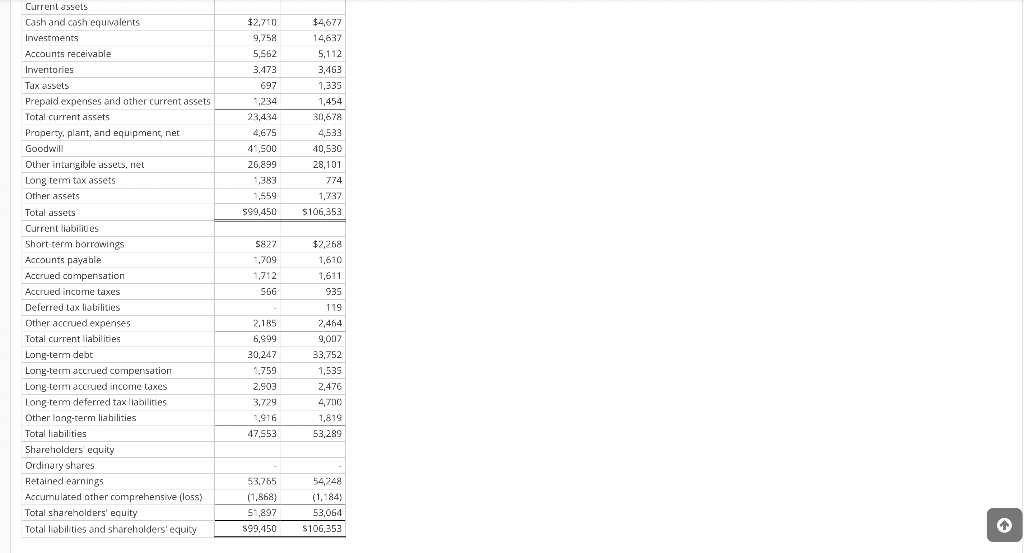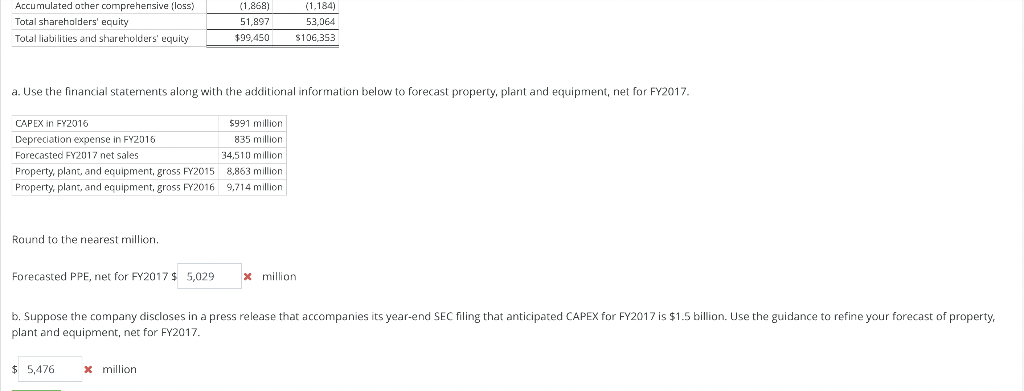


Refine Assumptions for PPE Forecast Provided below is FY2016 information for Medtronic PLC. Medtronic plc Consolidated Statement of Income ($ millions) Apr. 29, 2016 Net sales $28,167 Costs and expenses Cost of products sold 9,142 Research and development expenses 2,224 Selling general, and administrative expense 9,469 Special charges (gains), net 70 Restructuring charge, net 290 ... Certain litigation charges, net 26 ein Acquisition-related items 283 .... Amortization of intangible assets 1,931 Other expense, net 107 Operating profit 4,625 Interest expense, net 955 Income from operations before income taxes 3,670 Provision for income taxes 697 Net income $2,973 Medtronic plc Consolidated Balance Sheets ($ millions) Apr. 29, 2016 Apr. 24, 2015 Current assets Cash and cash ecuivalents $2.710 54,677 Investments 9,758 14,637 Accounts receivable 5,562 5,112 Inventories 3,473 3,463 Tax assets 697 1,335 $2.710 9,758 5,562 3,473 697 1,234 - 23,434 . 4.675 41.500 26.899 1.383 1,559 599,450 $4,677 14632 5,112 3,463 were 1,335 1,454 30,678 . 4,533 40,530 28,101 774 1,737 $106,353 Current assets Cash and cash equivalents " Investments " Accounts receivable Inventories memorie Tux assels Prepaid expenses and other current assets Total current assets Property, plant, and equipment, net Goodwill Other intangible assets, niet wanan Long term tax assets Other assets Total assets Current liabilities Short-term borrowings Accounts payable " Accrued compensation Accrued income taxes Deferred tax liabilities Other accrued expenses . Total current liabilities Long-term debt Long-term accrued compensation Long-term accrued income taxes Long term deferred tax liabilities Other long-term liabilities Total liabilities Shareholders equity Ordinary shares Retained earnings Accumulated other comprehensive (loss) Total shareholders' equity Total liabilities and shareholders' equity $827 1.709 1,712 566 2,185 co 6,999 30.247 2022 1,759 2.903 3,729 1916 47.553 $2,268 1,610 1,611 935 119 2,464 9,007 33,752 1.535 2.476 4700 1,819 53,289 53.755 (1,868) 51,897 $99,450 54,248 (1,184) 53,064 S106,353 Accumulated other comprehensive (loss) Total shareholders' equity Tolal liabilities and shareholders' equily (1.868) 51,897 $99,450 (1.184) 53,064 $106.353 a. Use the financial statements along with the additional information below to forecast property, plant and equipment, net for FY2017. CAPEX in FY2016 Depreciation expense in FY2016 Forecasted FY2017 net sales Property, plant and equipment, gross FY2015 Property, plant, and equipment, gross FY2016 $991 million 835 million 34.510 million 8,863 million 9,714 million Round to the nearest million Forecasted PPE, net for FY2017 $ 5,029 x million b. Suppose the company discloses in a press release that accompanies its year-end SEC filing that anticipated CAPEX for FY2017 is $1.5 billion. Use the guidance to refine your forecast of property, plant and equipment, net for FY2017. $ 5,476 x million


