

Answered step by step
Verified Expert Solution
Question
1 Approved Answer
Reformulate the following Balance Sheet. 199501 in Millions of USD except Per Sharc FY 2016 FY 2017 FY 2018 FY 2019 FY 2020 12 Months
Reformulate the following Balance Sheet. 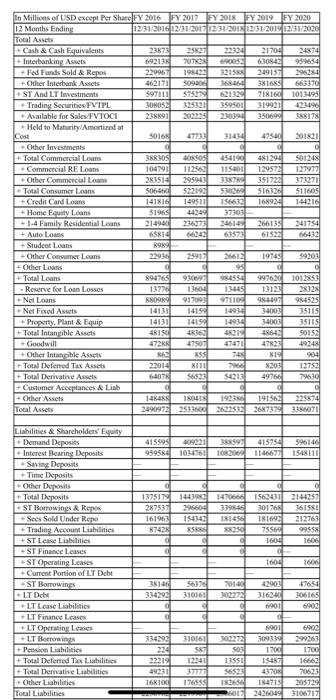
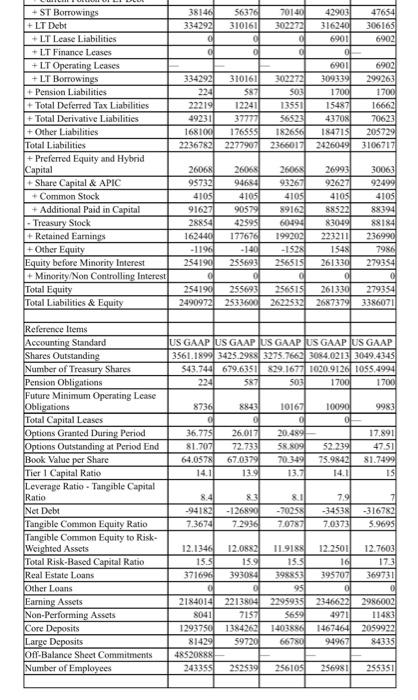
199501 in Millions of USD except Per Sharc FY 2016 FY 2017 FY 2018 FY 2019 FY 2020 12 Months Ending 12/31/201612/31/2017 1331/2018 1351/2015 12/31/2020 Total Assets - Cash & Cash Equivalents 23173 2521 22324 21704 24x74 Interbanking Assets 69213 ROOS 6:30 + Fed Funds Sold & Repos 195423 3215 249157 296284 + Other Interbank Assets 462171 SO 36826 381685 663370 +ST And LT Investments 597111 575079 6213 718160 1013-093 Trading Securities. FVTPL BOROS 325321 519921 42495 Available for Sales VTOCI 238891 200235 350694 368178 Held to Maturity/Amortized at Cost 5016 47733 47540 201821 Other Investments - Total Commercial Loans 388305 GROS 454190 481294 501248 Commercial RE Loans 104791 1150 129573 122977 Other Commercial Loans 283514 29504 3387 351723 373270 Total Consumer Loans 522193 5203 516326 511605 +Credit Card Lars 14IRIG 149511 168924 144216 Home Equity Loans S1966 44344 37303 +1-4 Family Residential Loans 214940 2461 266139 2417541 + Auto Loans 65814 64243 635751 61522 66412 - Student Loans 899 + Other Consumer Loans 229 1975 59203 +Other Loans 951 - Total Loans 894765 9300 984550 997620 1012053 Reserve for Loan Losses 13770 13 13445 1312 2812 Not Loans 880989 917001 972103 98-4097 984525 -Net Fixed Assets 14131 14154 34001 15115 Property. Plant & Equip 14131 14156 10934 34003 35115 Total Intangible Assets 4815 4636 4643 50152 - Goodwill 472 47507 47823 +9945 + Other intangible Assets 862 35 8194 904 Total Deferred Tax Assets 22014 1111 8203 12752 + Total Derivative Assets 64078 $6523 $2213 49766 79610 Customer Acceptances & Linh + Other Assets 1888 1804 19234 191563 23574 Total Assets 249097 25136002625952687325 3386OTI 415595 959584 415754 10200 11-46675 596146 1548111 101751 296604 1375178 287537 161963 8742 147065 3395 189456 1563831 30176 INI 7556 2144257 36158 212763 99558 1600 cl Liabilities & Shareholders' Equity Demand Deposits Interest Bearing Deposits Saving Deposits Time Deposits Other Deposits - Total Deposits ST Borrowings & Ropes Sees Sold Under Repo + Trading Account Liabilities +ST Lease Liabilities -ST Finance Leases ST Operating Leaves Current Portion of LT Debt ST Borrowings LT Debe - LT Lease Liabilities -LT Finance cases *LT Operating Leanies +LT Boromings Persson Liabilities Total Deferred Tax Liabilities + Total Derivative abilities + Other Liabilities Total Liabilities 1604 1600 38140 334293 5617 310161 7650 20140 300272 42901 316240 61901 30616 6902 224 22219 9231 168106 310161 57 12341 3777 176555 300272 SOS 13551 S6925 TOS 2013 6901 309339 170 15457 43705 164713 243649 6900 299267 1700 16662 70623 205729 3106717 38146 334292 56376 310161 70140 302272 47654 306165 6902 Lle 6902 42903 316240 6901 OL 6901 309339 1700 15487 43708 184715 2426049 299263 334292 310161 302272 224 587 SOS 22219 122411 13551 49231 37777 56523 168106 176555 182656 2236782 2277907 2366017 1700 16662 70623 2057291 3106717 + ST Borrowings +LT Debt + LT Lease Liabilities +LT Finance Leases +LT Operating Leases +LT Borrowings + Pension Liabilities + Total Deferred Tax Liabilities + Total Derivative Liabilities + Other Liabilities Total Liabilities + Preferred Equity and Hybrid Capital + Share Capital & APIC + Common Stock + Additional Paid in Capital Treasury Stock +Retained Earnings + Other Equity Equity before Minority Interest + Minority/Non Controlling Interest Total Equity Total Liabilities & Equity 30063 26068 95732 4105 91627 28854 162440 -1196 254190 26065 94684 4105 90579 42595 177676 - 140 235693 26065 93267 4105 89162 60494 199202 -1528 256515 26993 92627 4105 88522 83049 223211 1548 261330 ol 261330 2687379 92499 4105 88394 88184 236990 7986 279354 254190 255693 256515 24909721 25336002622532 279354 3386071 US GAAP US GAAP US GAAP US GAAP US GAAP 3561.1899 3425.2985 3275.7662 3084,0213 3049.4345 543.744 679.6351 $29.16771020-9126 1055.4994 587 503 1700 1700 224 8736 10167 C 36.775 81.707 64.0578 14.0 26.017 72.733 67.0379 139 20.489 58 809 70.349 13.7 10090 9983 ol 17.891 52.239 47.51 75.98421 81.7499 14.1 IS Reference Items Accounting Standard Shares Outstanding Number of Treasury Shares Pension Obligations Future Minimum Operating Lease Obligations Total Capital Leases Options Granted During Period Options Outstanding at Period End Book Value per Share Tier 1 Capital Ratio Leverage Ratio - Tangible Capital Ratio Net Debt Tangible Common Equity Ratio Tangible Common Equity to Risk- Weighted Assets Total Risk-Based Capital Ratio Real Estate Loans Other Loans Earning Assets Non-Performing Assets Core Deposits Large Deposits Off-Balance Sheet Commitments Number of Employees 8.4 -94182 7.3674 83 -126890 7.2936 8.1 -70258 7.0787 7.91 -34538 7.0373 -316782 5.9695 12.7603 173 369731 12.1346 12.0882 11.9188 15.5 15.9 133 371696 393084 398853 ol 95 2184014 2213804 2295935 8041 7151 5659 1293750 1384262 1403886 81429 597201 66780 485208 243355 252539 256105 12.25011 16 395707 ol 2346622 4971 14674641 949671 2986002 11483 2059922 84335 256981 255351 199501 in Millions of USD except Per Sharc FY 2016 FY 2017 FY 2018 FY 2019 FY 2020 12 Months Ending 12/31/201612/31/2017 1331/2018 1351/2015 12/31/2020 Total Assets - Cash & Cash Equivalents 23173 2521 22324 21704 24x74 Interbanking Assets 69213 ROOS 6:30 + Fed Funds Sold & Repos 195423 3215 249157 296284 + Other Interbank Assets 462171 SO 36826 381685 663370 +ST And LT Investments 597111 575079 6213 718160 1013-093 Trading Securities. FVTPL BOROS 325321 519921 42495 Available for Sales VTOCI 238891 200235 350694 368178 Held to Maturity/Amortized at Cost 5016 47733 47540 201821 Other Investments - Total Commercial Loans 388305 GROS 454190 481294 501248 Commercial RE Loans 104791 1150 129573 122977 Other Commercial Loans 283514 29504 3387 351723 373270 Total Consumer Loans 522193 5203 516326 511605 +Credit Card Lars 14IRIG 149511 168924 144216 Home Equity Loans S1966 44344 37303 +1-4 Family Residential Loans 214940 2461 266139 2417541 + Auto Loans 65814 64243 635751 61522 66412 - Student Loans 899 + Other Consumer Loans 229 1975 59203 +Other Loans 951 - Total Loans 894765 9300 984550 997620 1012053 Reserve for Loan Losses 13770 13 13445 1312 2812 Not Loans 880989 917001 972103 98-4097 984525 -Net Fixed Assets 14131 14154 34001 15115 Property. Plant & Equip 14131 14156 10934 34003 35115 Total Intangible Assets 4815 4636 4643 50152 - Goodwill 472 47507 47823 +9945 + Other intangible Assets 862 35 8194 904 Total Deferred Tax Assets 22014 1111 8203 12752 + Total Derivative Assets 64078 $6523 $2213 49766 79610 Customer Acceptances & Linh + Other Assets 1888 1804 19234 191563 23574 Total Assets 249097 25136002625952687325 3386OTI 415595 959584 415754 10200 11-46675 596146 1548111 101751 296604 1375178 287537 161963 8742 147065 3395 189456 1563831 30176 INI 7556 2144257 36158 212763 99558 1600 cl Liabilities & Shareholders' Equity Demand Deposits Interest Bearing Deposits Saving Deposits Time Deposits Other Deposits - Total Deposits ST Borrowings & Ropes Sees Sold Under Repo + Trading Account Liabilities +ST Lease Liabilities -ST Finance Leases ST Operating Leaves Current Portion of LT Debt ST Borrowings LT Debe - LT Lease Liabilities -LT Finance cases *LT Operating Leanies +LT Boromings Persson Liabilities Total Deferred Tax Liabilities + Total Derivative abilities + Other Liabilities Total Liabilities 1604 1600 38140 334293 5617 310161 7650 20140 300272 42901 316240 61901 30616 6902 224 22219 9231 168106 310161 57 12341 3777 176555 300272 SOS 13551 S6925 TOS 2013 6901 309339 170 15457 43705 164713 243649 6900 299267 1700 16662 70623 205729 3106717 38146 334292 56376 310161 70140 302272 47654 306165 6902 Lle 6902 42903 316240 6901 OL 6901 309339 1700 15487 43708 184715 2426049 299263 334292 310161 302272 224 587 SOS 22219 122411 13551 49231 37777 56523 168106 176555 182656 2236782 2277907 2366017 1700 16662 70623 2057291 3106717 + ST Borrowings +LT Debt + LT Lease Liabilities +LT Finance Leases +LT Operating Leases +LT Borrowings + Pension Liabilities + Total Deferred Tax Liabilities + Total Derivative Liabilities + Other Liabilities Total Liabilities + Preferred Equity and Hybrid Capital + Share Capital & APIC + Common Stock + Additional Paid in Capital Treasury Stock +Retained Earnings + Other Equity Equity before Minority Interest + Minority/Non Controlling Interest Total Equity Total Liabilities & Equity 30063 26068 95732 4105 91627 28854 162440 -1196 254190 26065 94684 4105 90579 42595 177676 - 140 235693 26065 93267 4105 89162 60494 199202 -1528 256515 26993 92627 4105 88522 83049 223211 1548 261330 ol 261330 2687379 92499 4105 88394 88184 236990 7986 279354 254190 255693 256515 24909721 25336002622532 279354 3386071 US GAAP US GAAP US GAAP US GAAP US GAAP 3561.1899 3425.2985 3275.7662 3084,0213 3049.4345 543.744 679.6351 $29.16771020-9126 1055.4994 587 503 1700 1700 224 8736 10167 C 36.775 81.707 64.0578 14.0 26.017 72.733 67.0379 139 20.489 58 809 70.349 13.7 10090 9983 ol 17.891 52.239 47.51 75.98421 81.7499 14.1 IS Reference Items Accounting Standard Shares Outstanding Number of Treasury Shares Pension Obligations Future Minimum Operating Lease Obligations Total Capital Leases Options Granted During Period Options Outstanding at Period End Book Value per Share Tier 1 Capital Ratio Leverage Ratio - Tangible Capital Ratio Net Debt Tangible Common Equity Ratio Tangible Common Equity to Risk- Weighted Assets Total Risk-Based Capital Ratio Real Estate Loans Other Loans Earning Assets Non-Performing Assets Core Deposits Large Deposits Off-Balance Sheet Commitments Number of Employees 8.4 -94182 7.3674 83 -126890 7.2936 8.1 -70258 7.0787 7.91 -34538 7.0373 -316782 5.9695 12.7603 173 369731 12.1346 12.0882 11.9188 15.5 15.9 133 371696 393084 398853 ol 95 2184014 2213804 2295935 8041 7151 5659 1293750 1384262 1403886 81429 597201 66780 485208 243355 252539 256105 12.25011 16 395707 ol 2346622 4971 14674641 949671 2986002 11483 2059922 84335 256981 255351 Step by Step Solution
There are 3 Steps involved in it
Step: 1

Get Instant Access to Expert-Tailored Solutions
See step-by-step solutions with expert insights and AI powered tools for academic success
Step: 2

Step: 3
Ace Your Homework with AI
Get the answers you need in no time with our AI-driven, step-by-step assistance
Get Started
Governing Global Finance
Authors: Michele Fratianni, Paolo Savona
1st Edition
1138742147, 978-1138742147