Answered step by step
Verified Expert Solution
Question
1 Approved Answer
Regarding Enron, this was a company that resulted in the creation of the Sarbanes-Oxley Act and many reforms to the accounting profession Ratio Analysis. Using
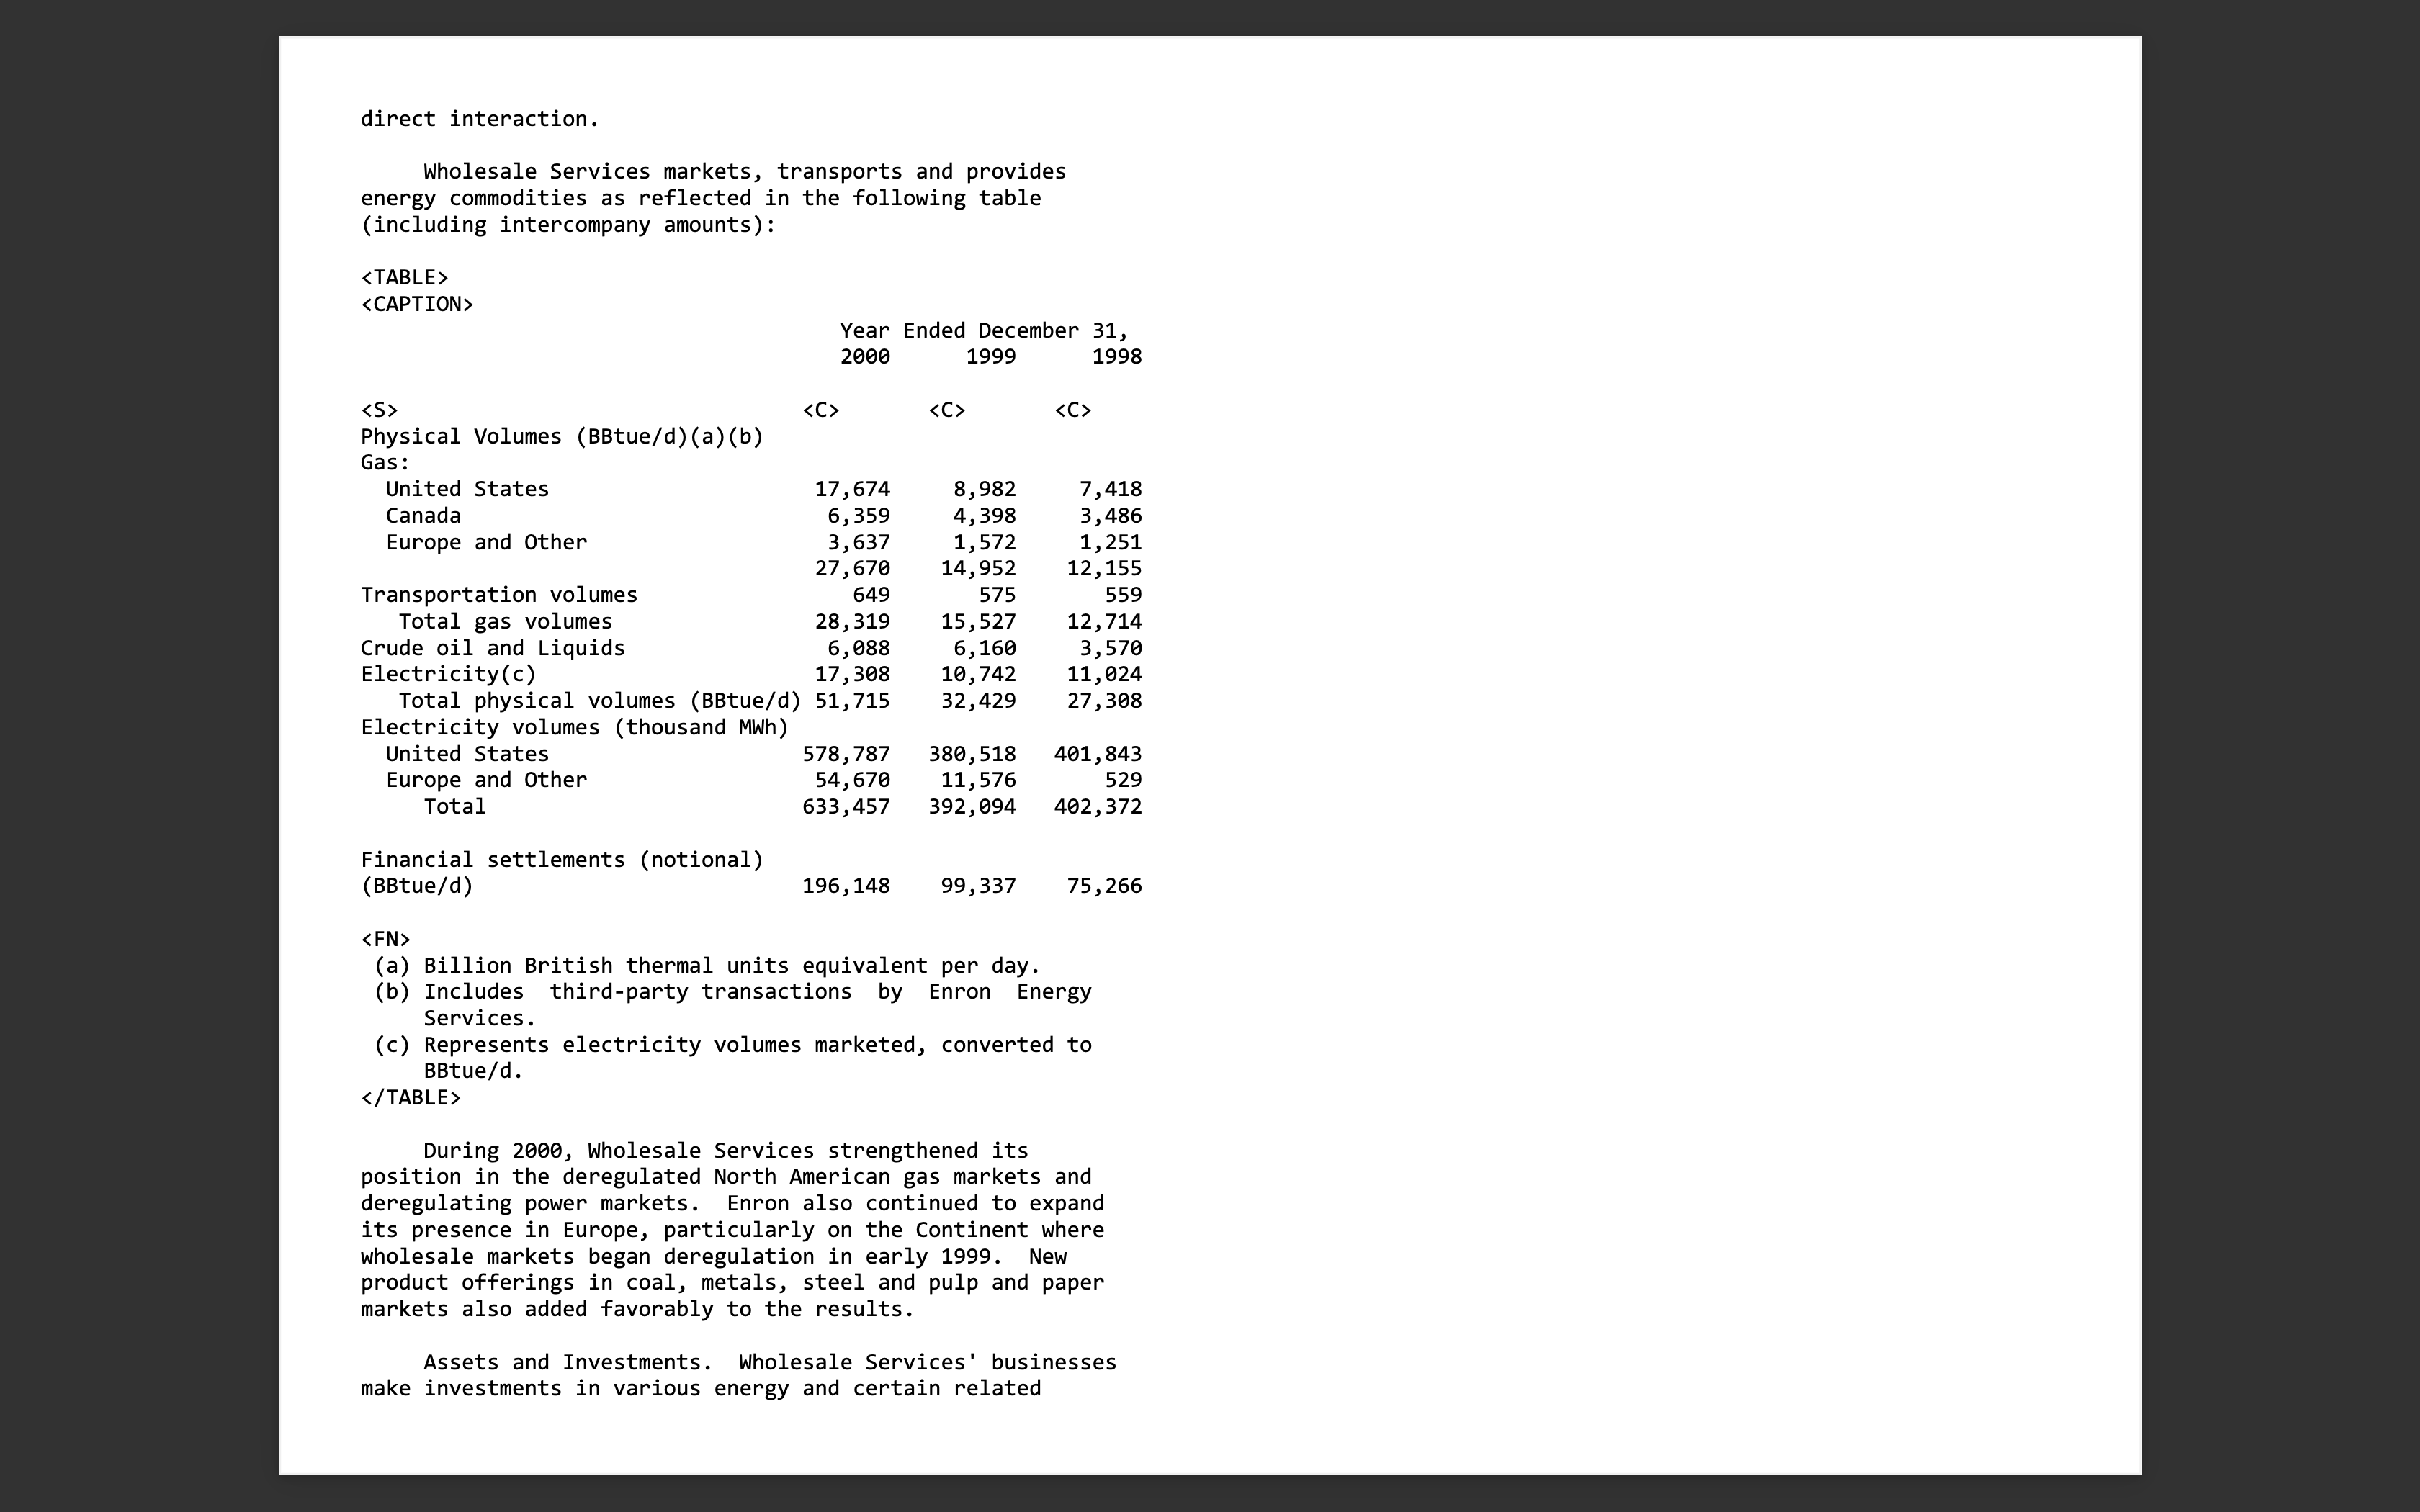
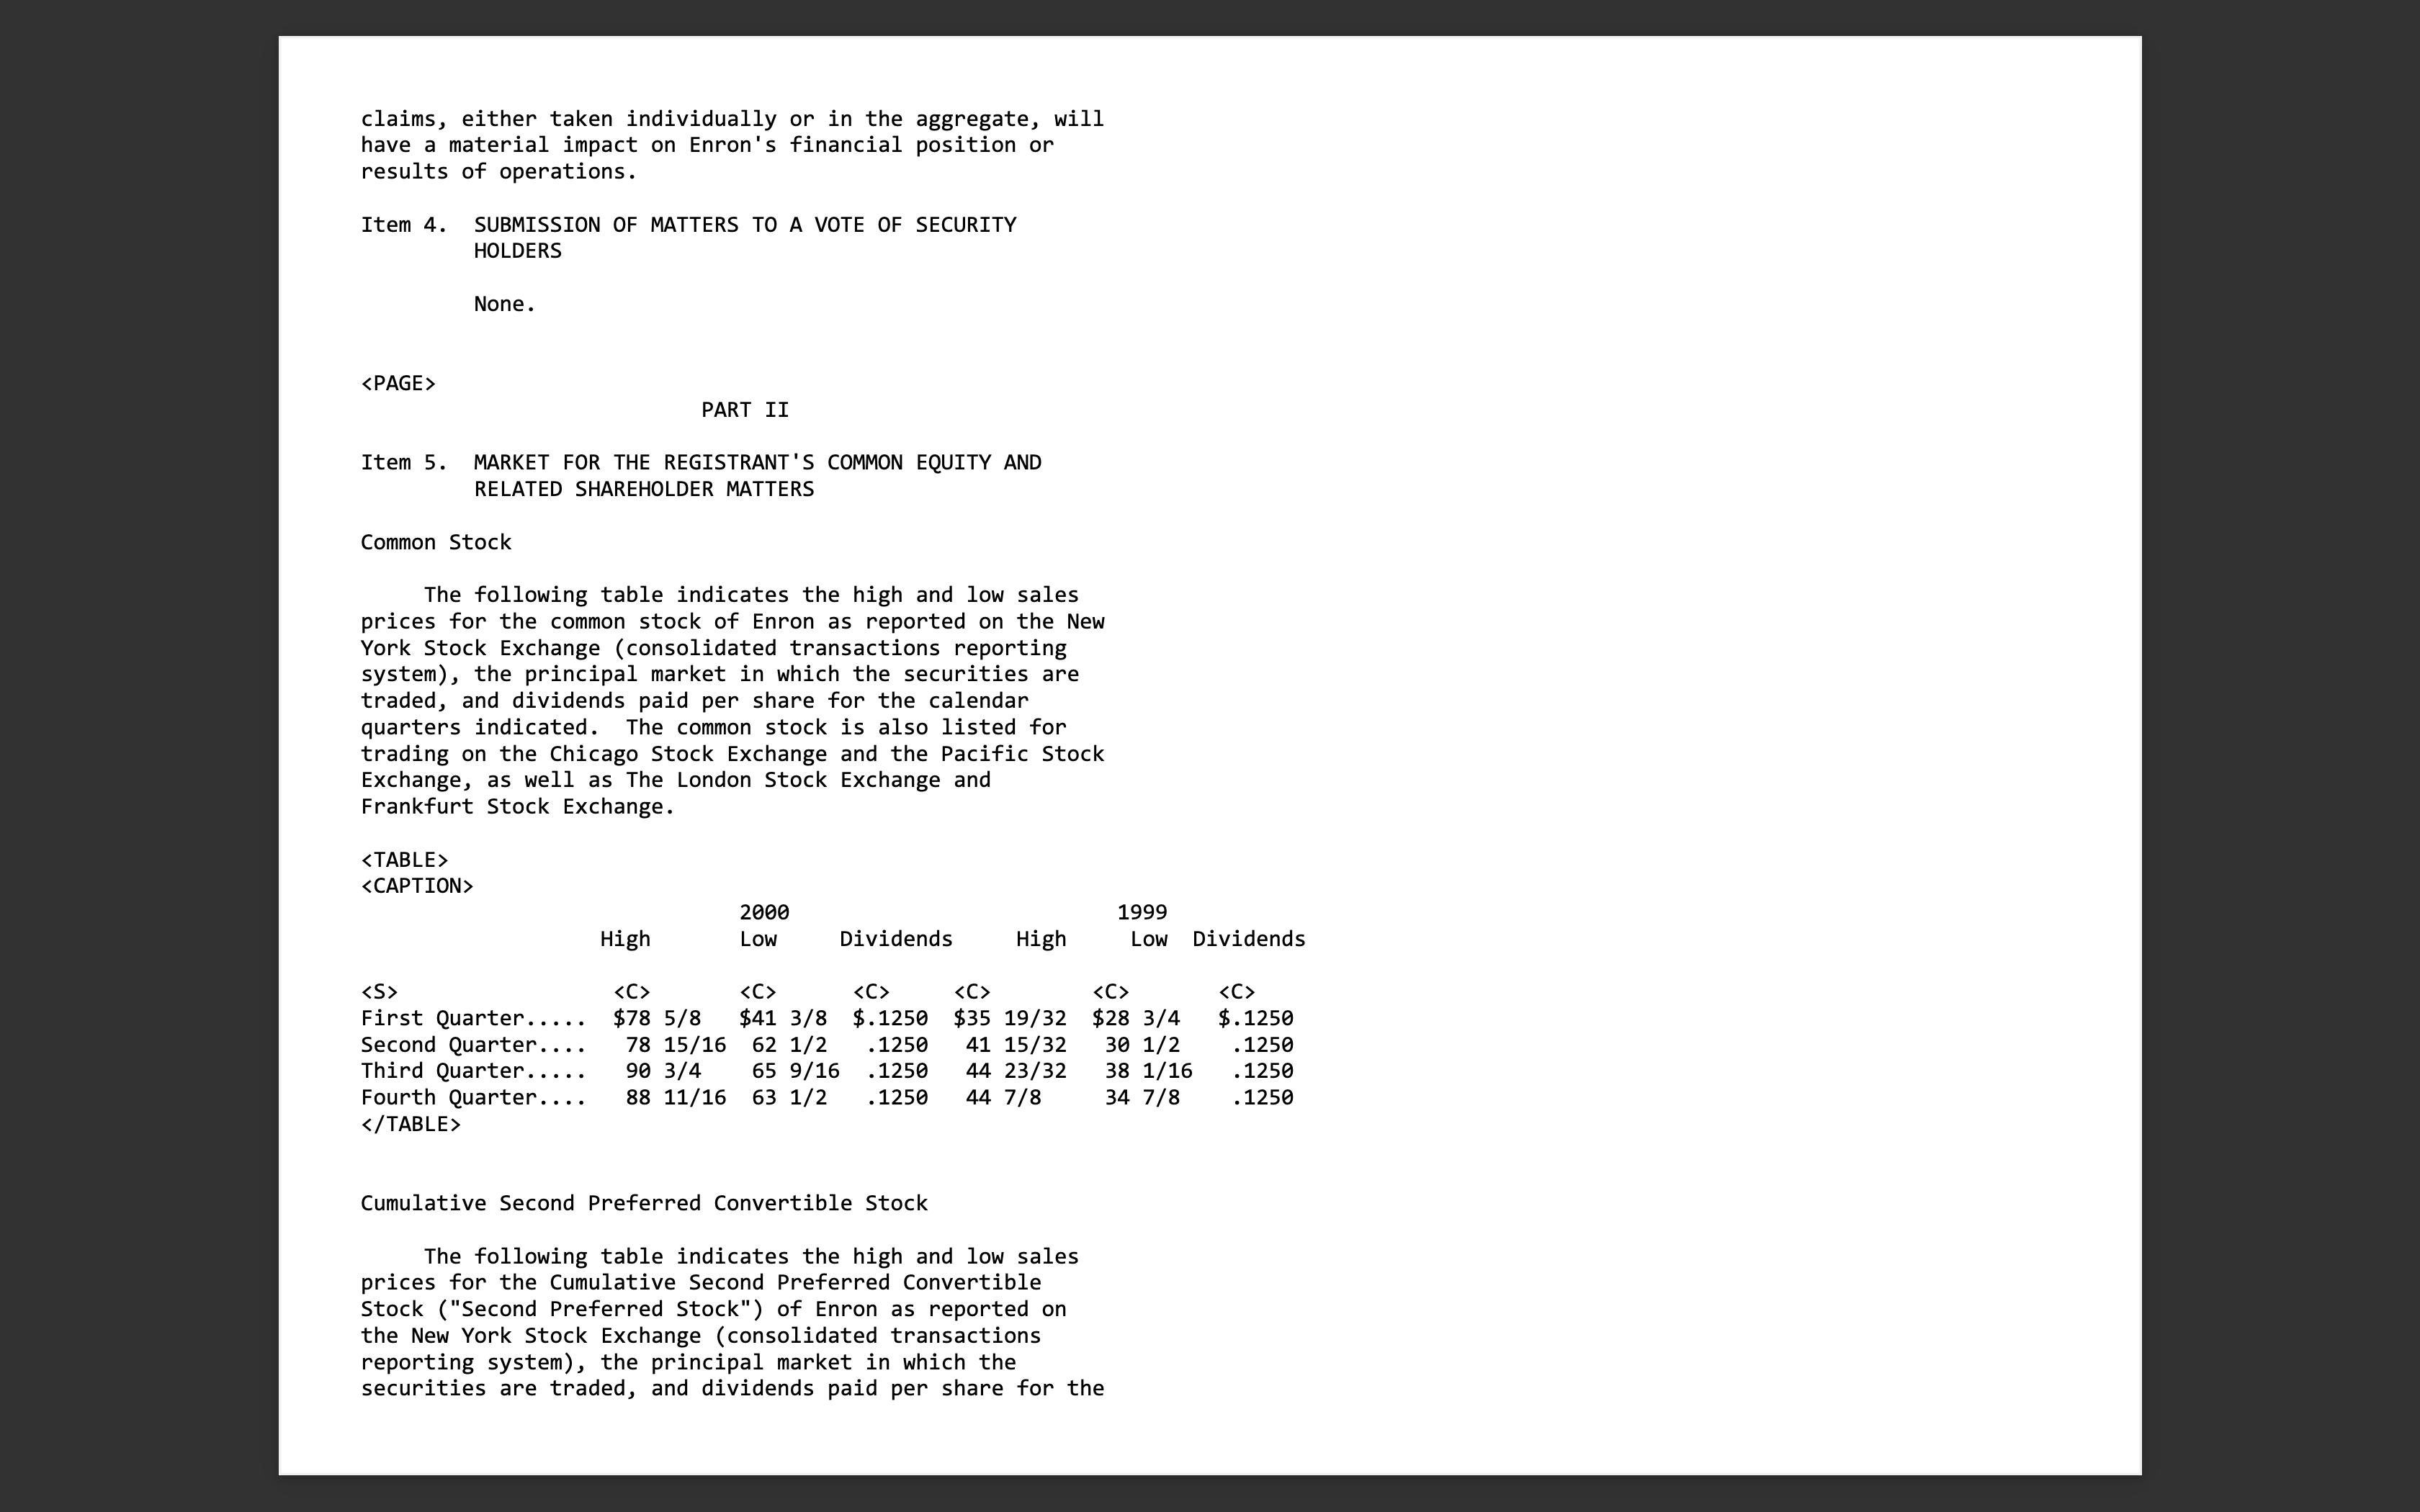
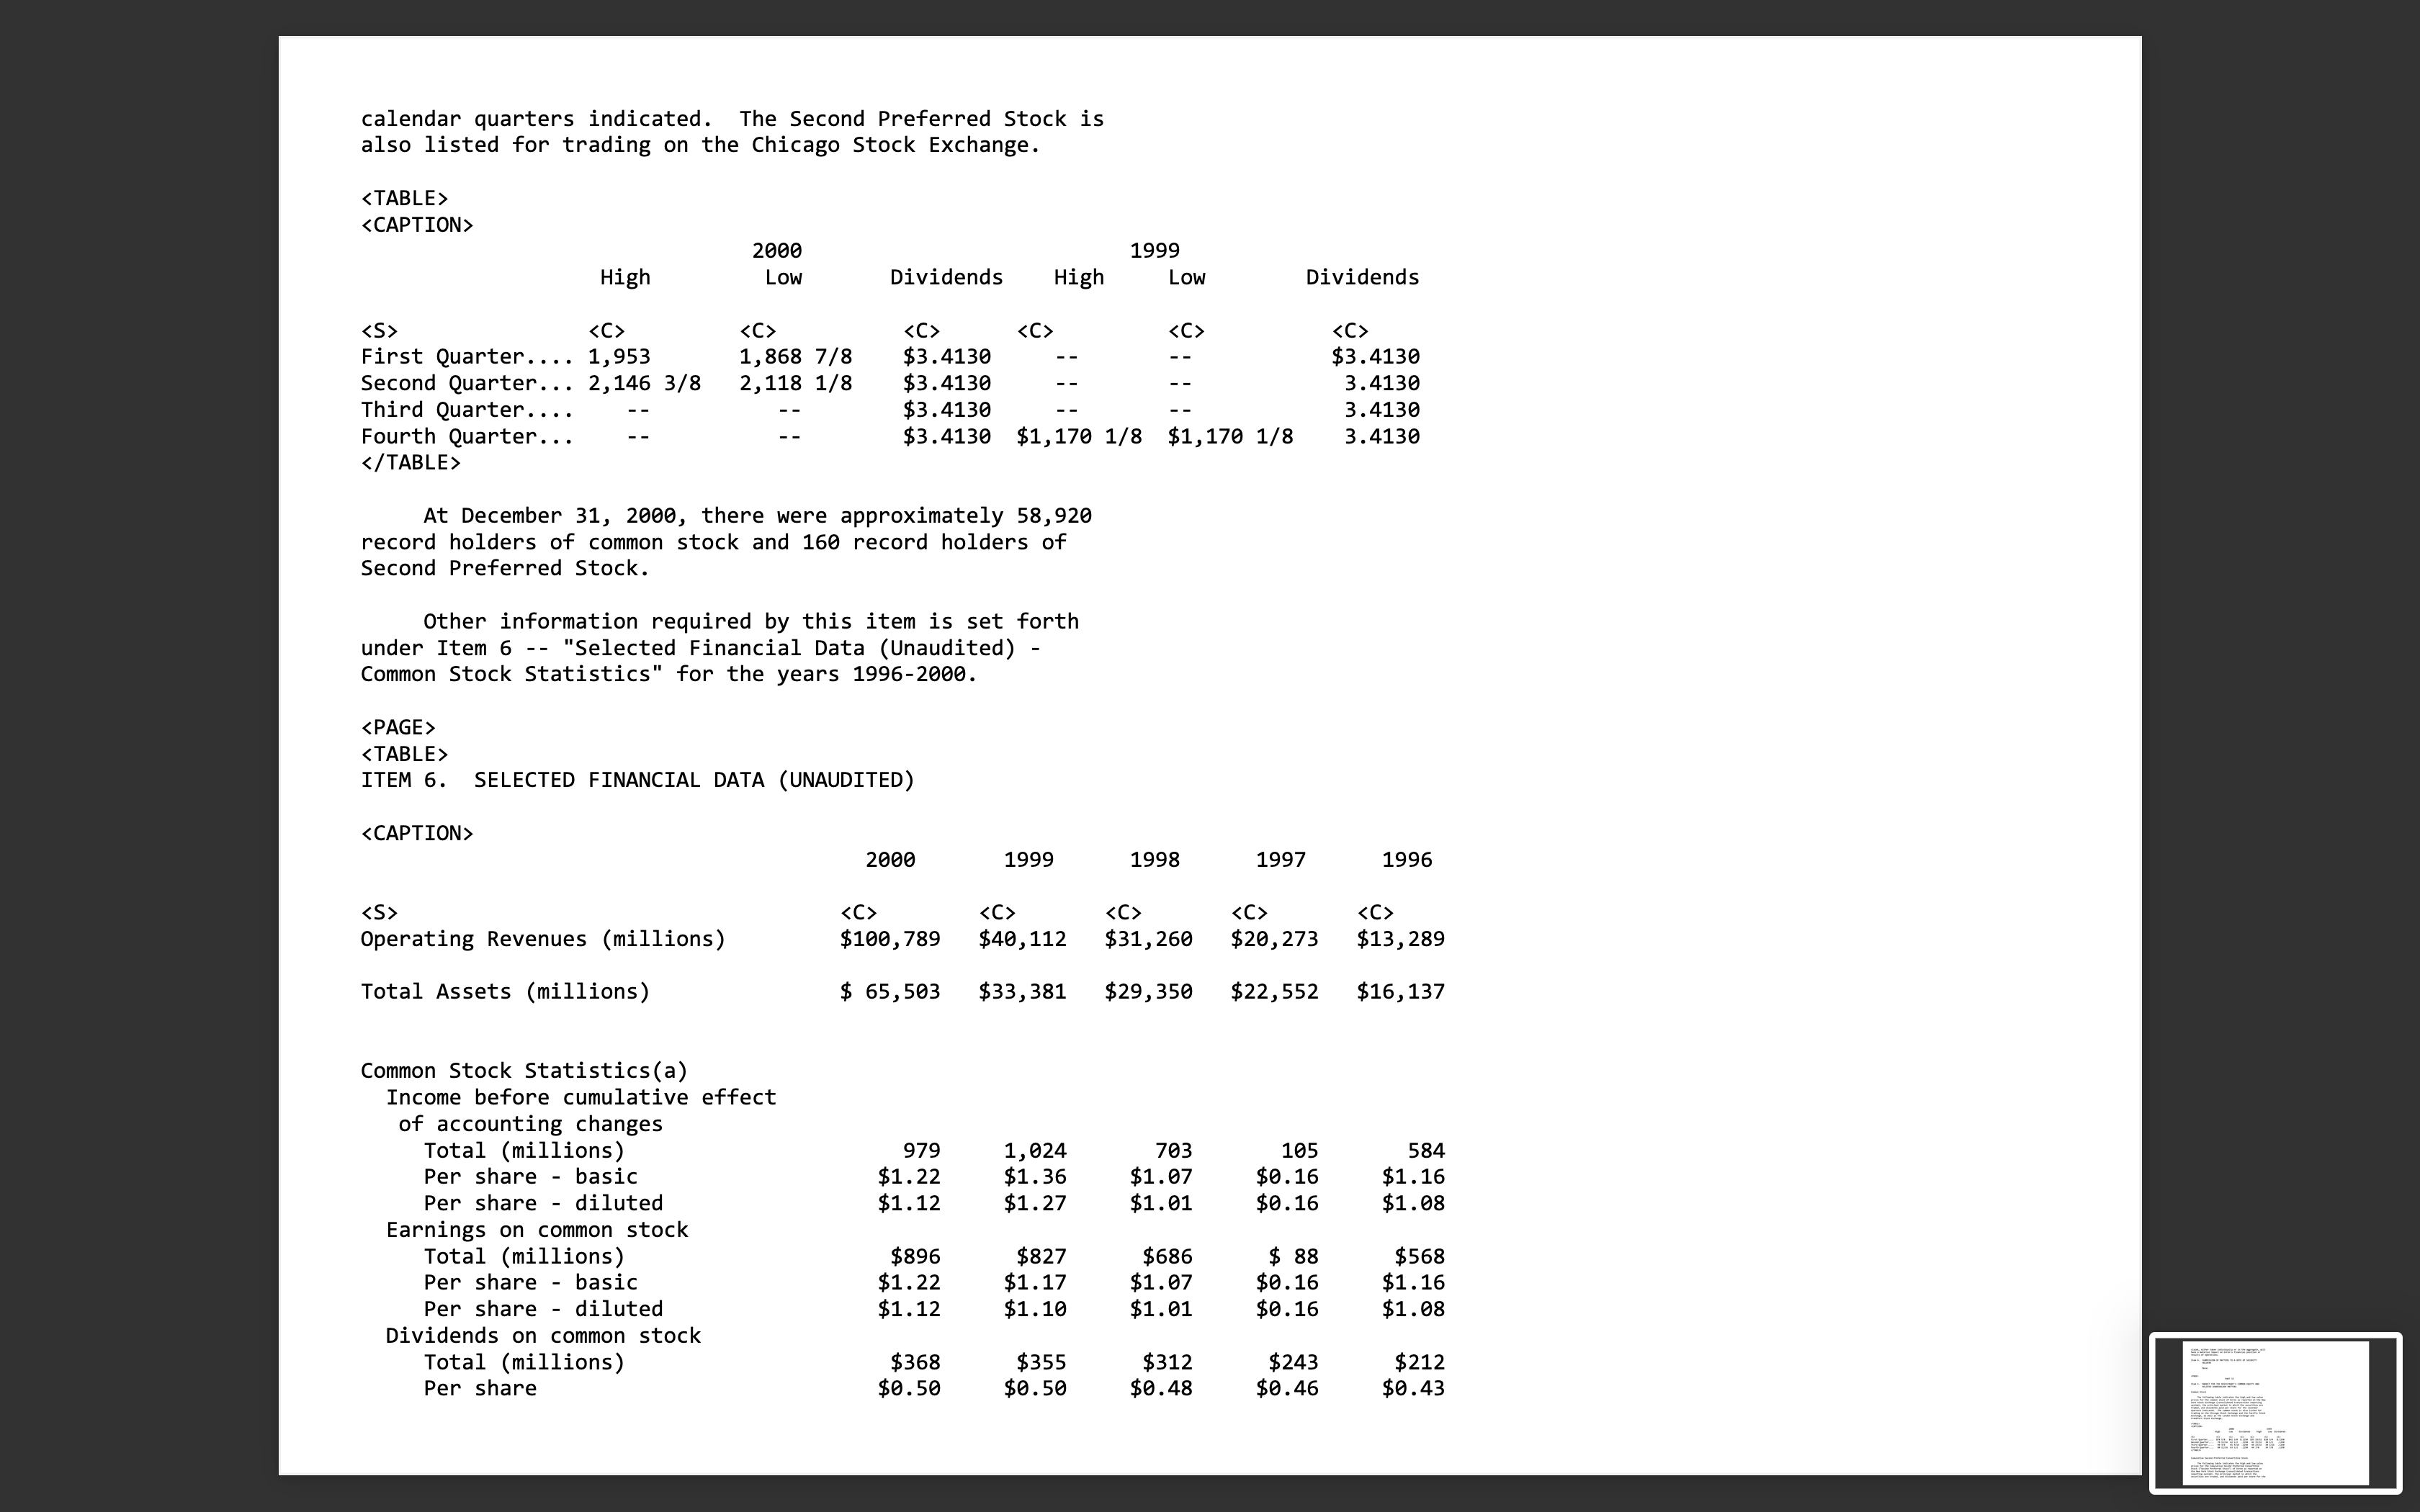
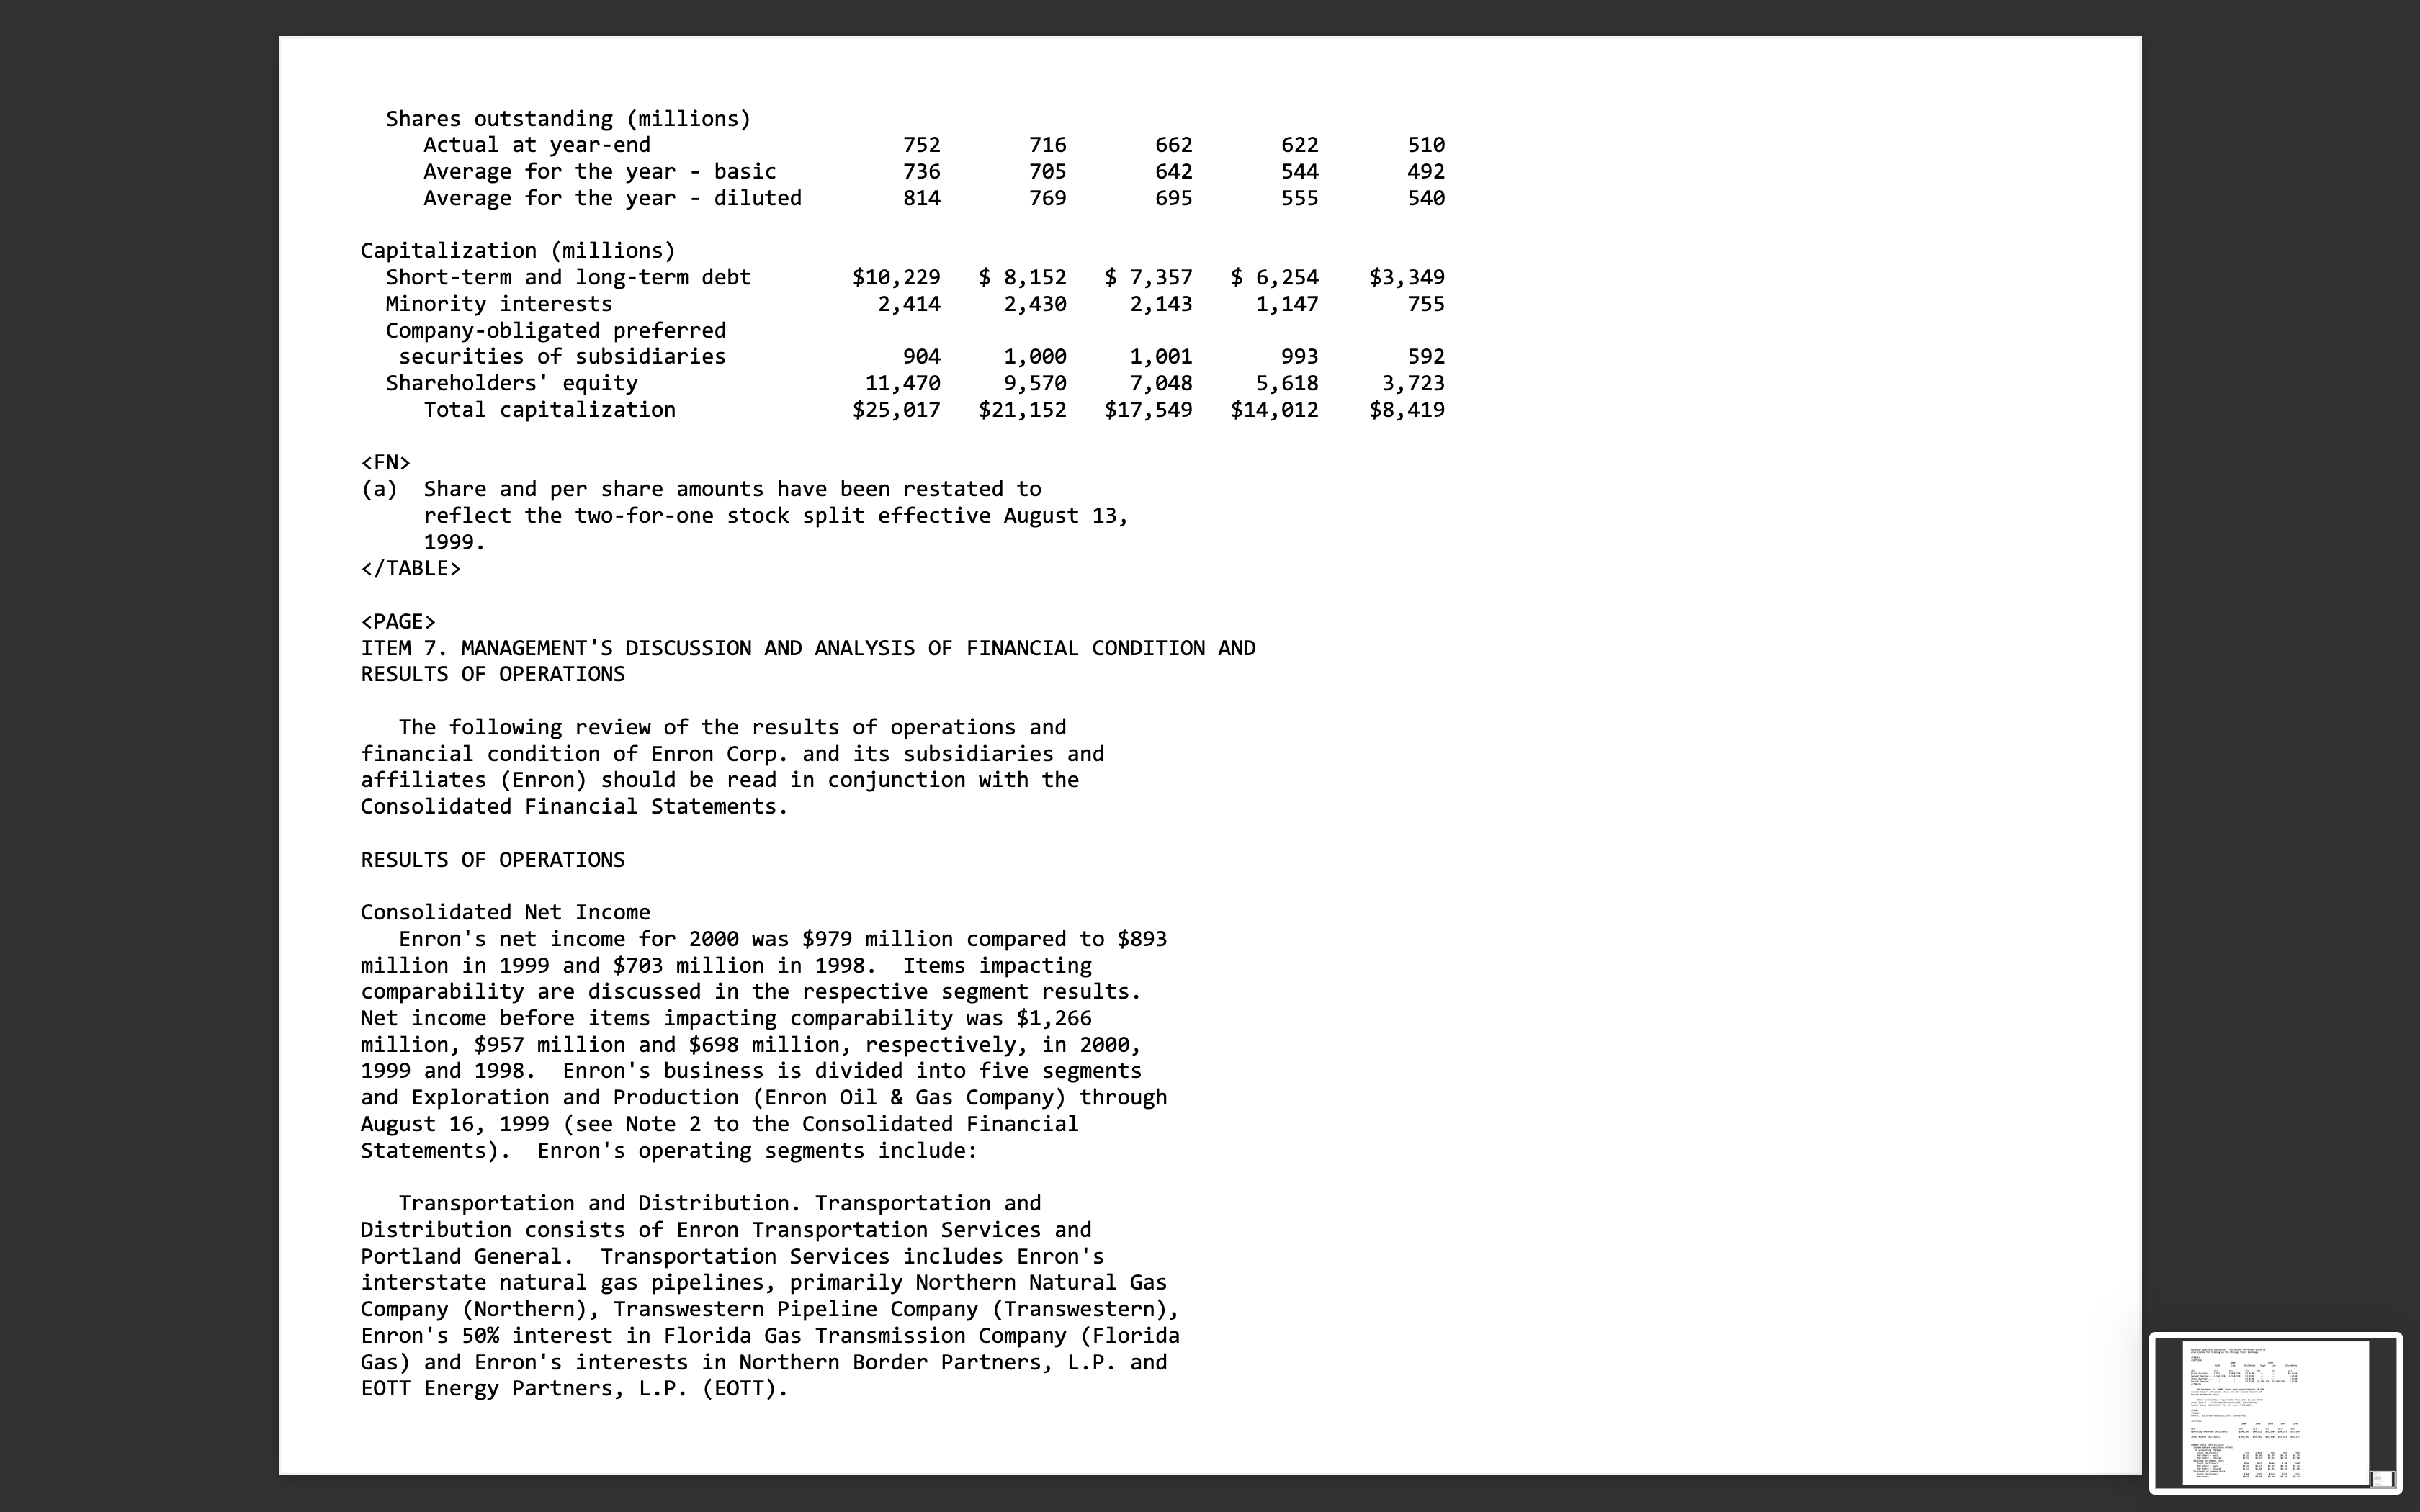
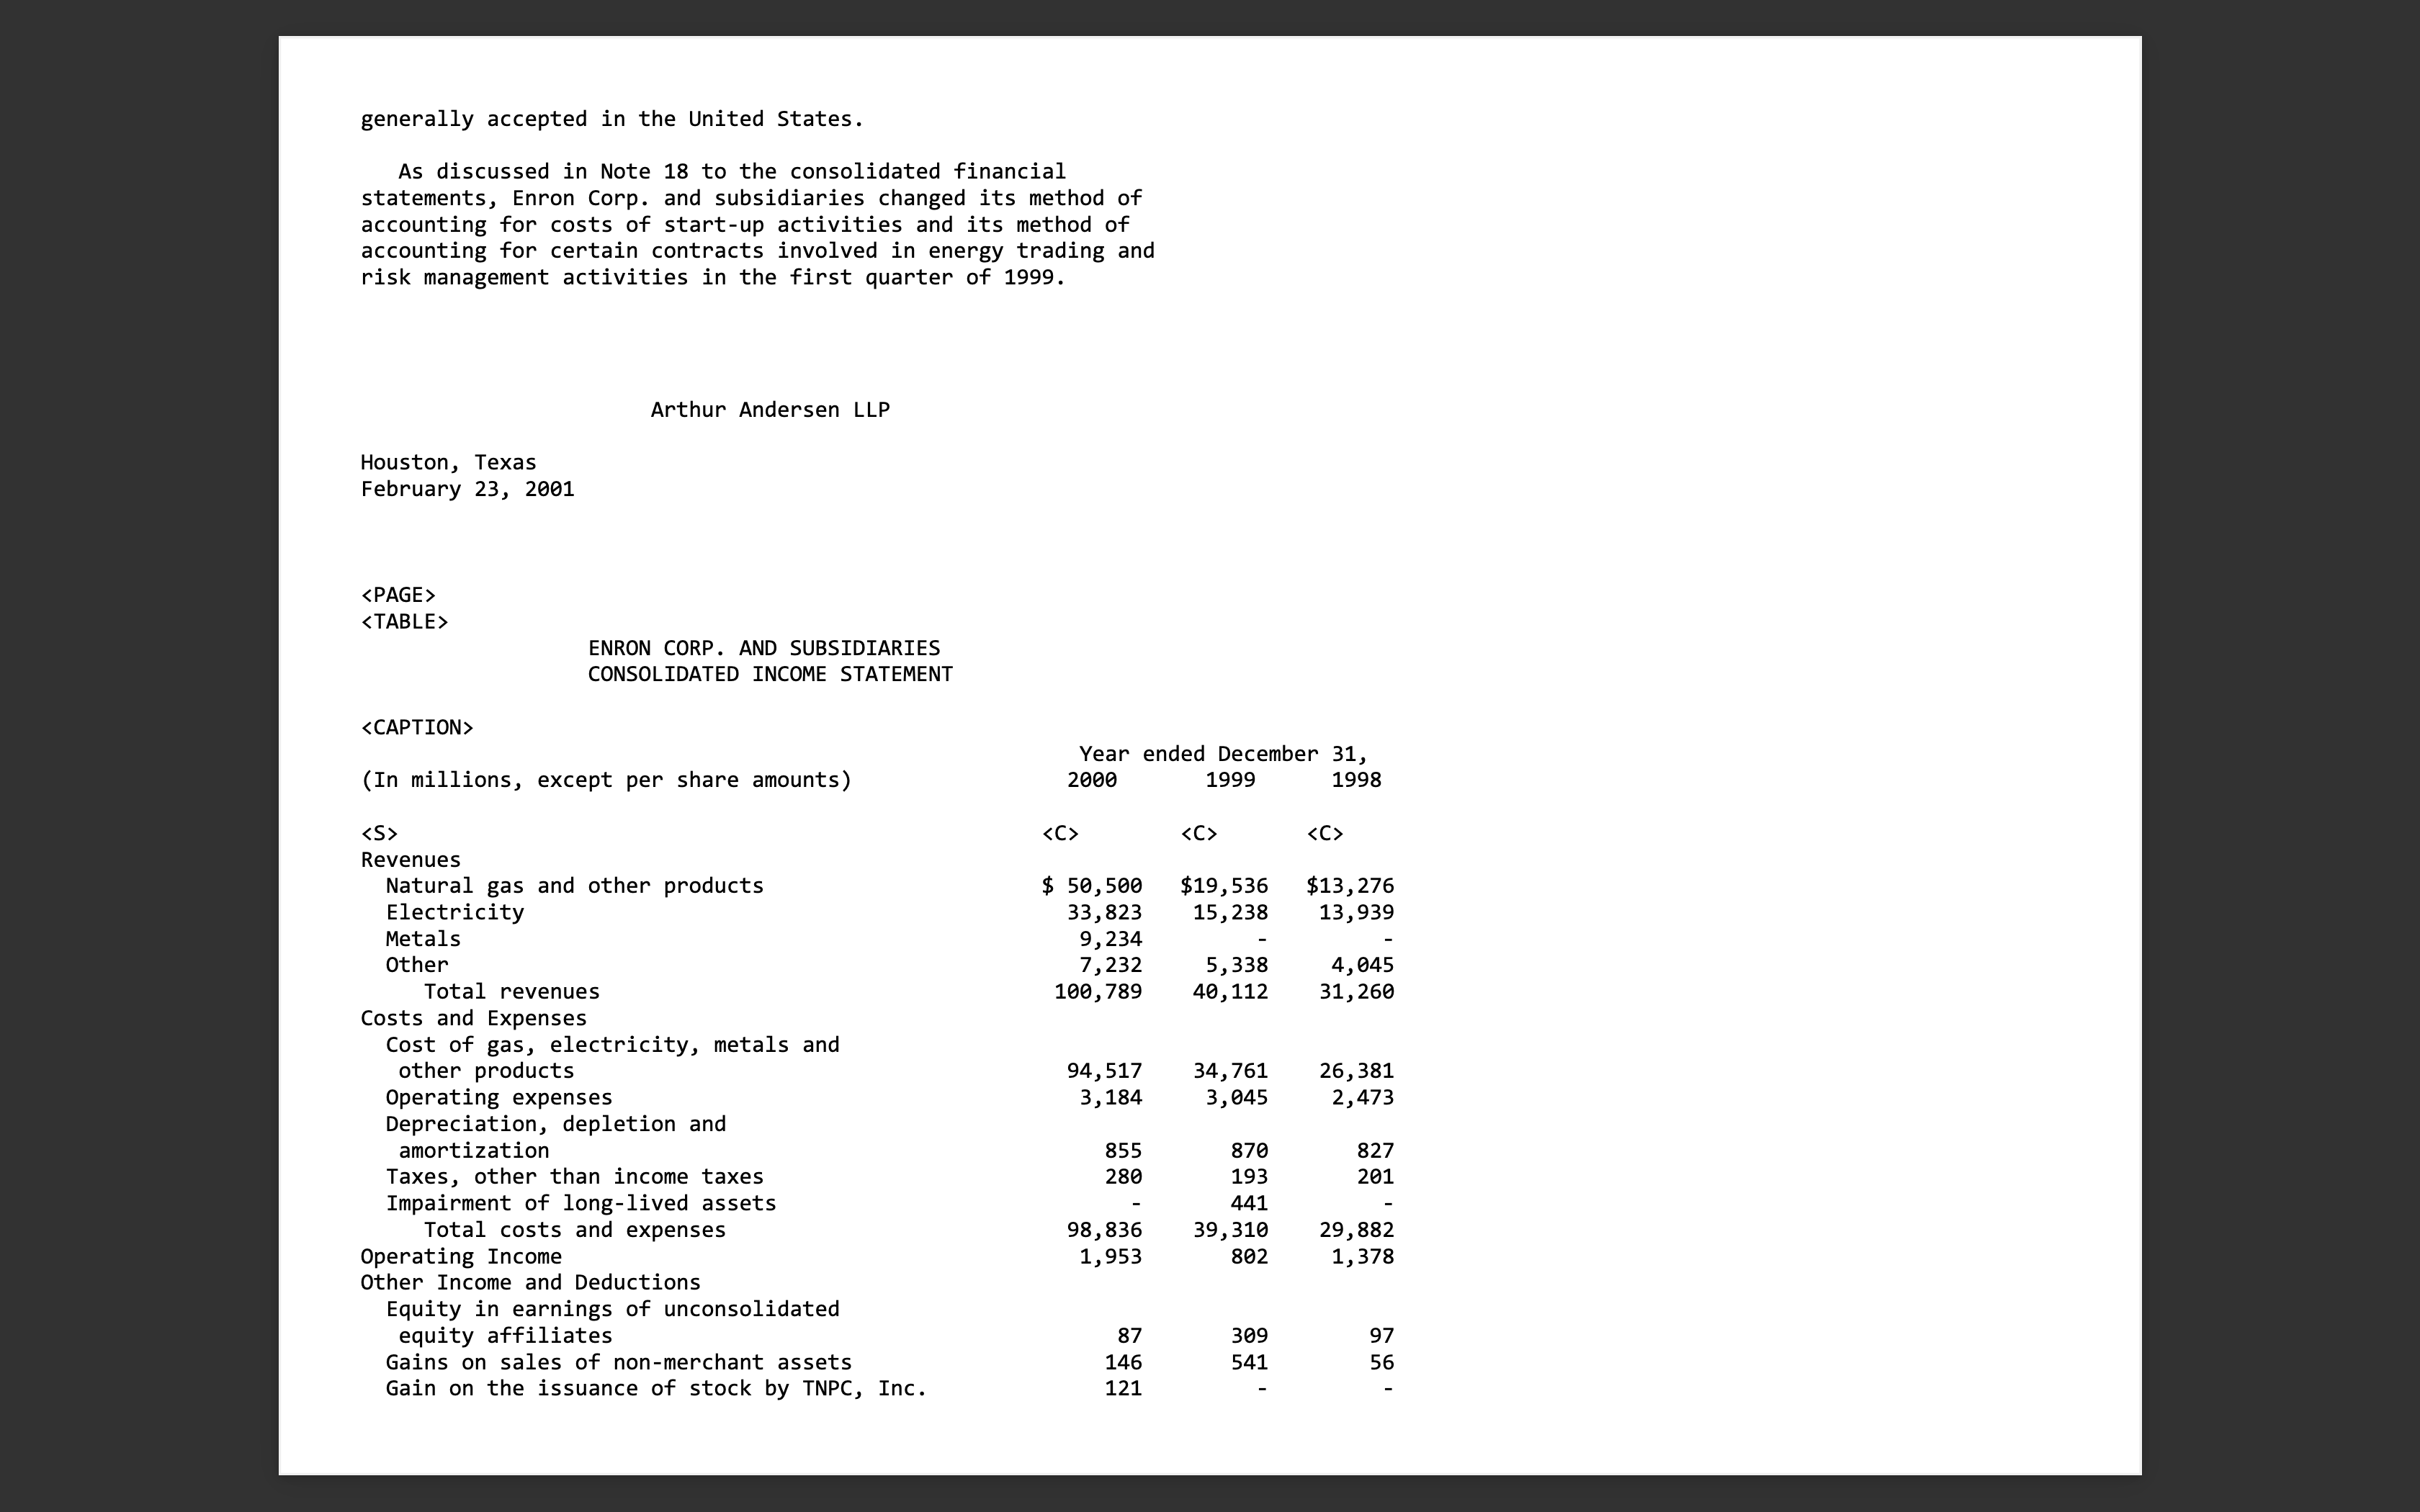
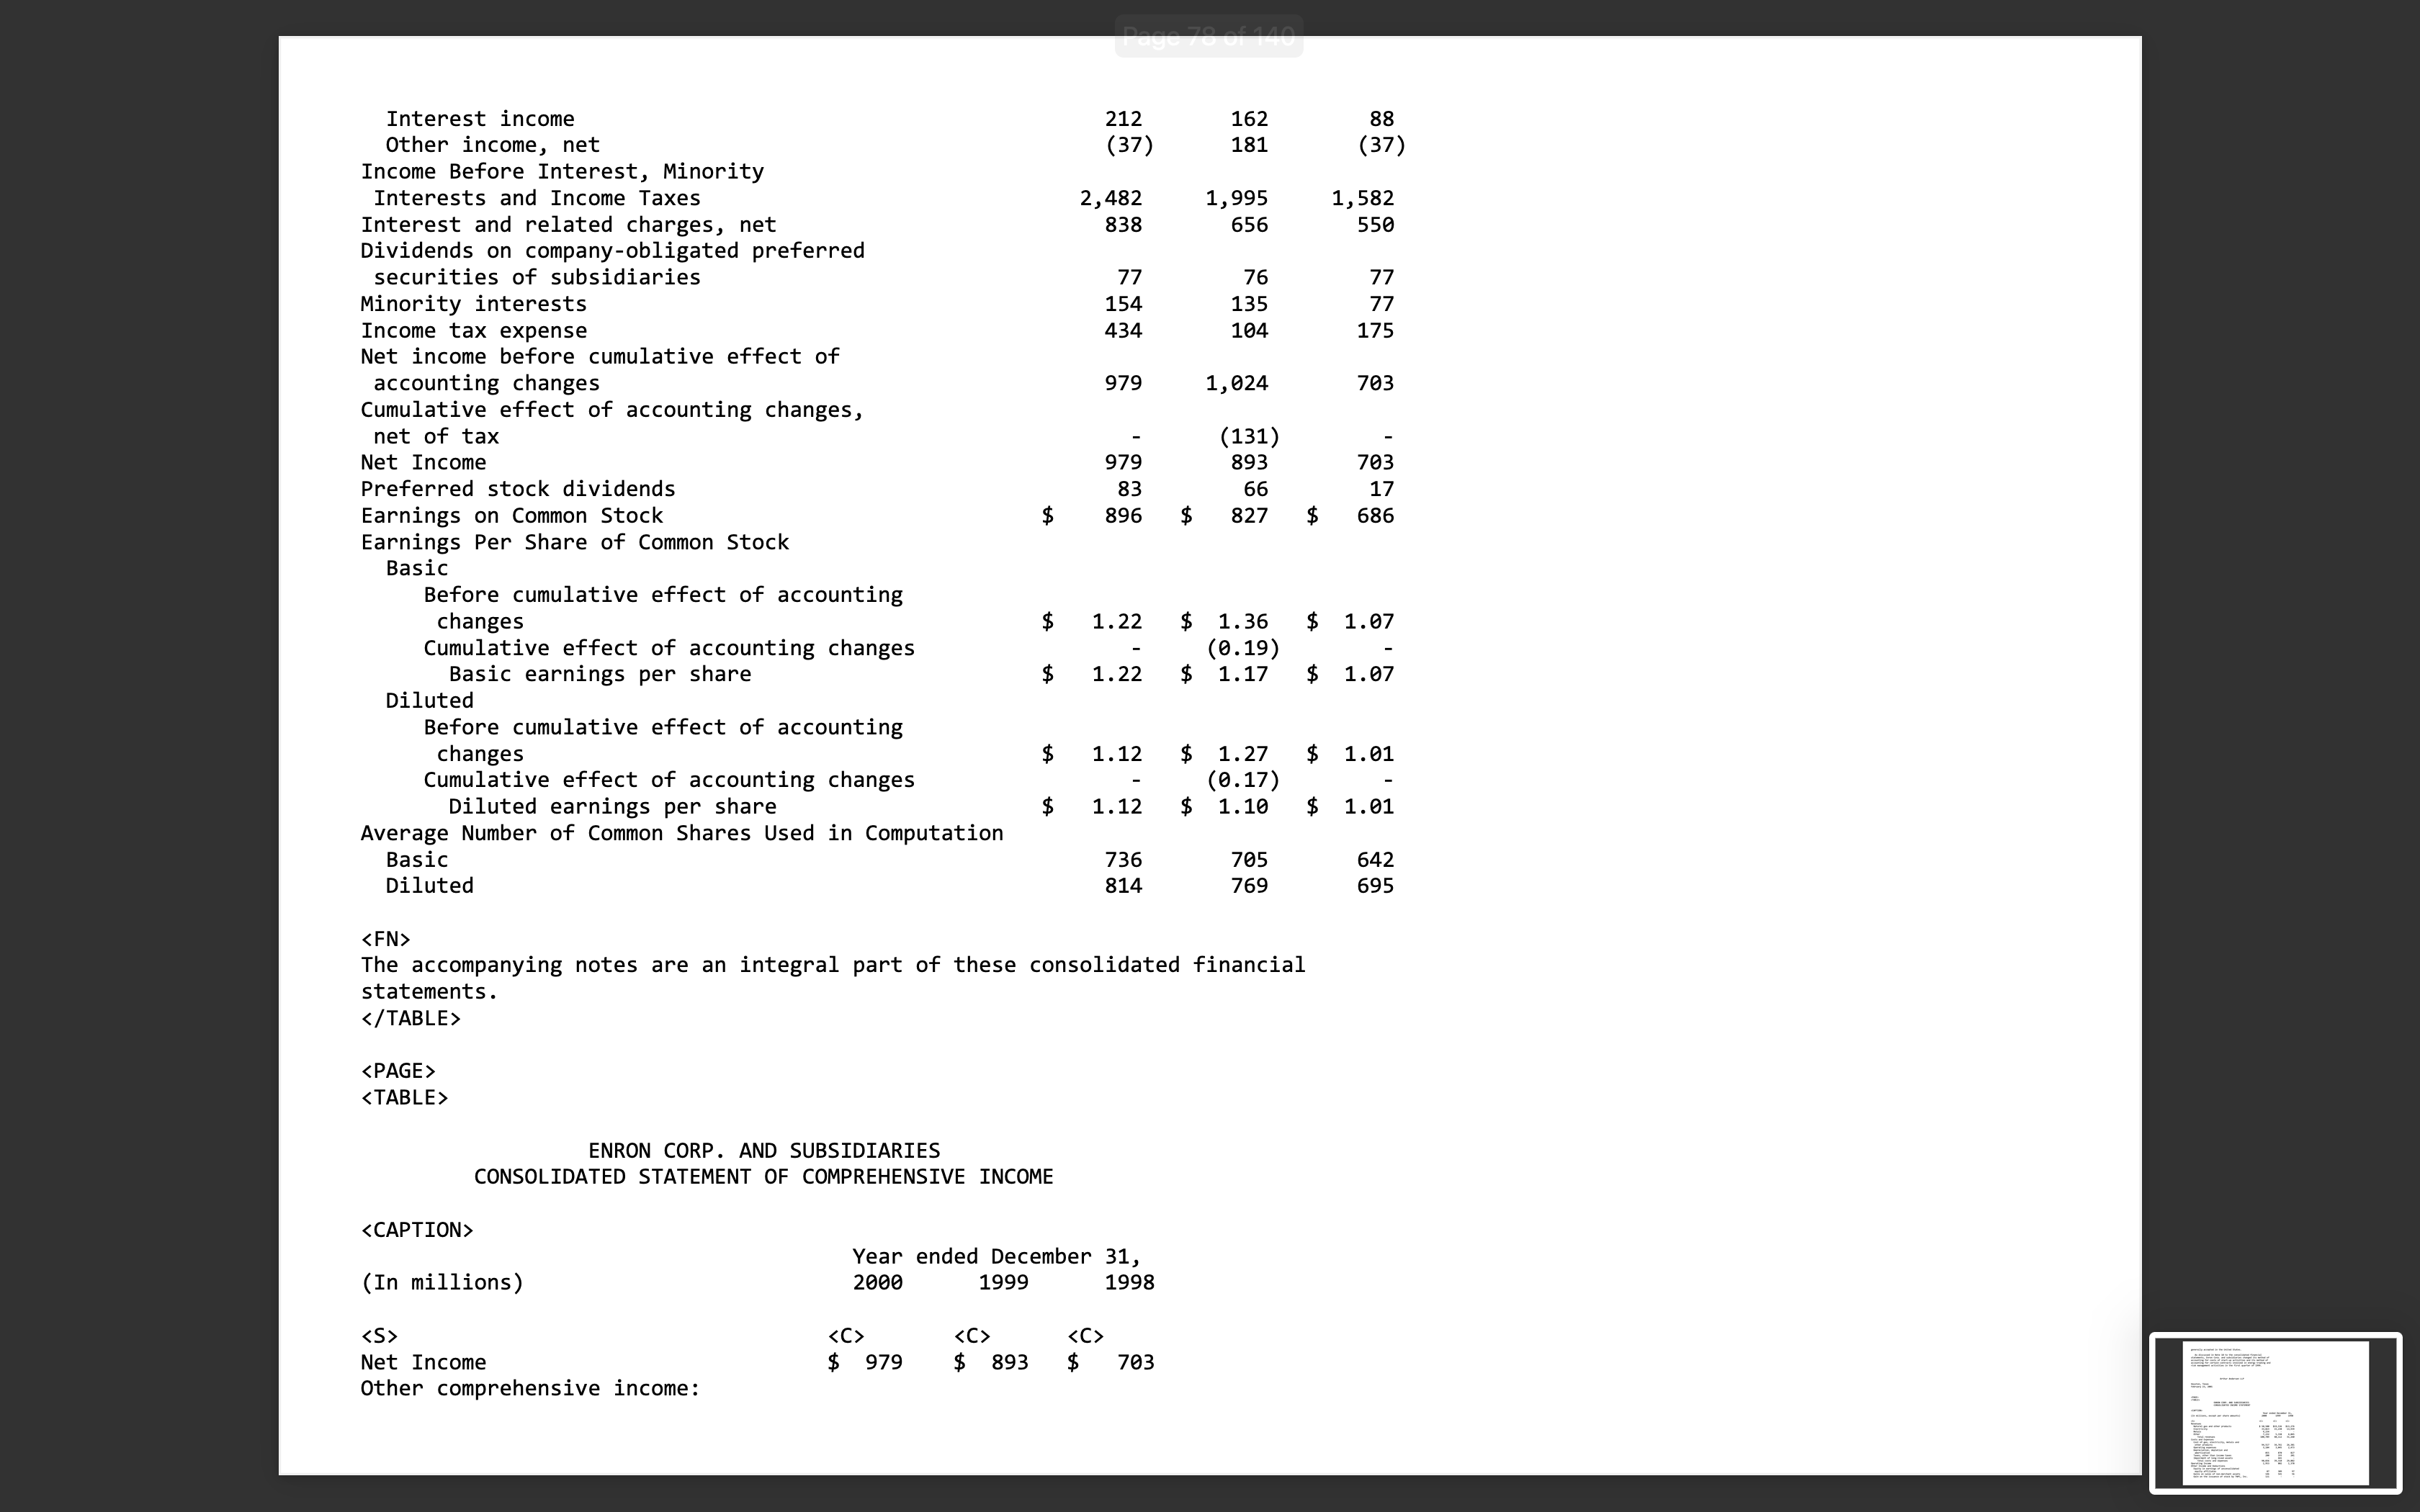
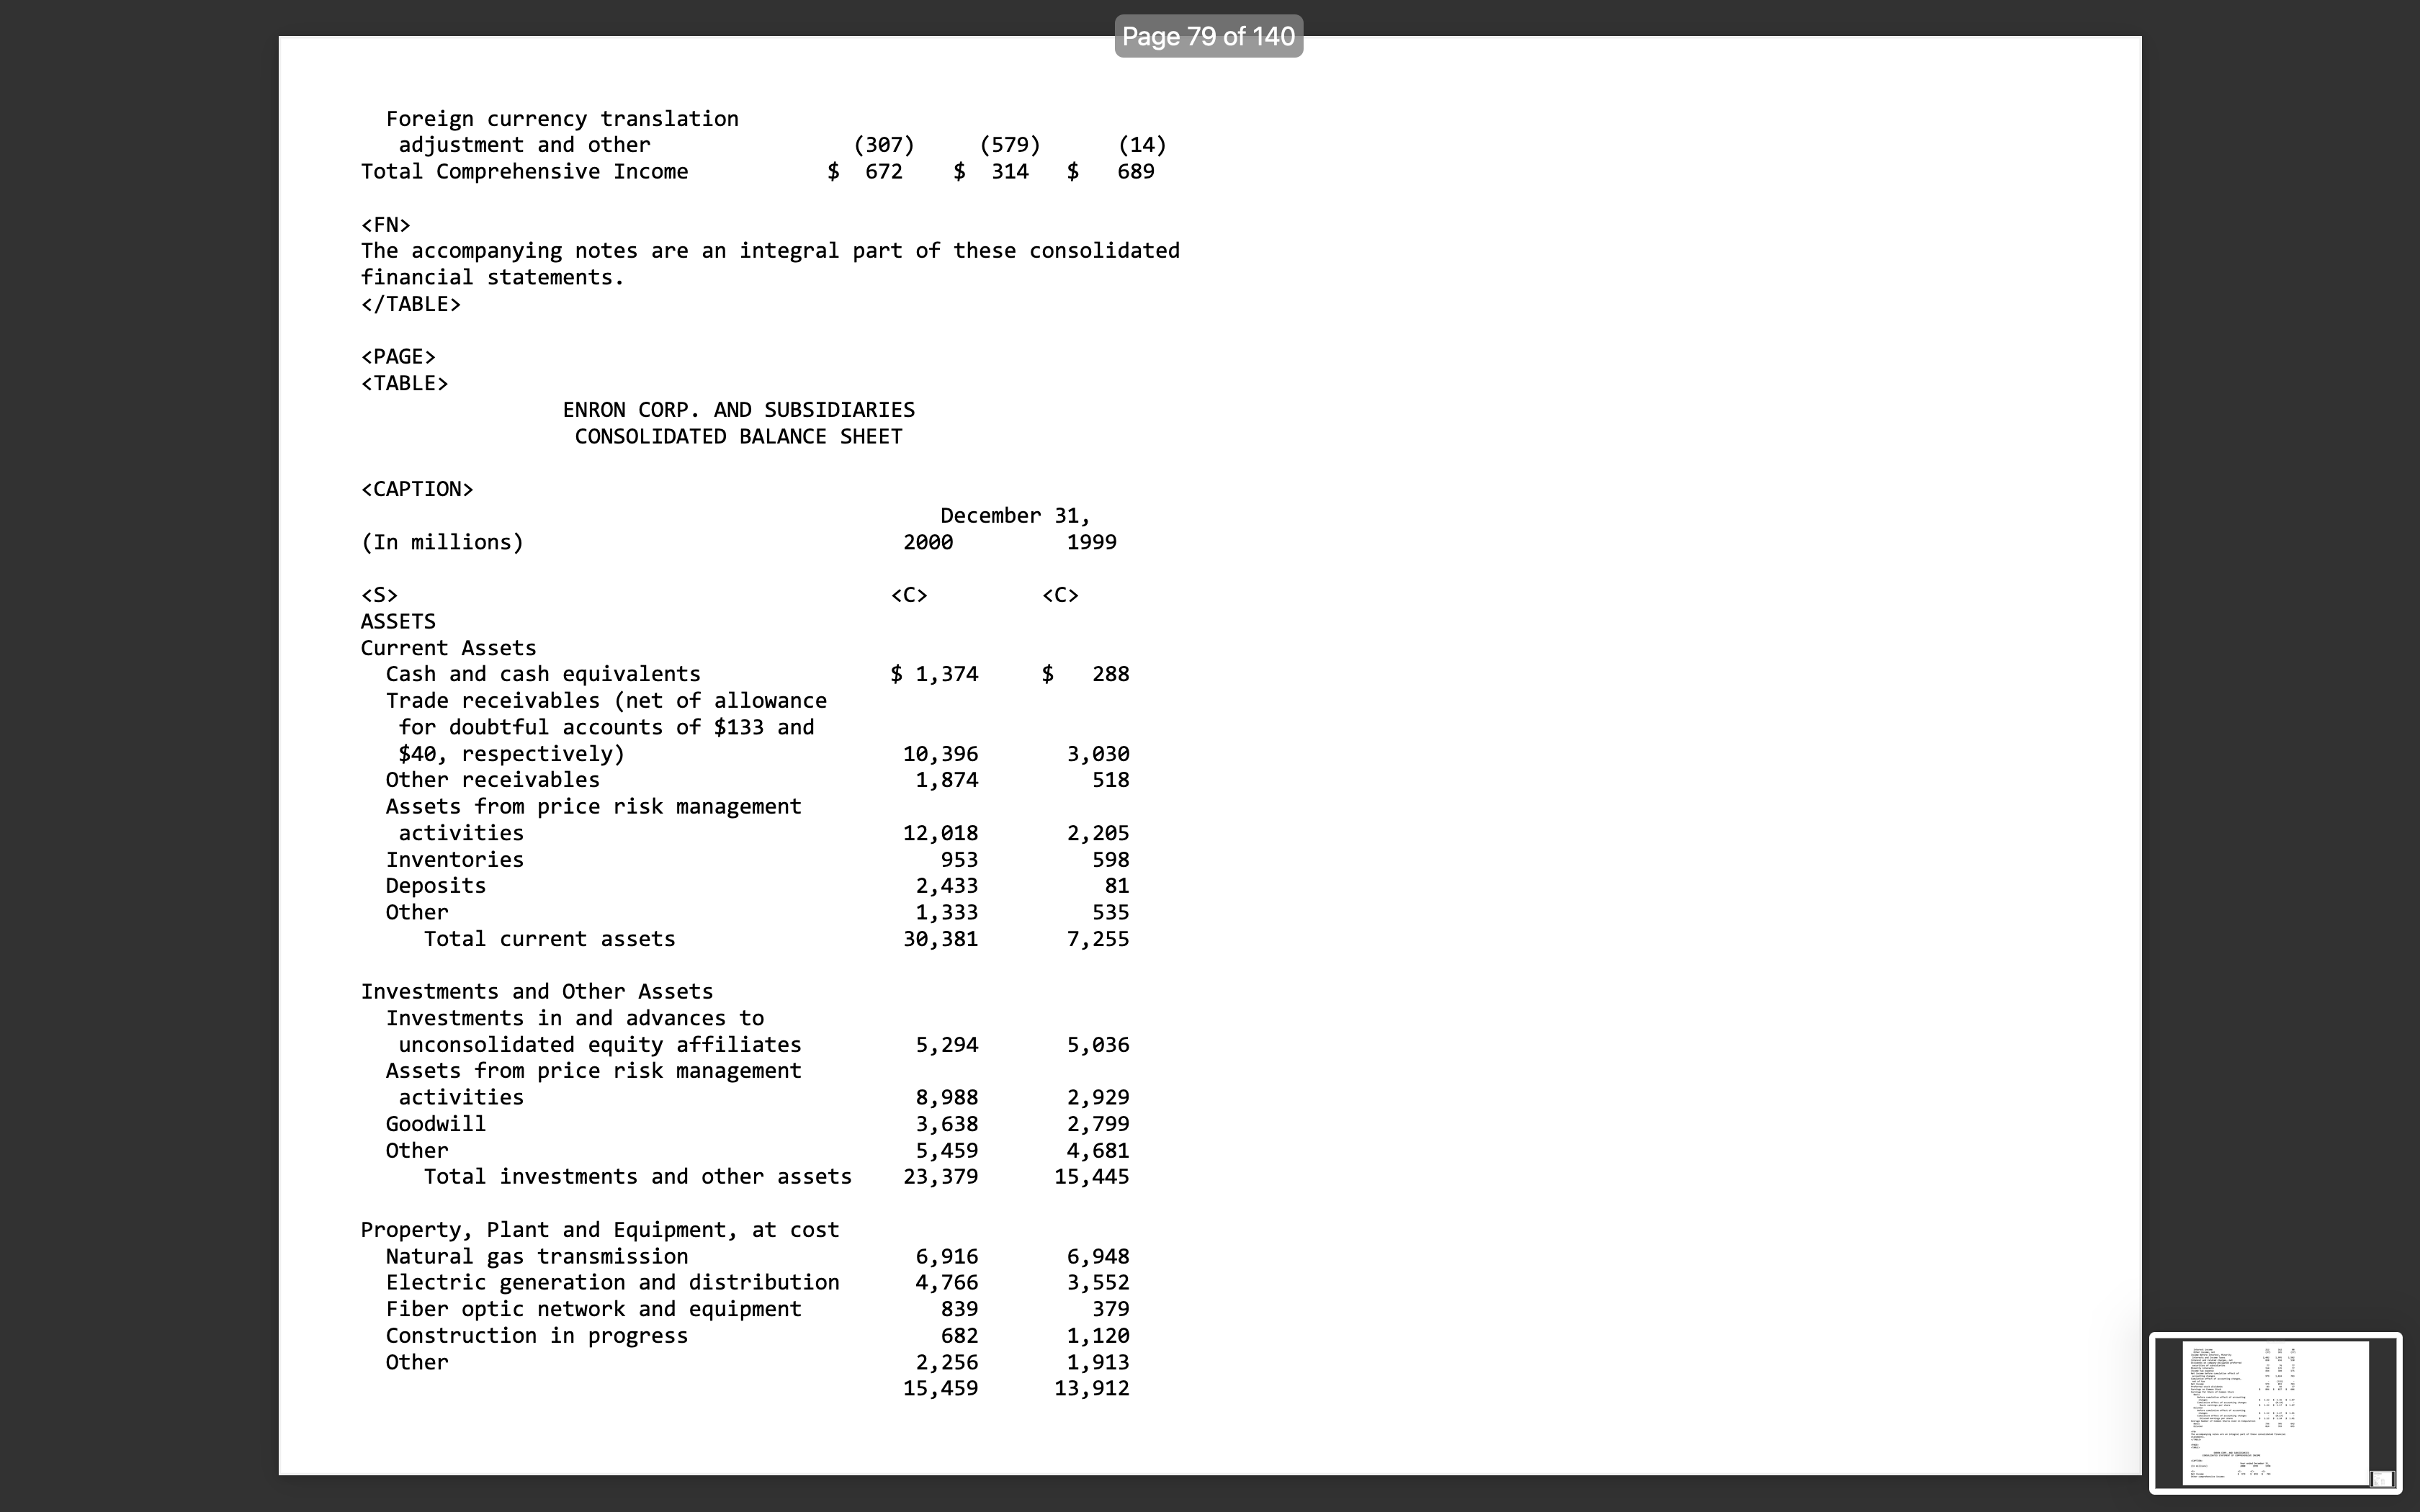
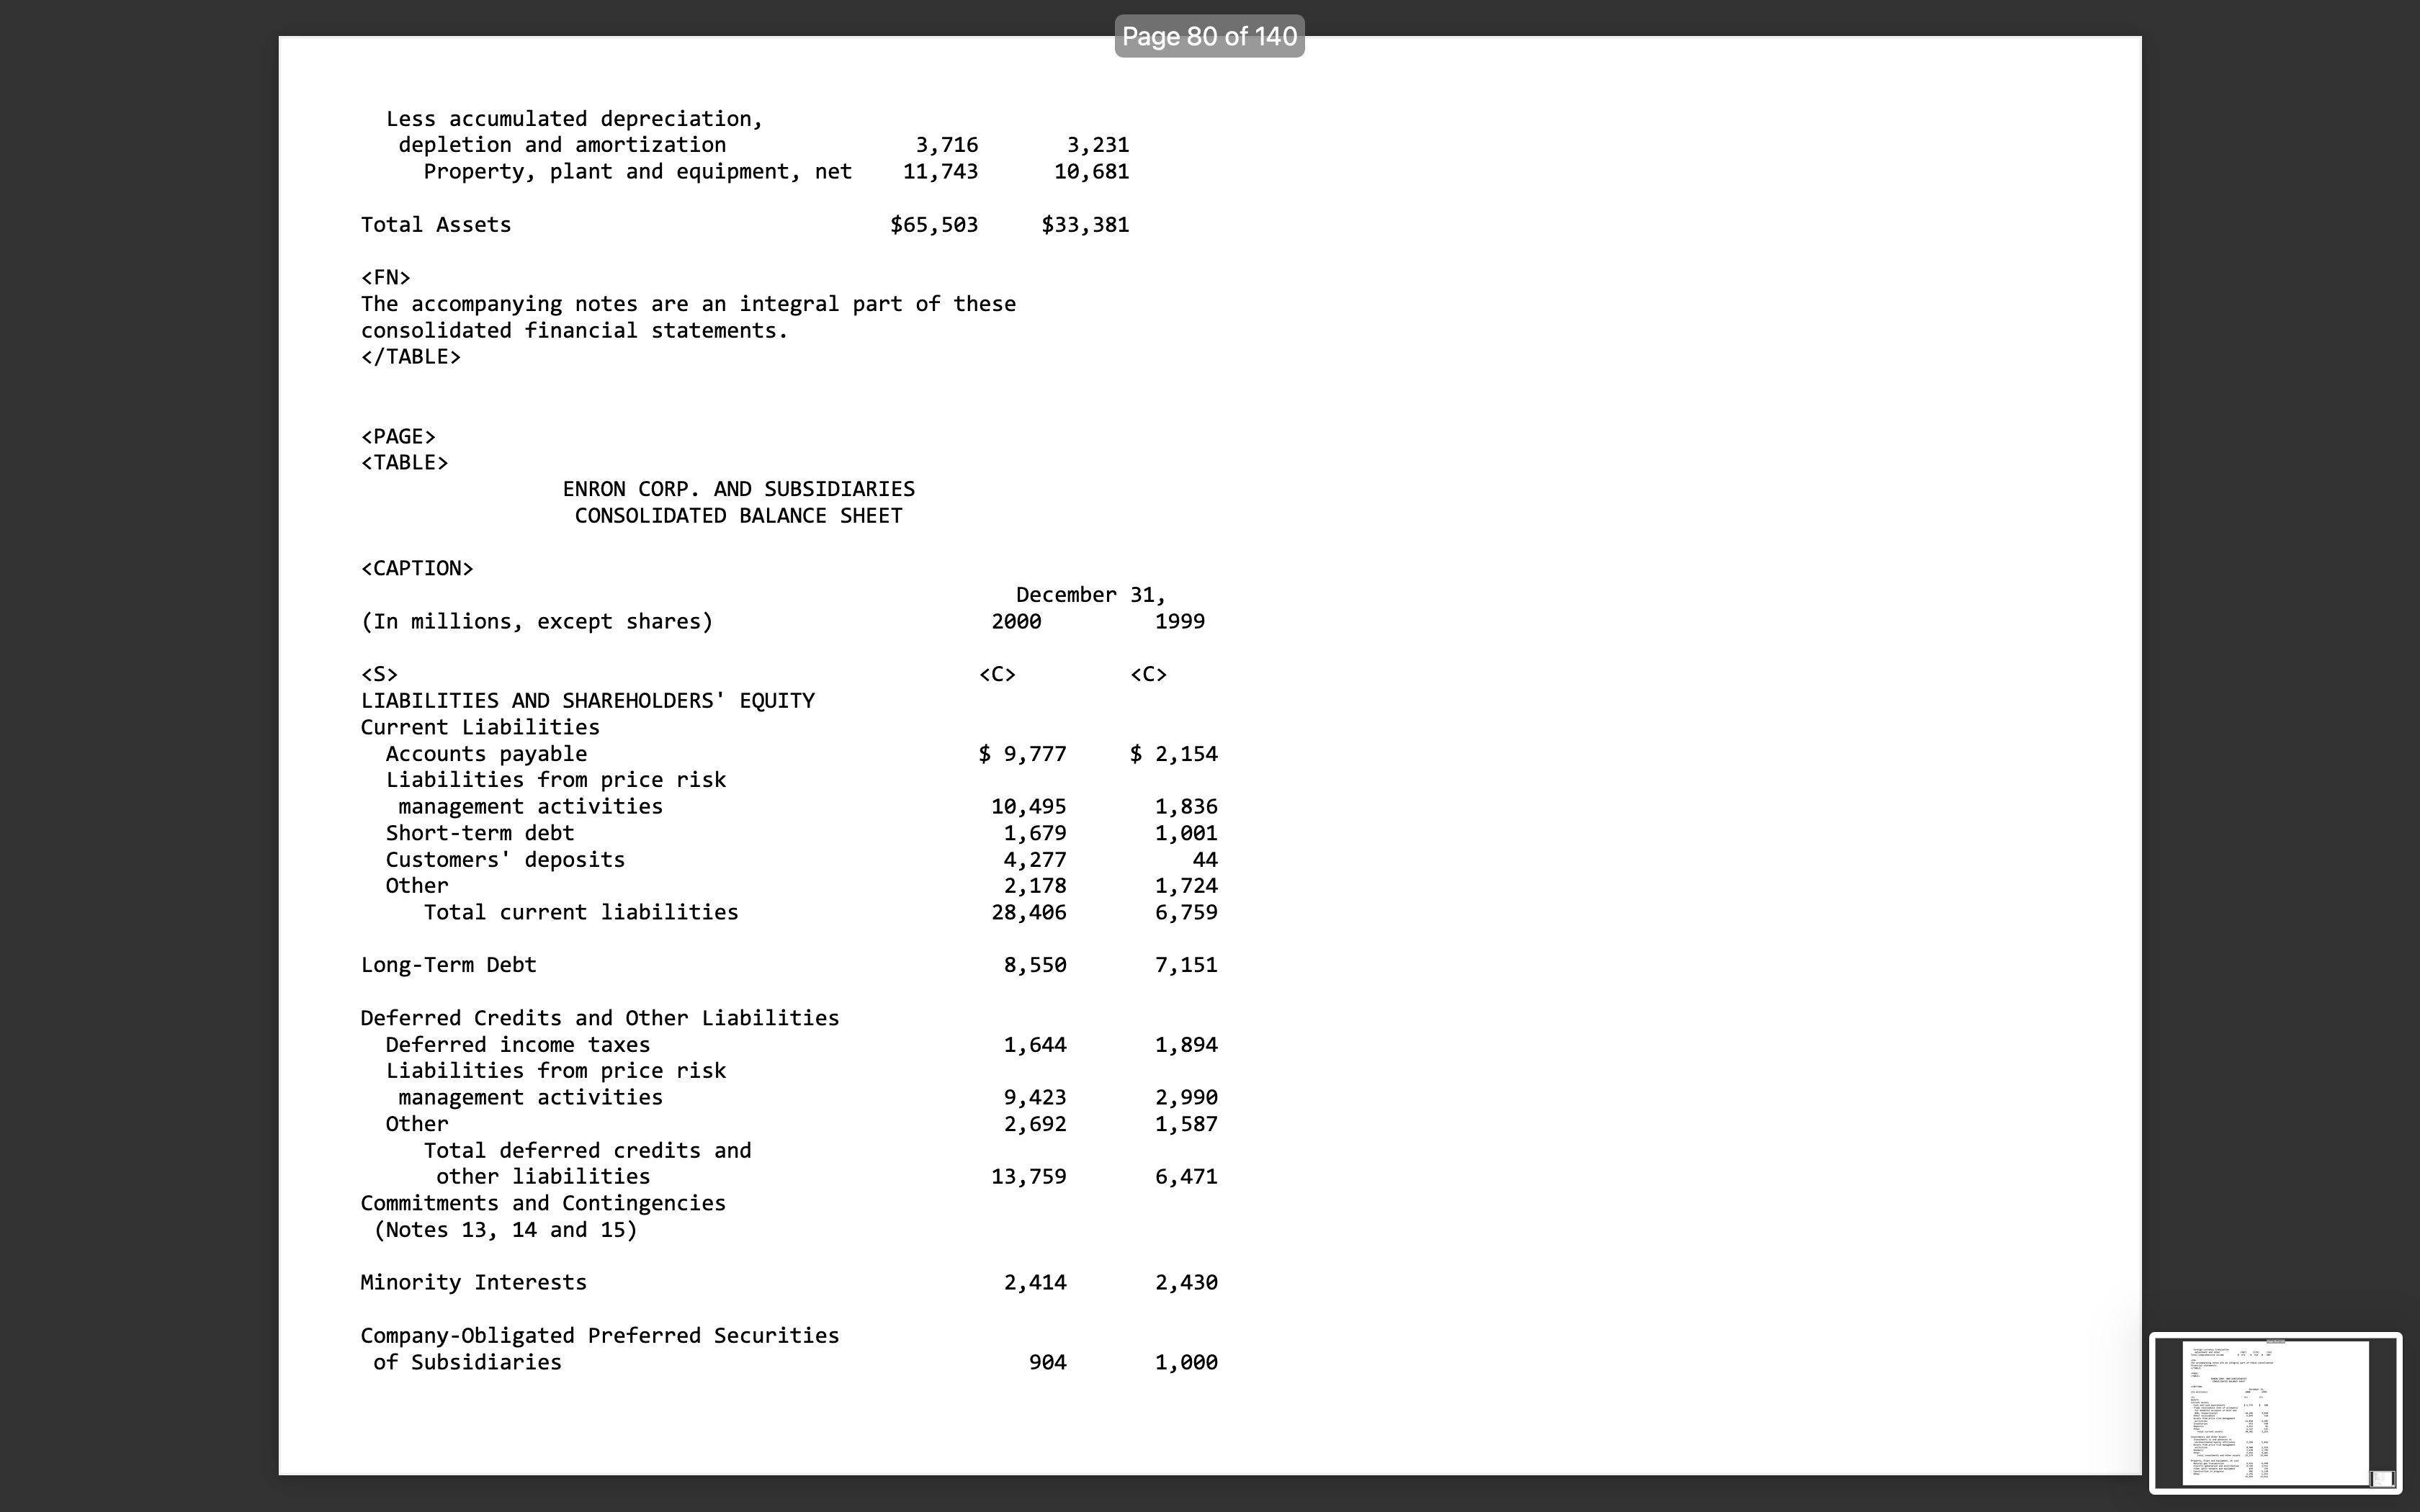
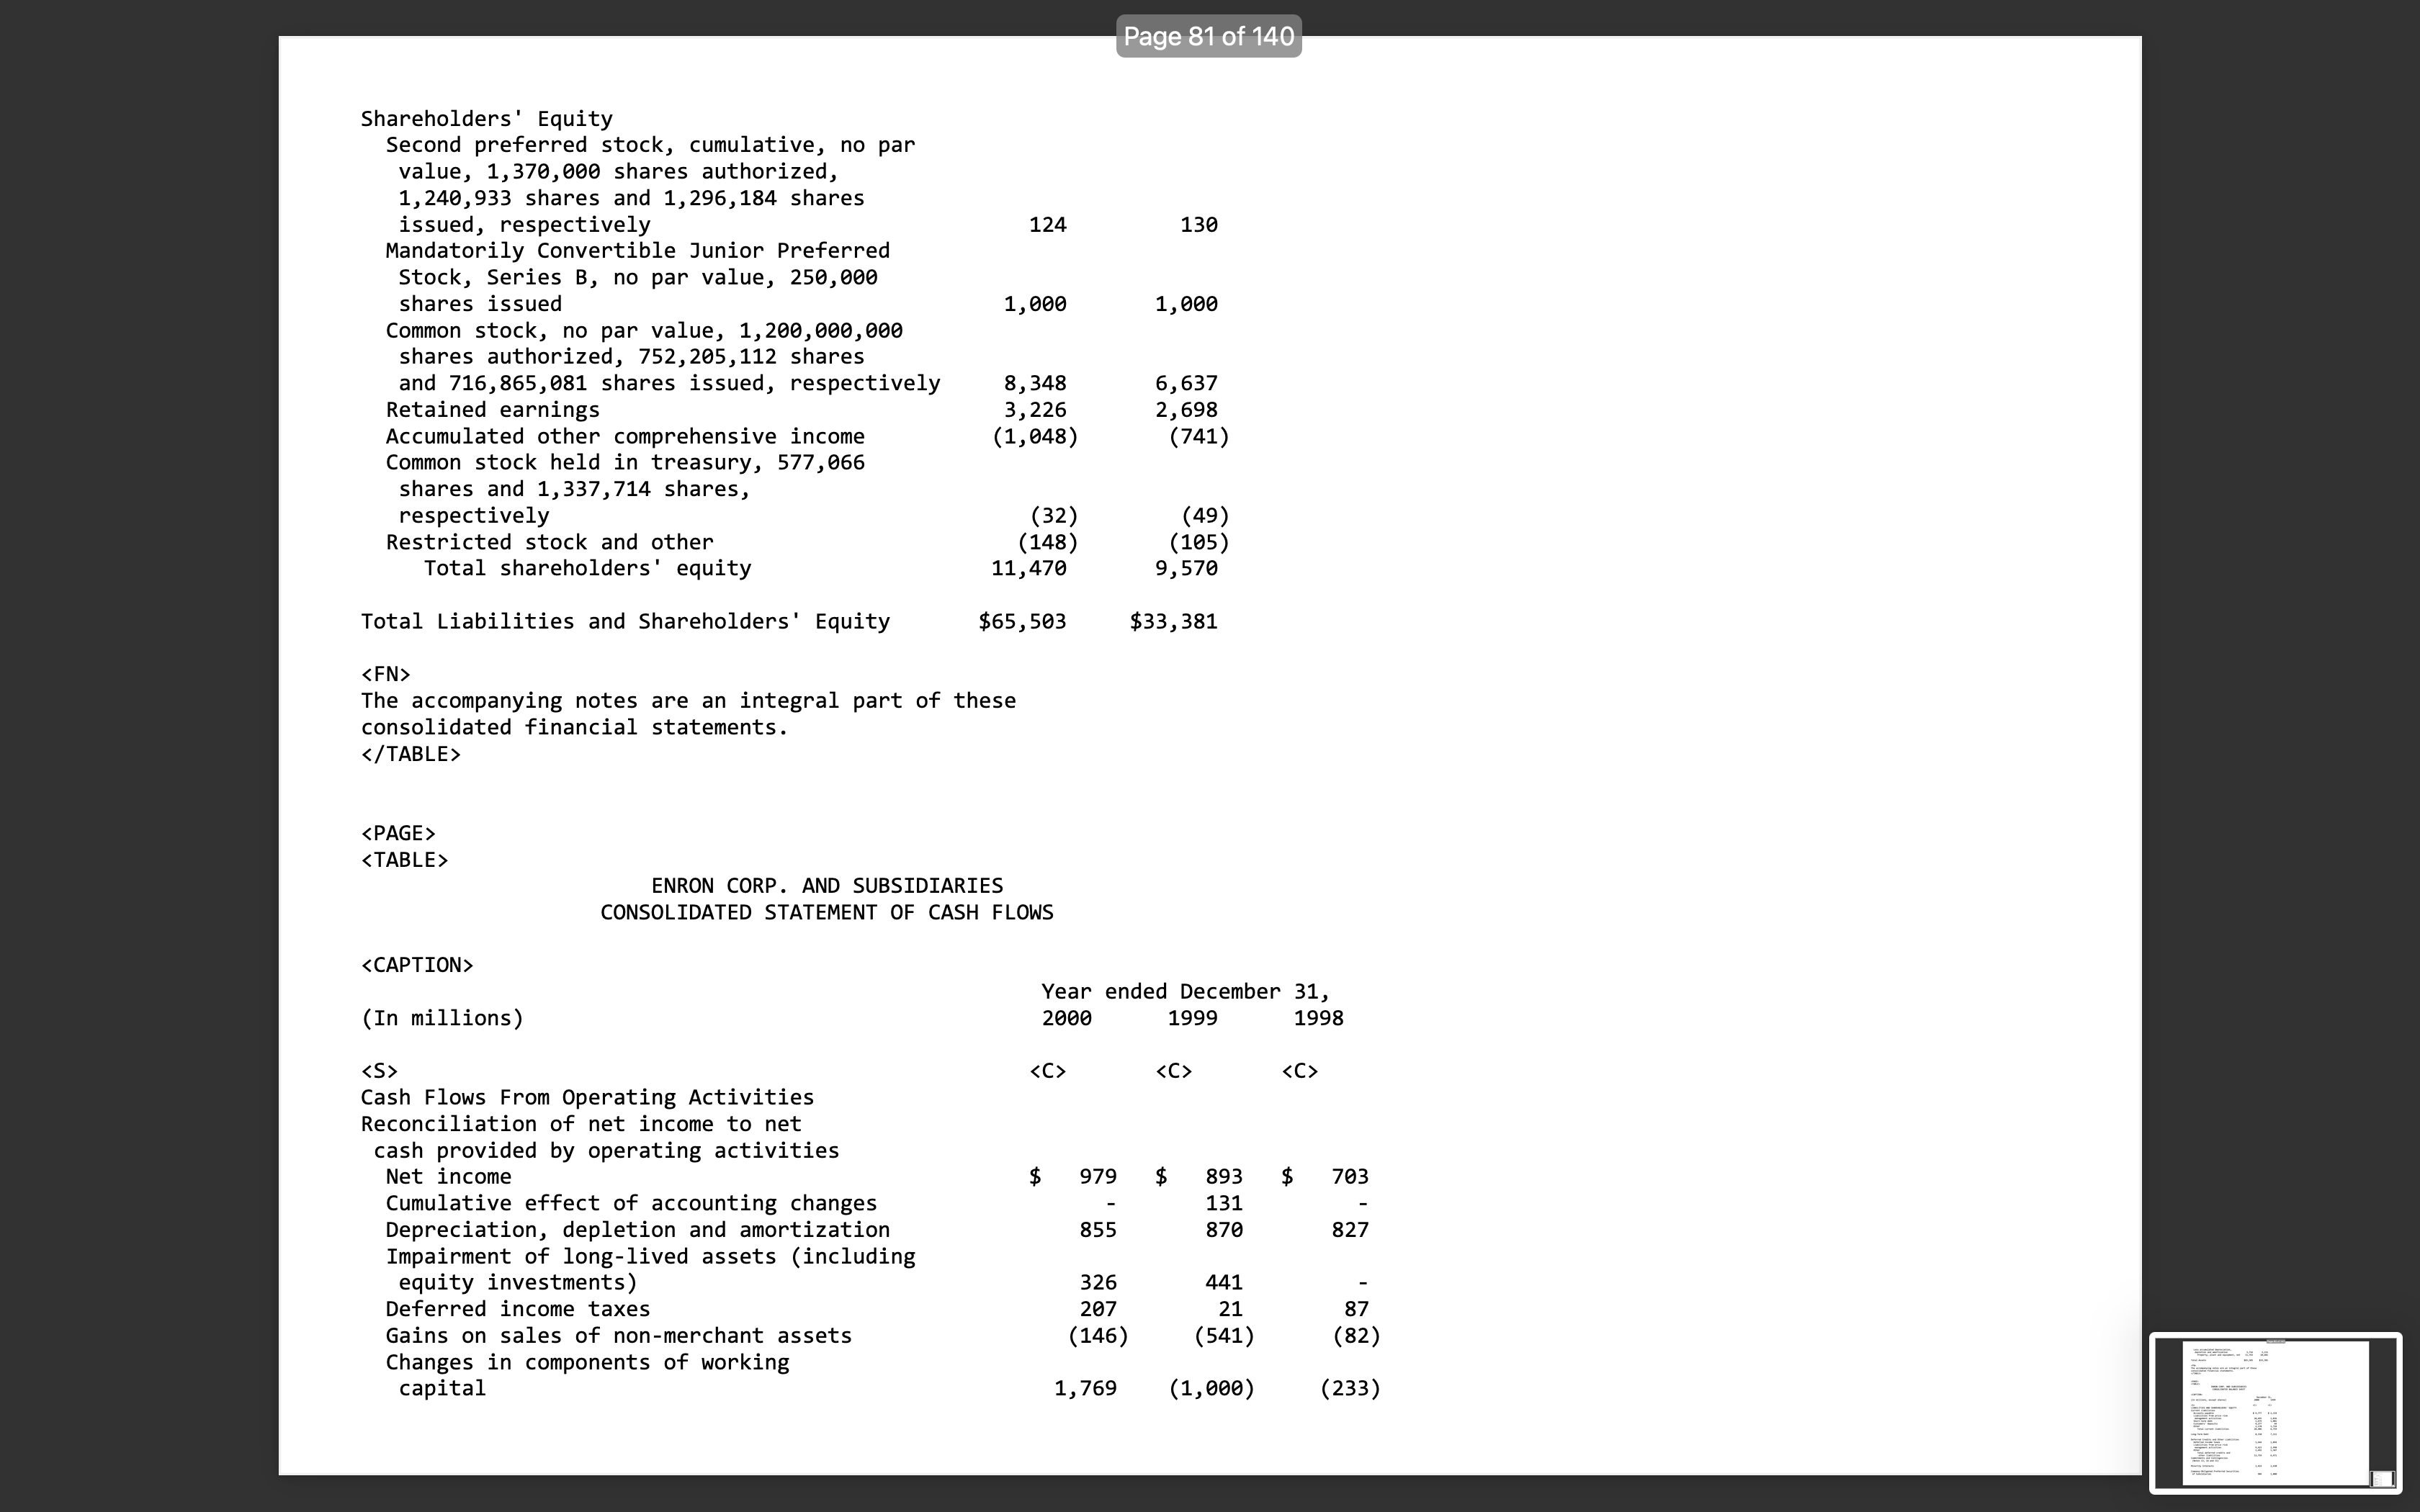
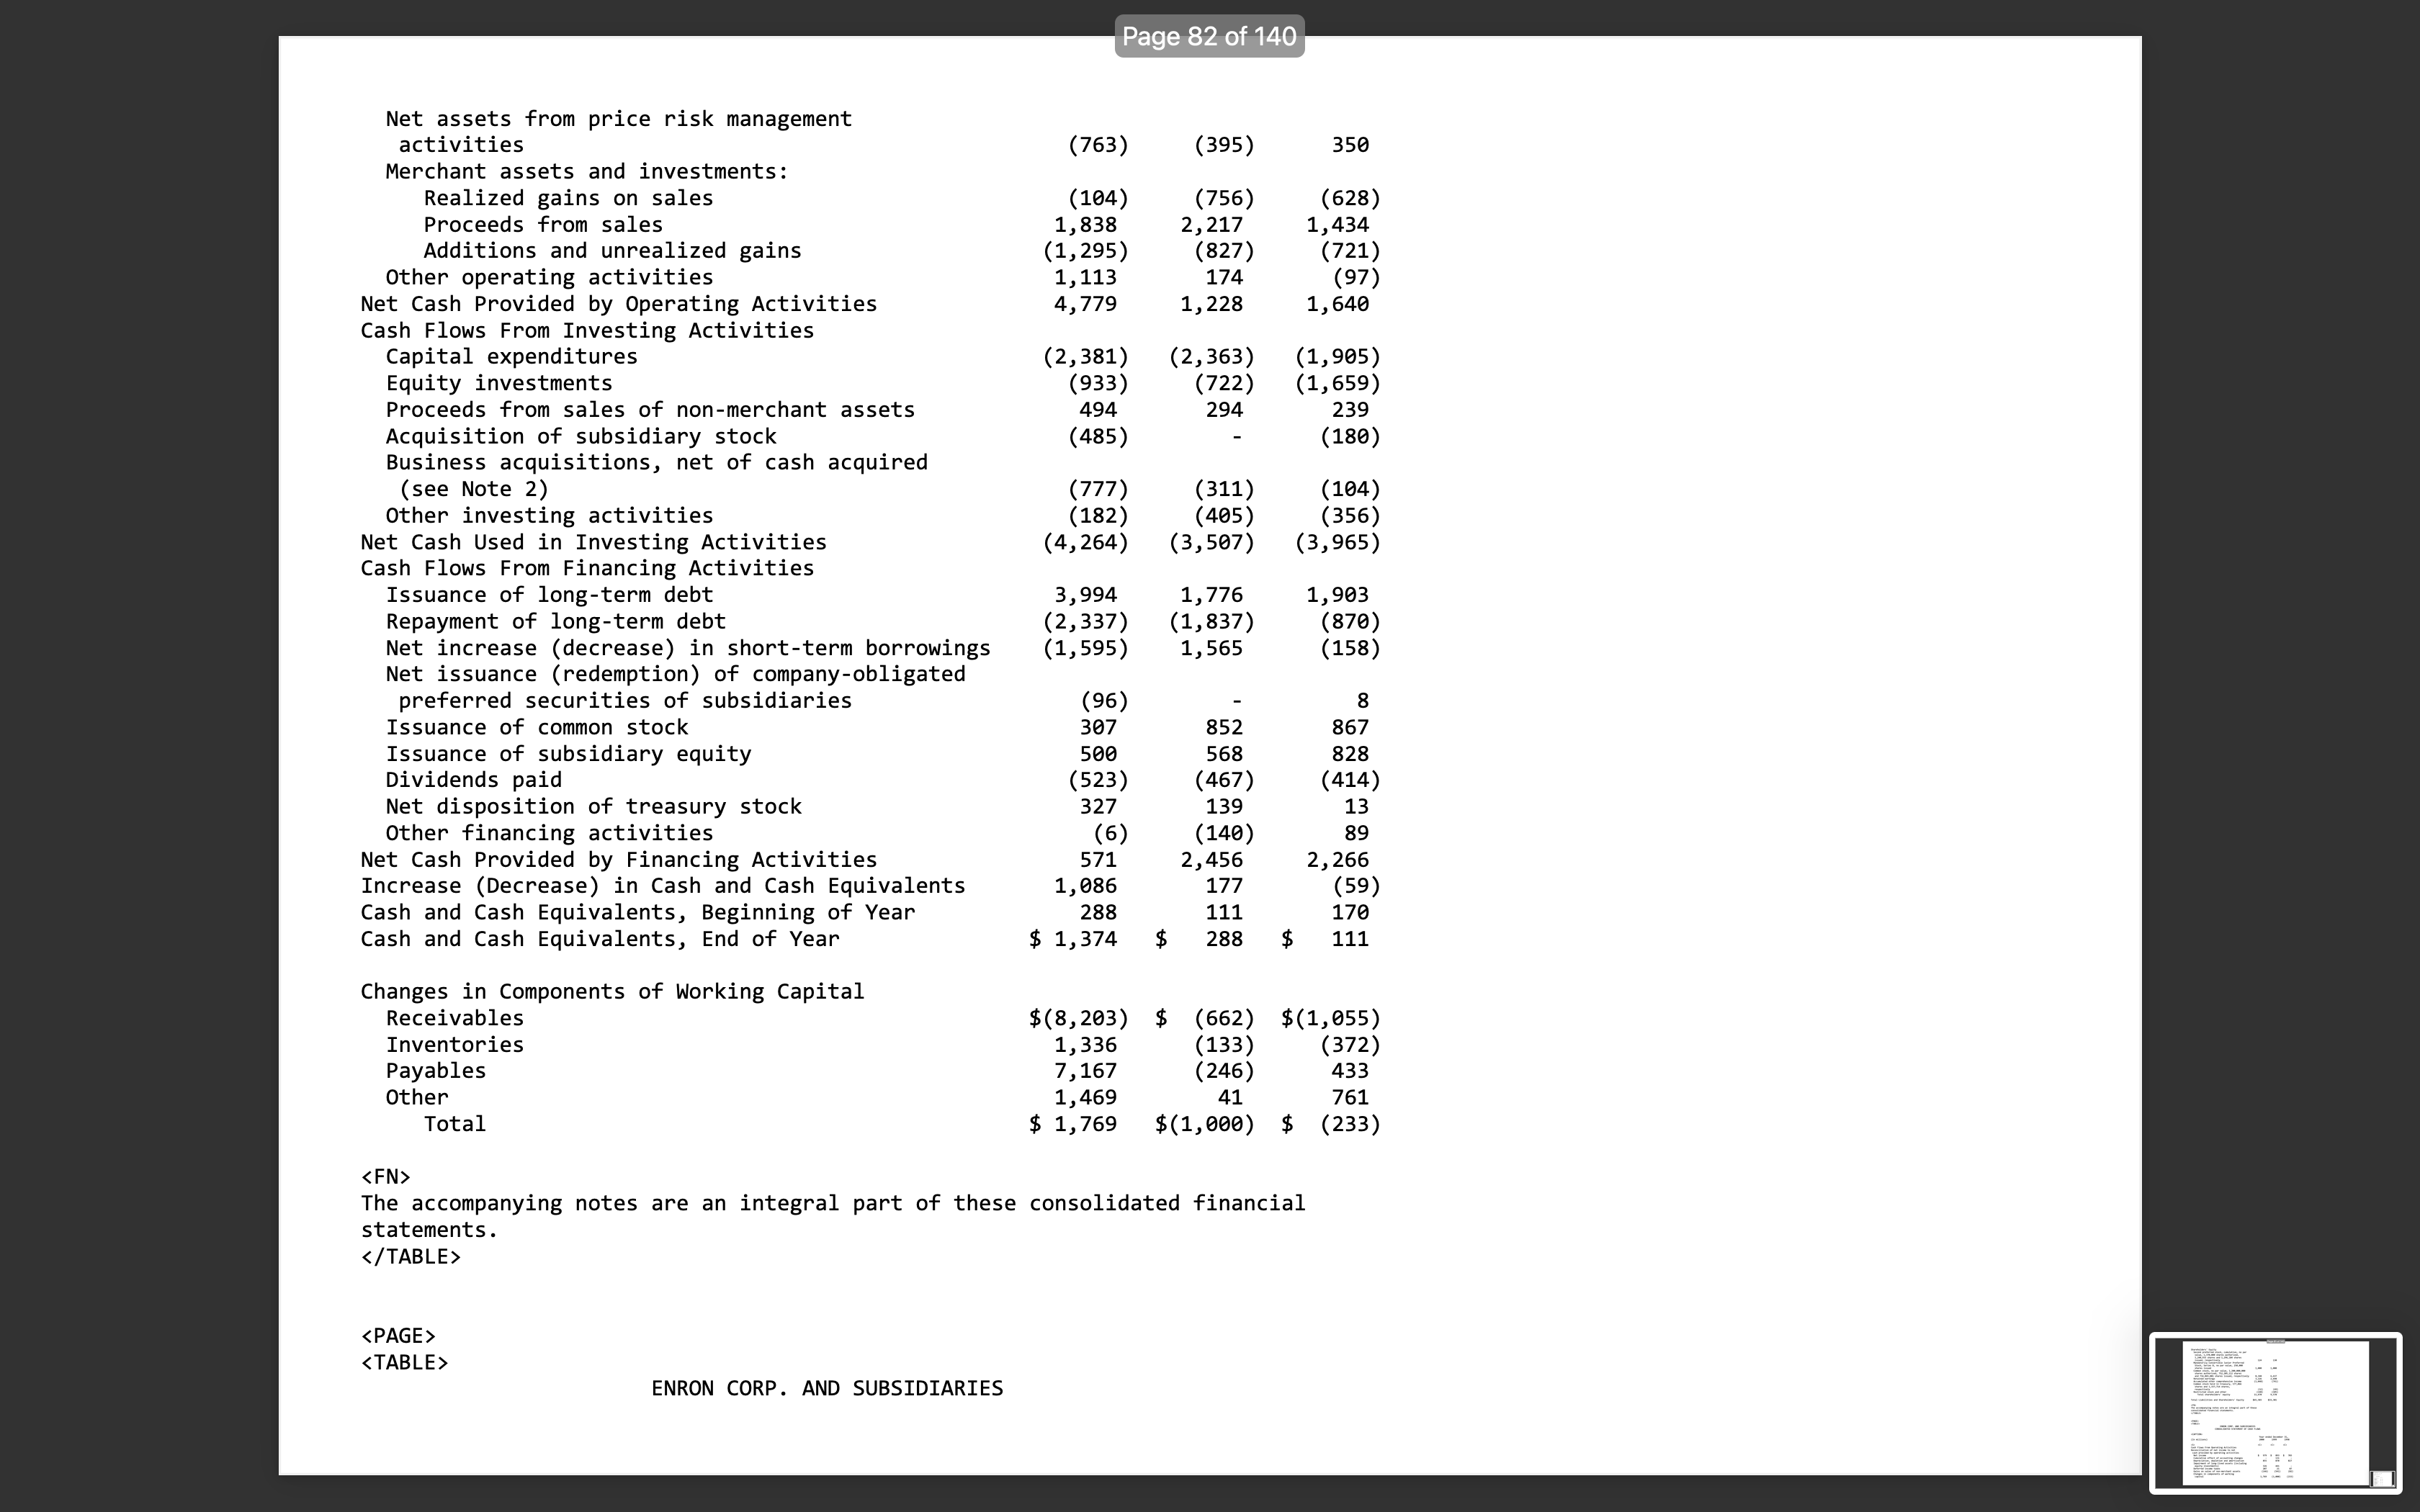
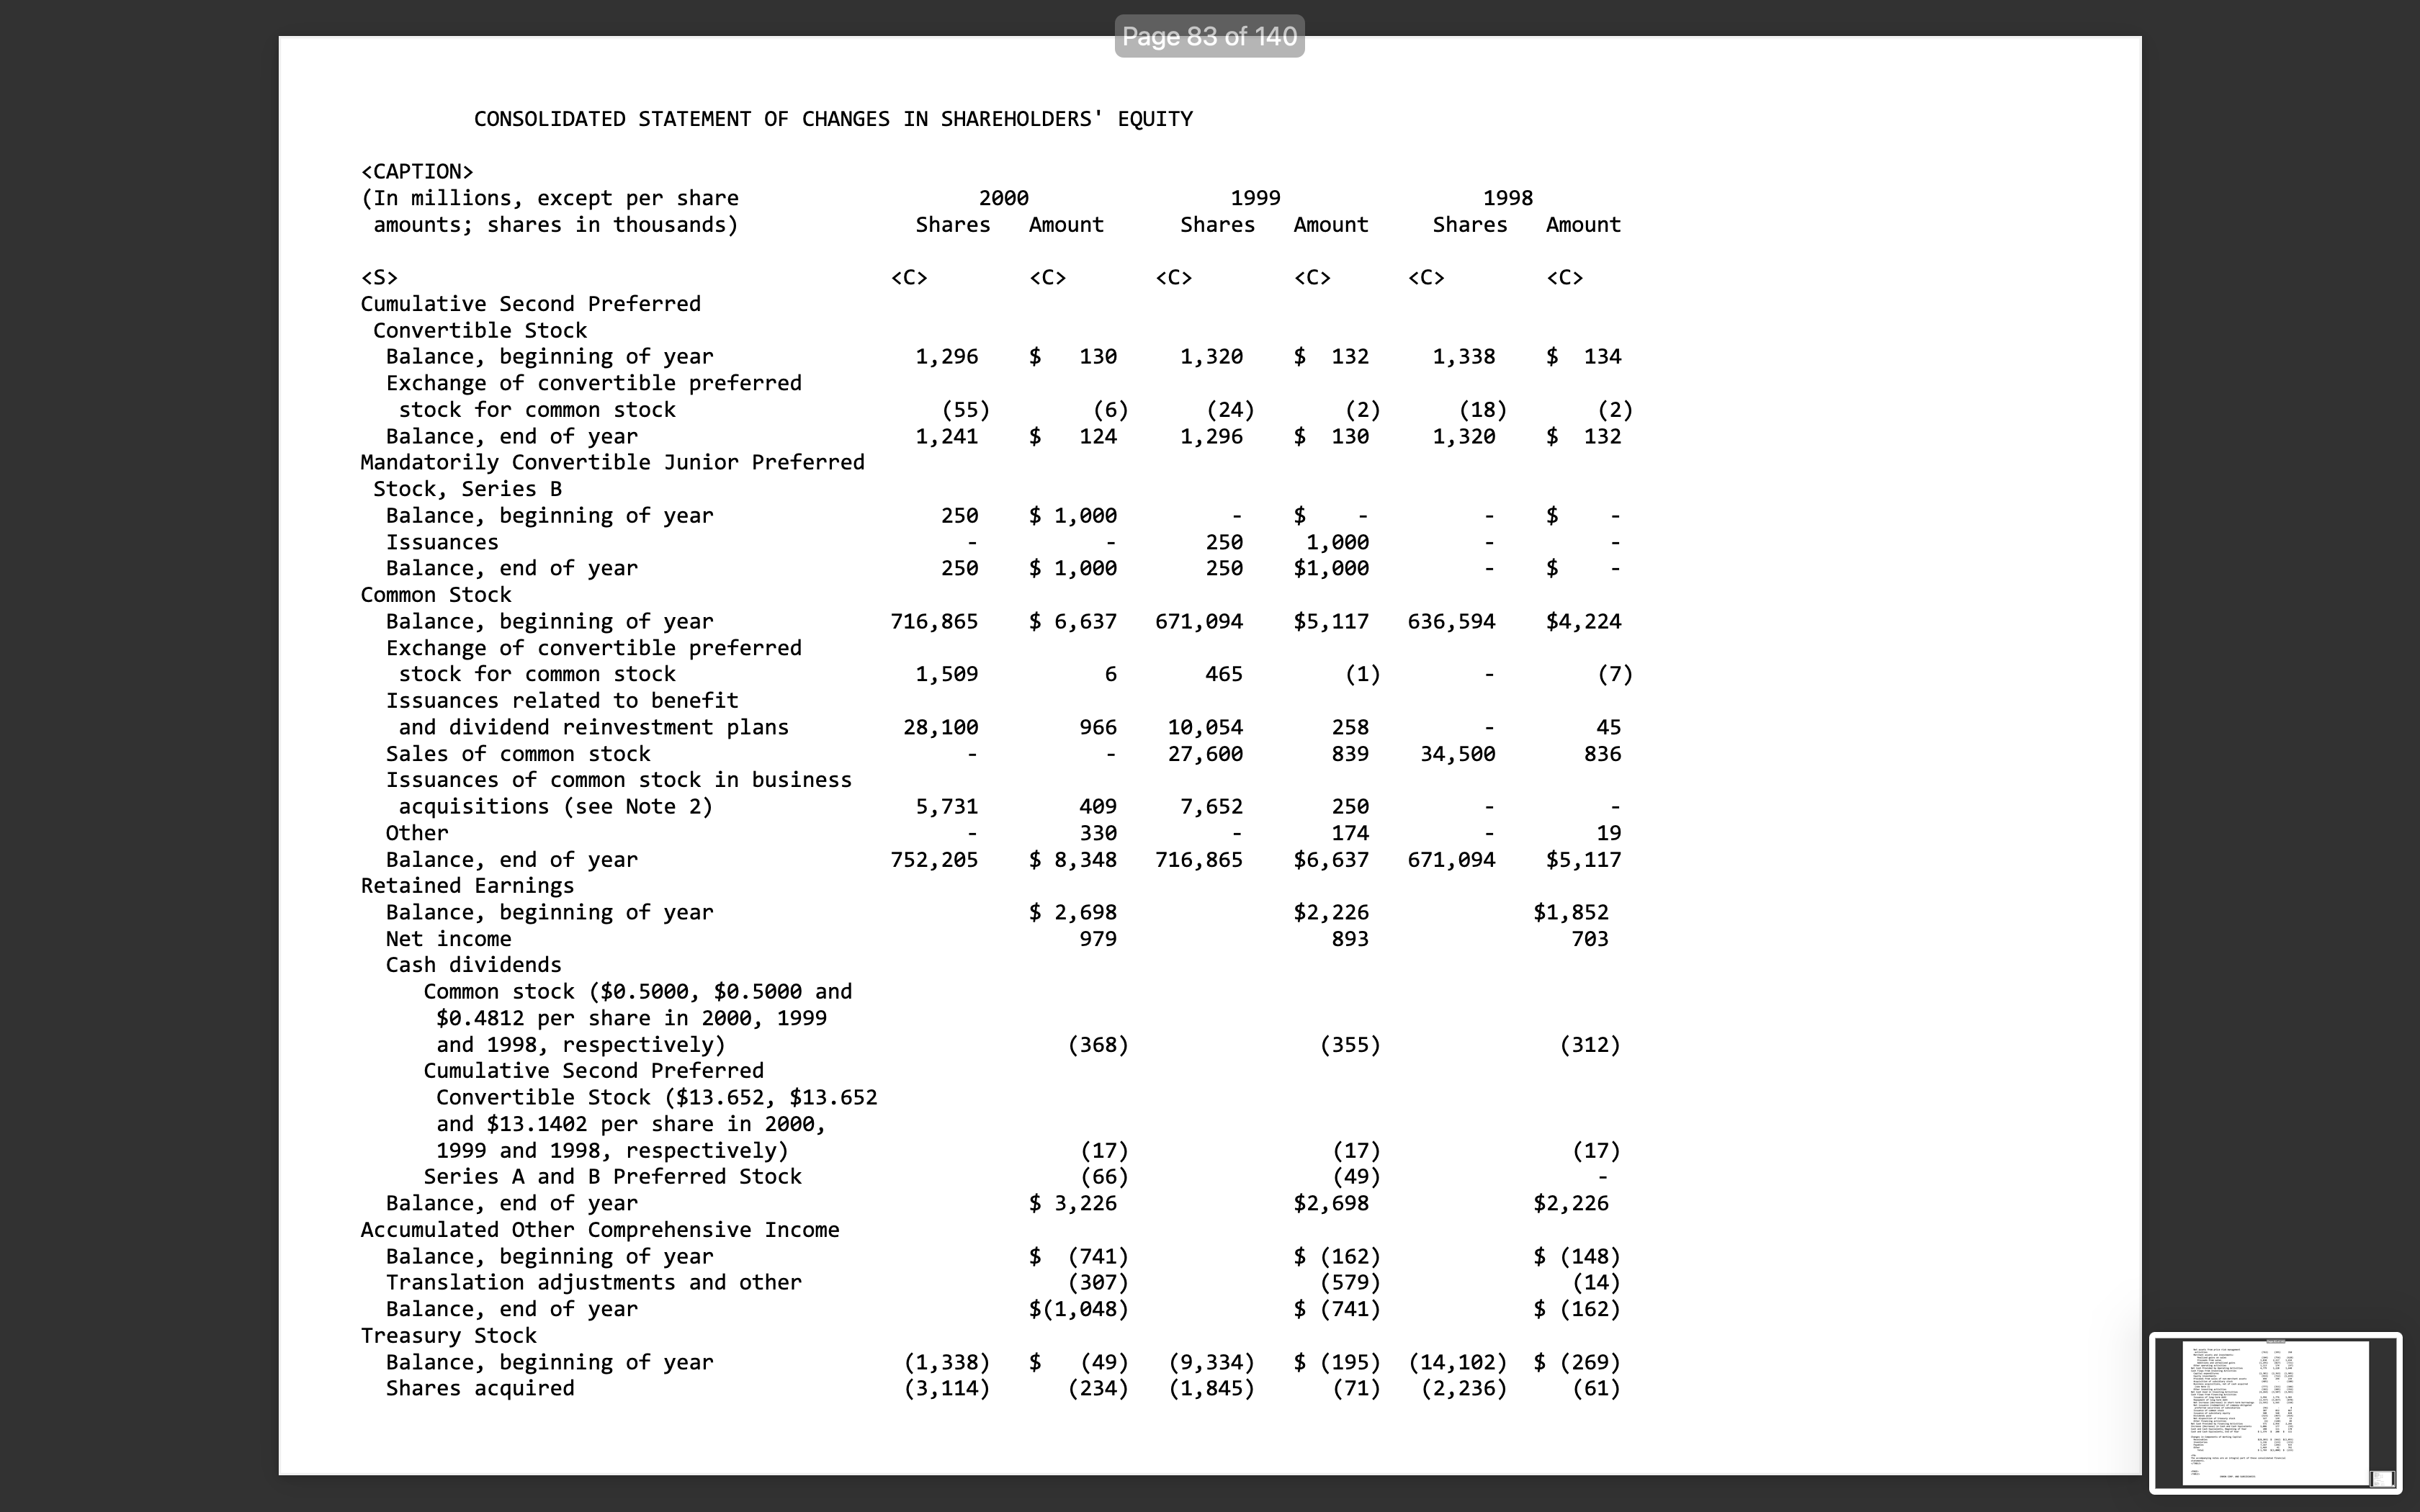
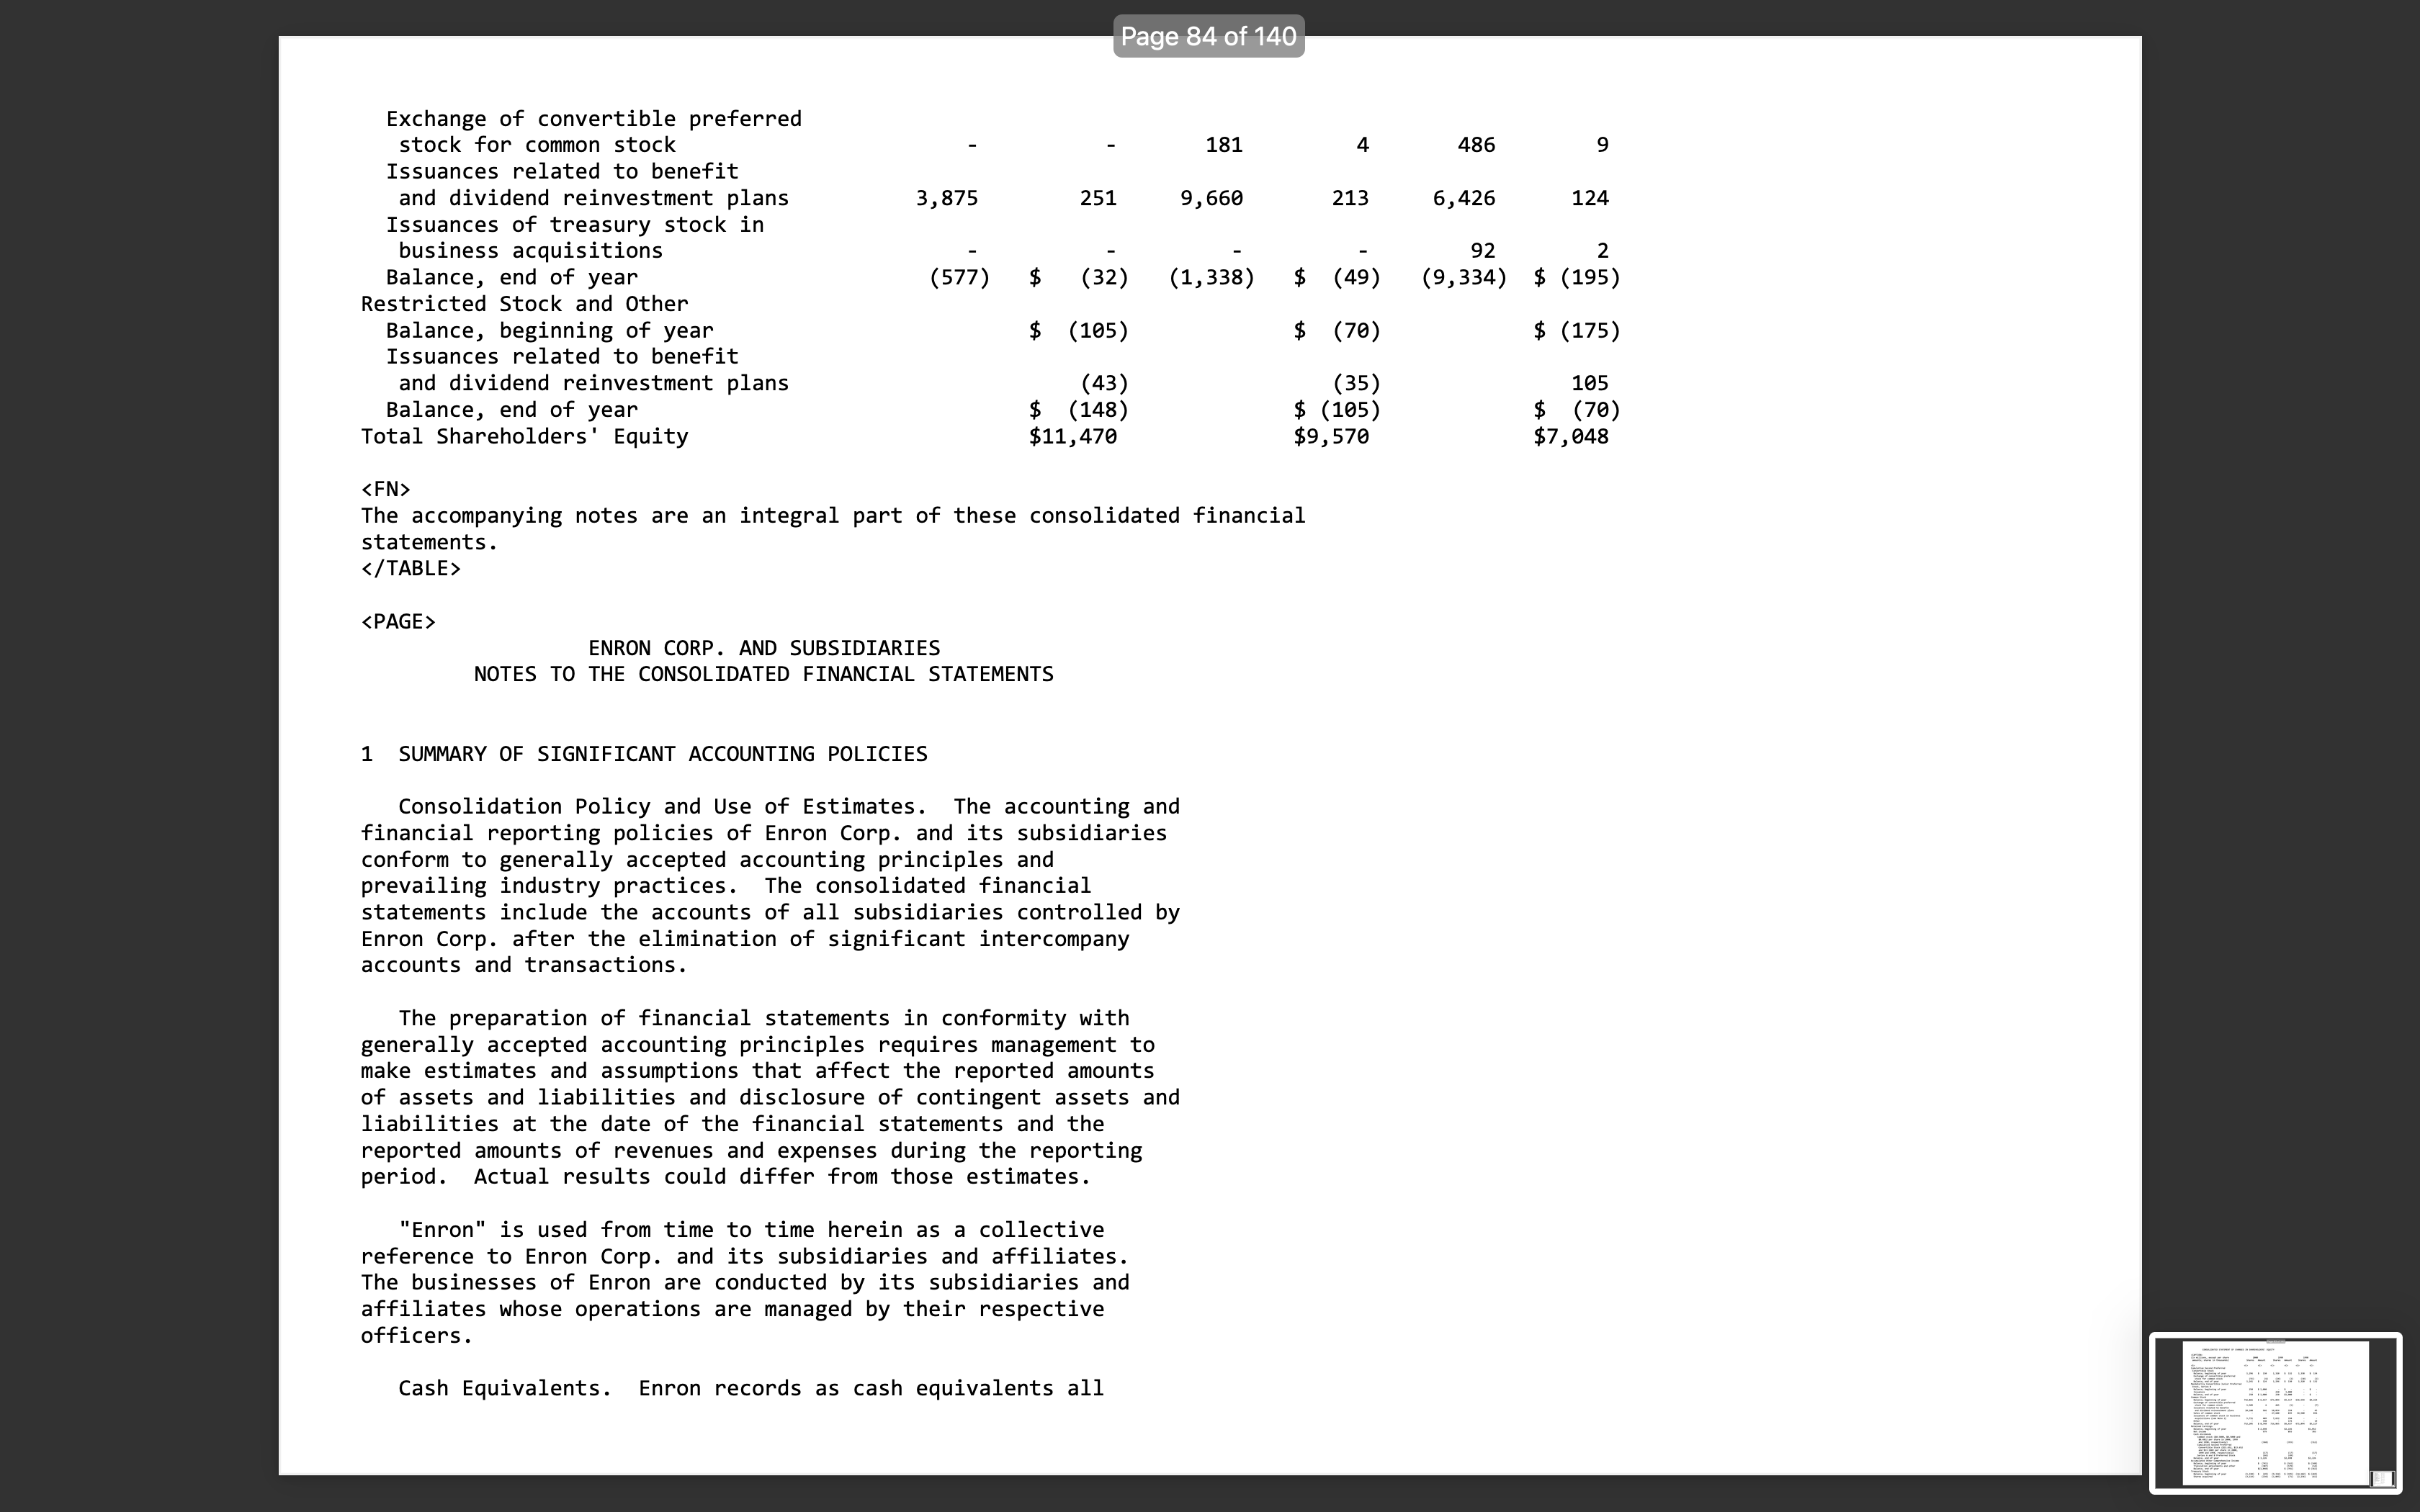
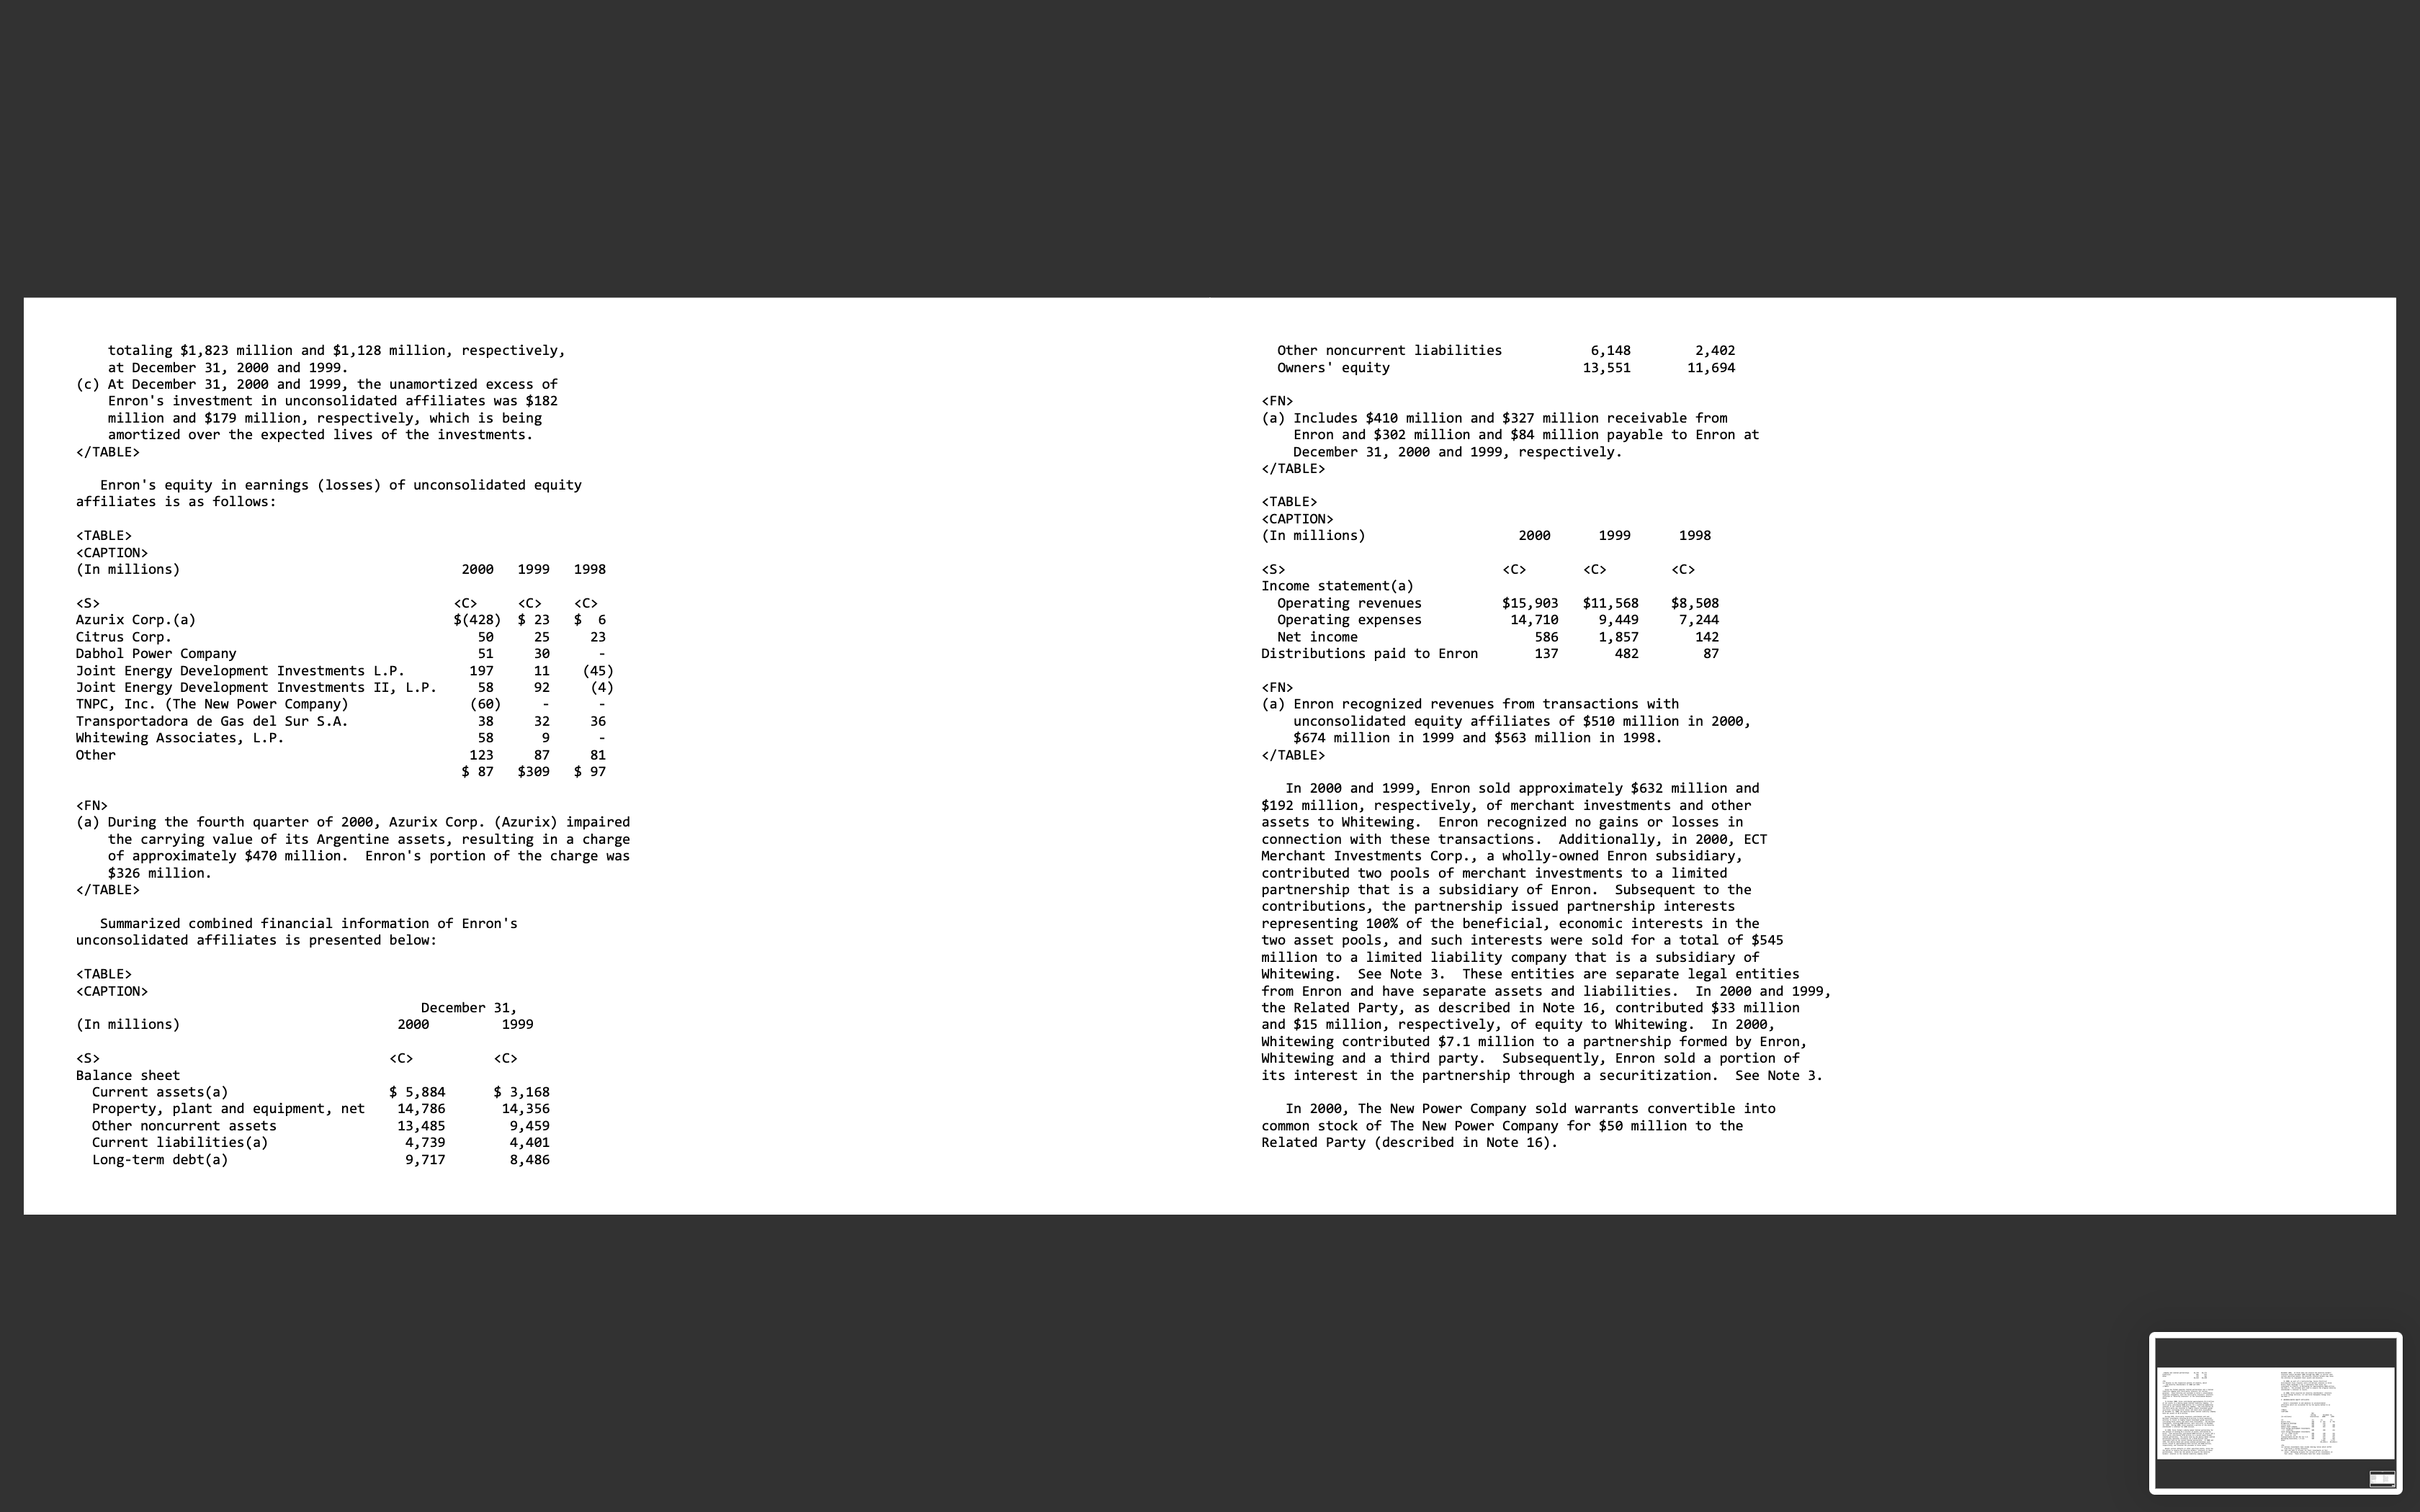
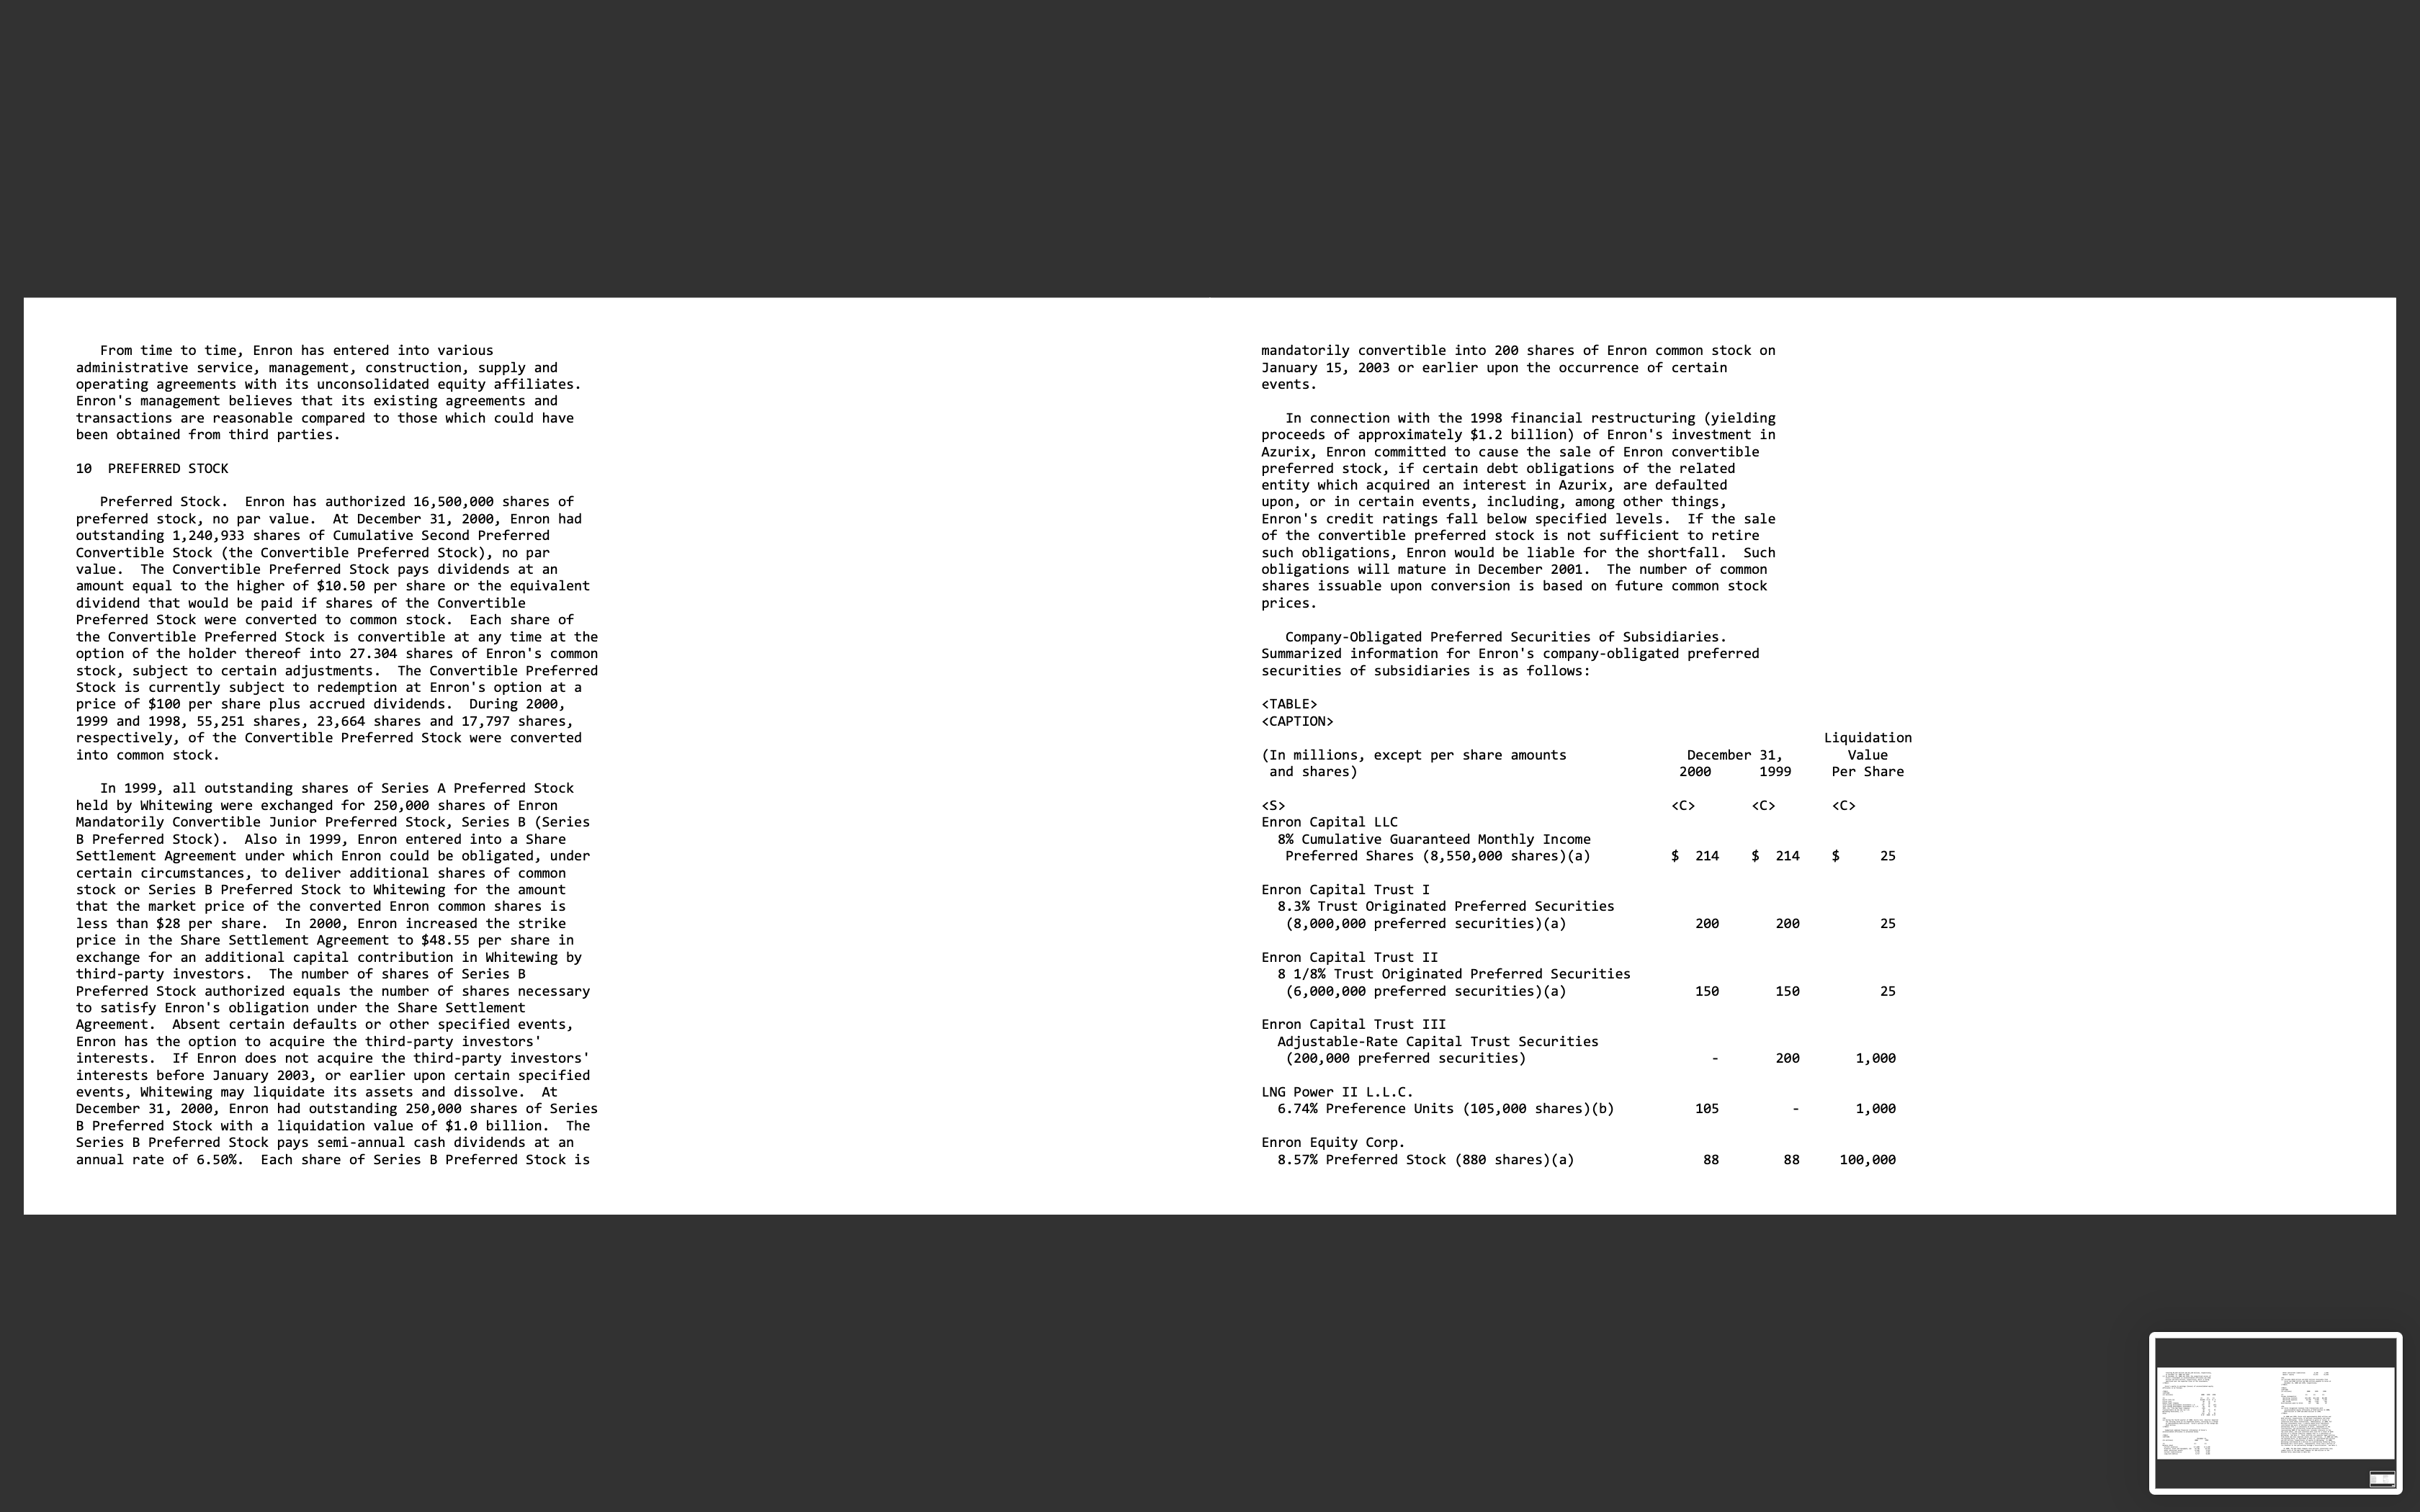
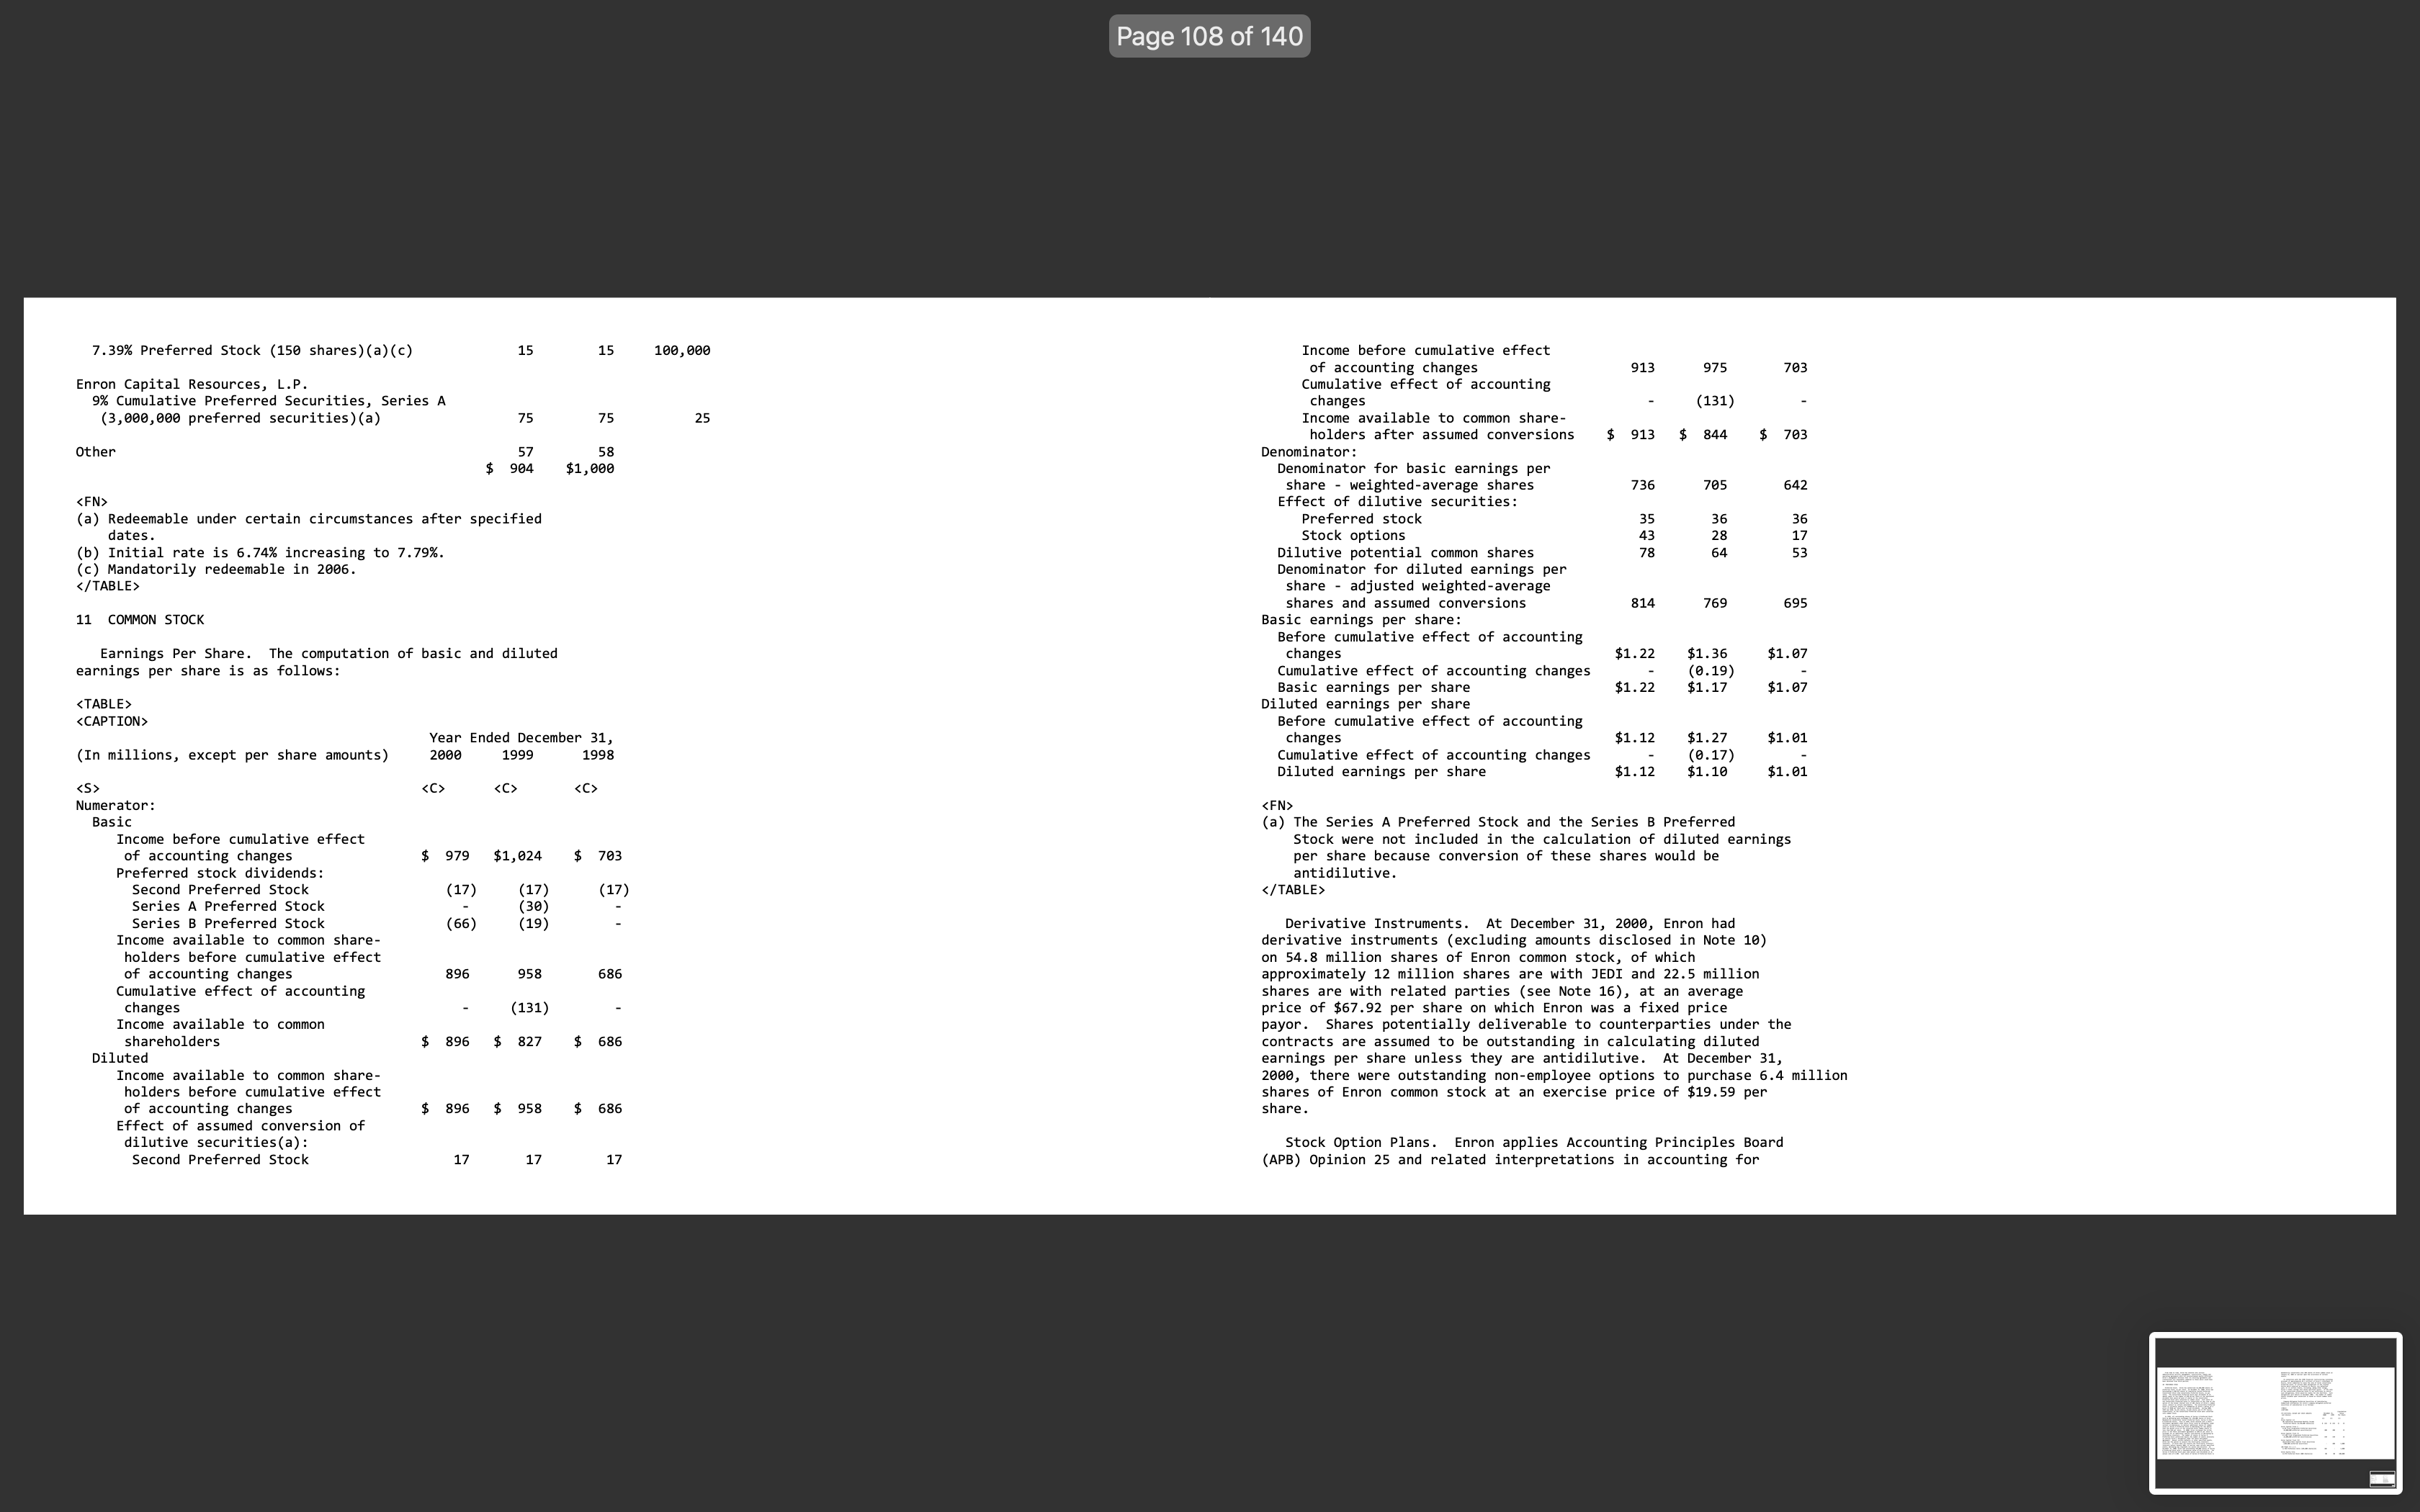
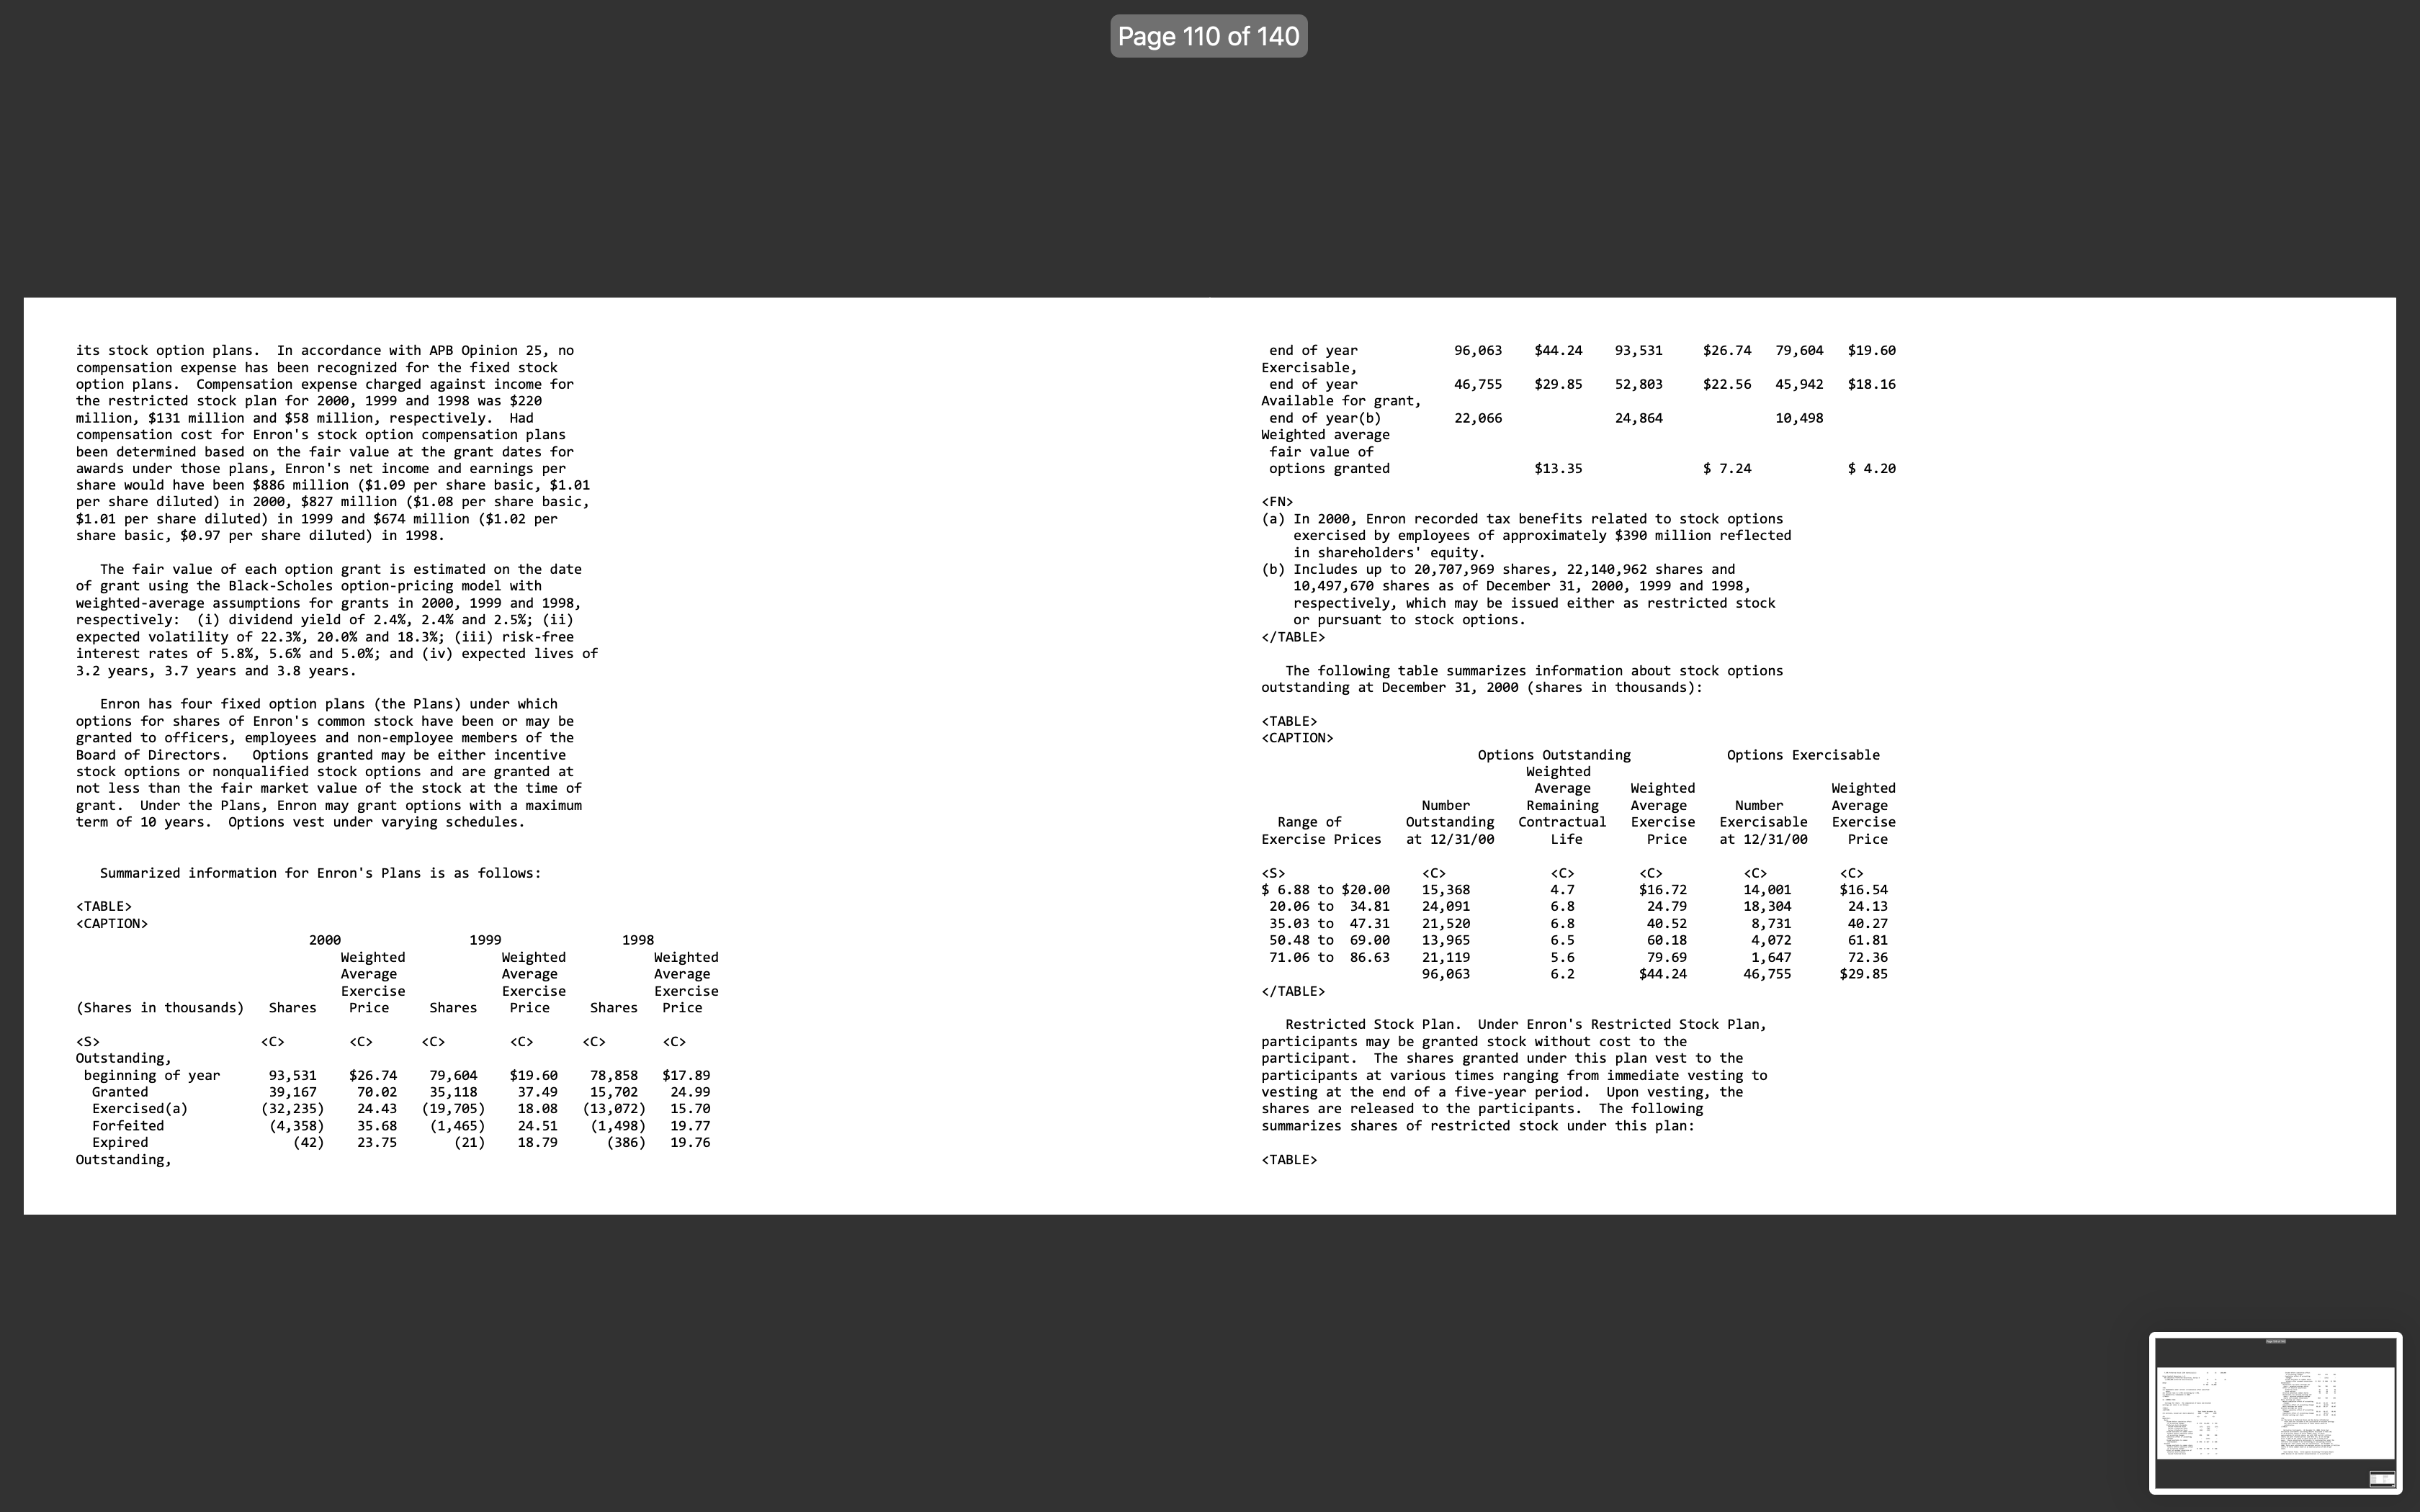
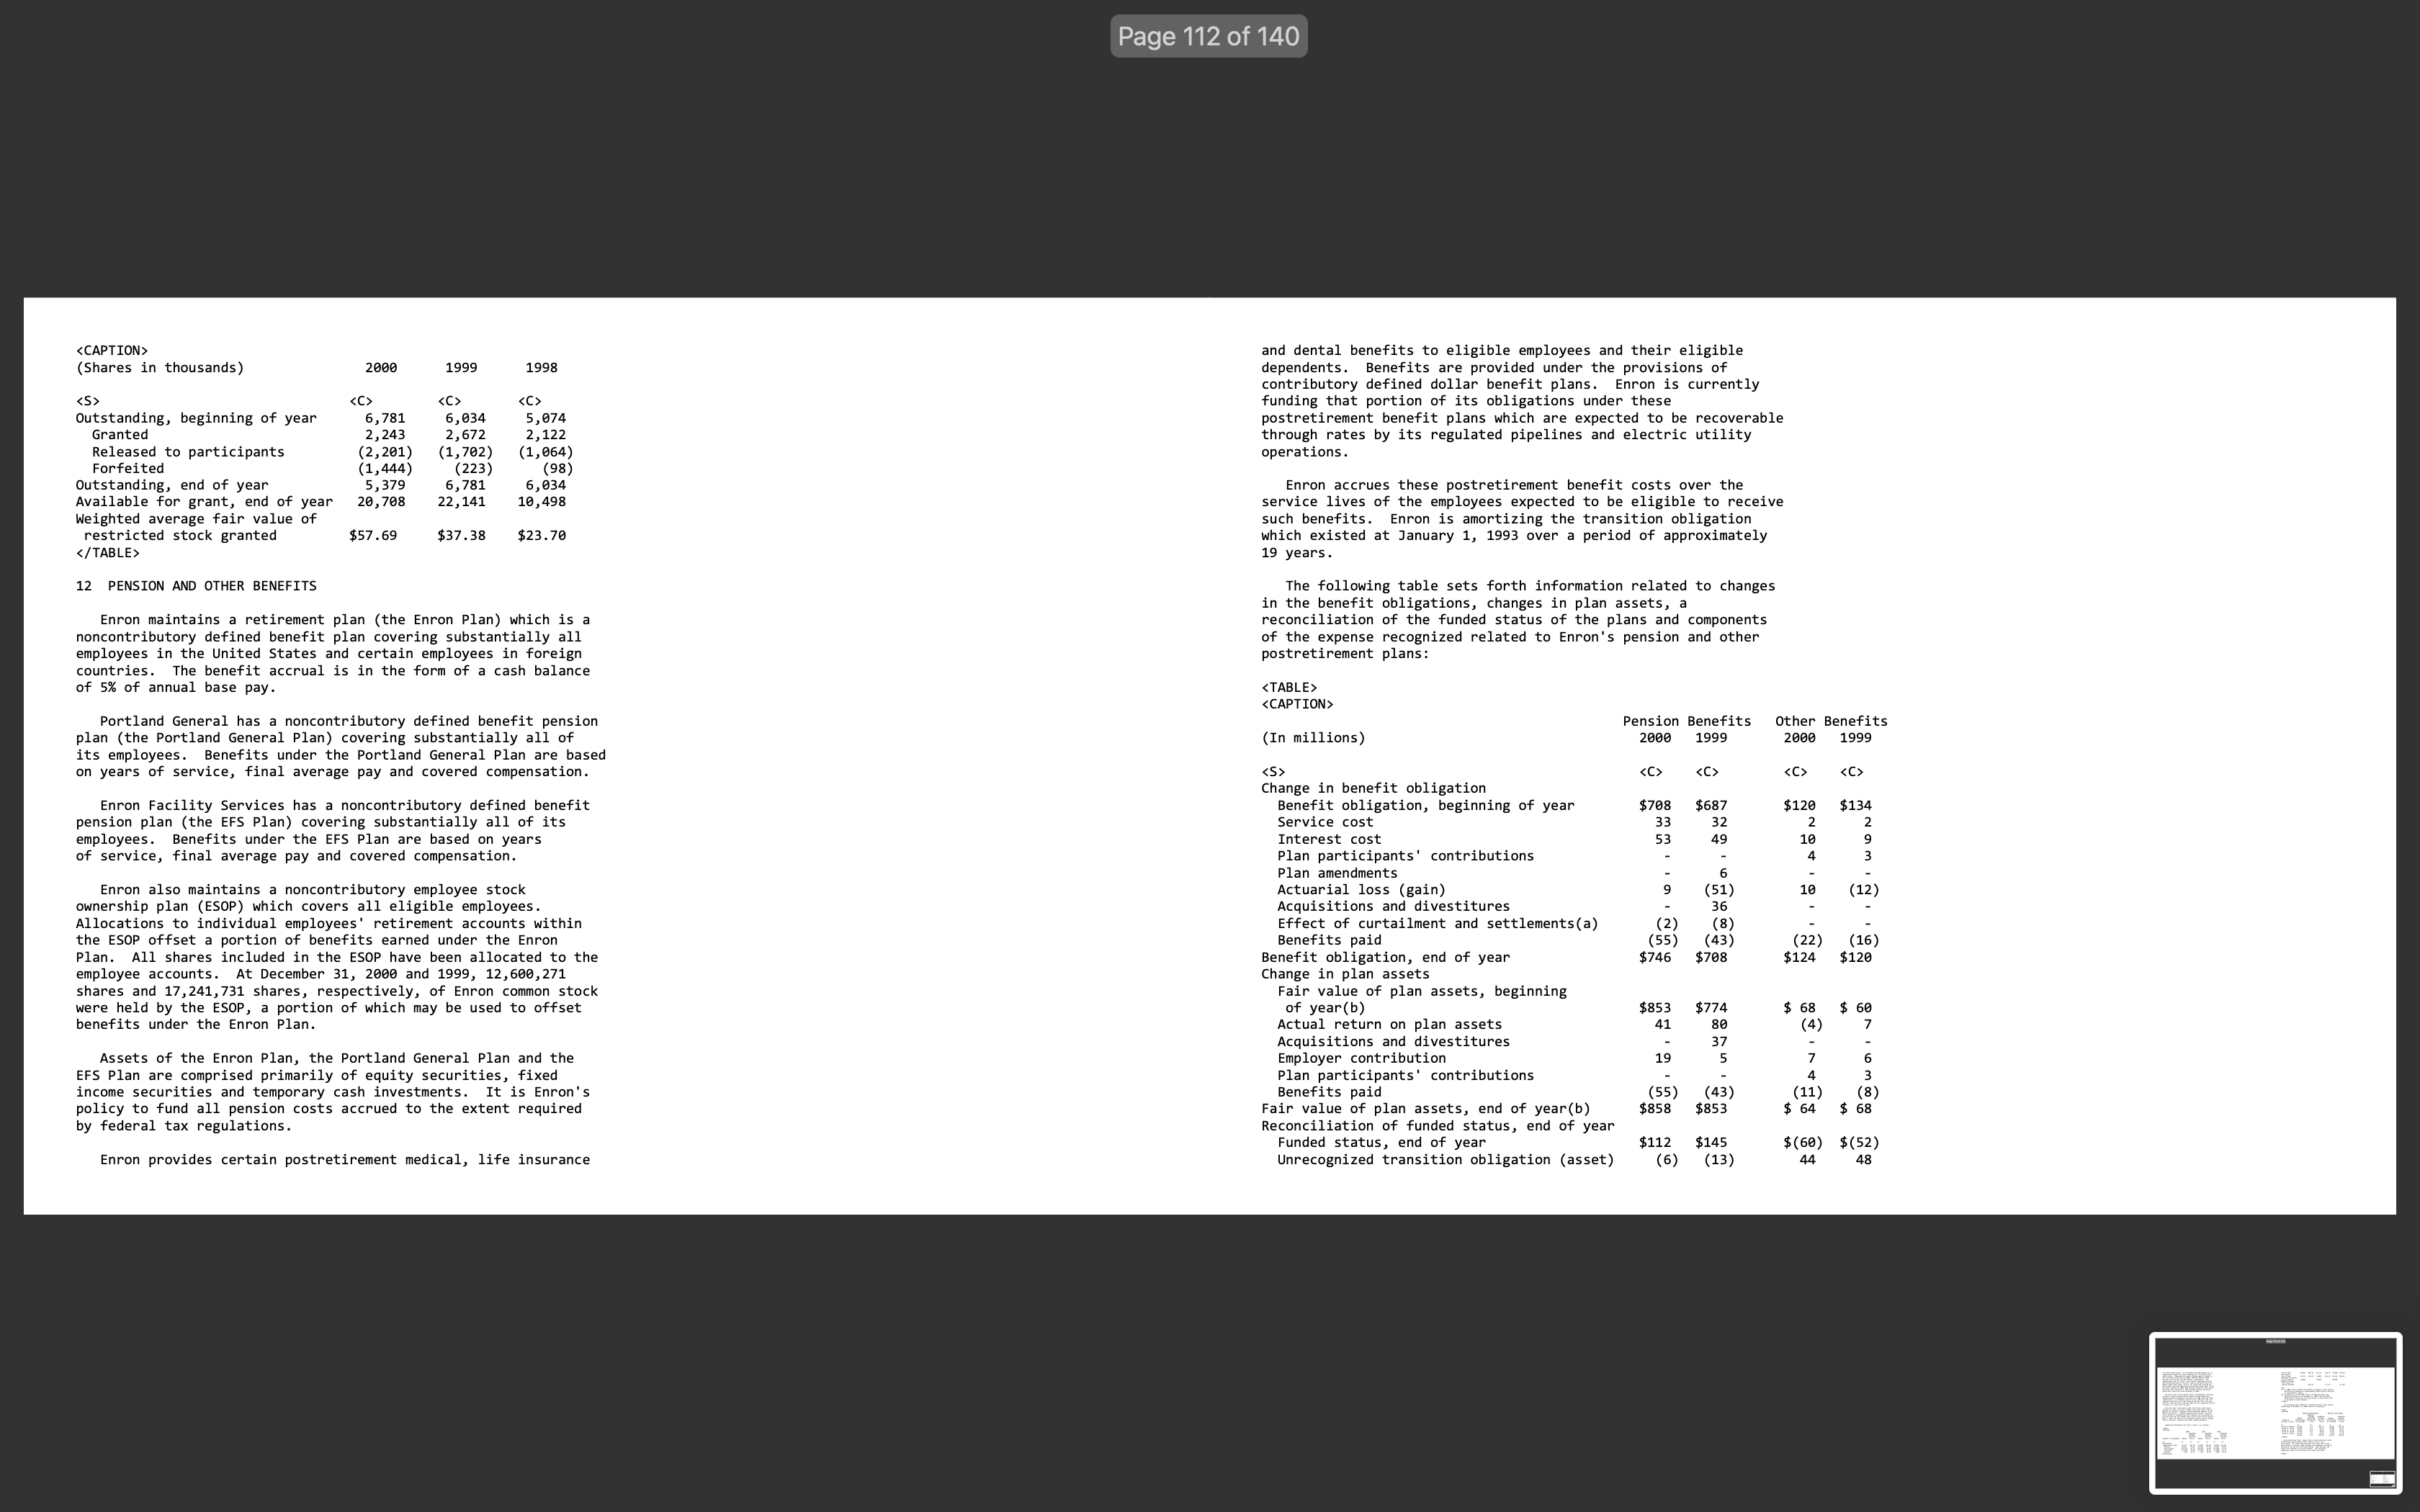
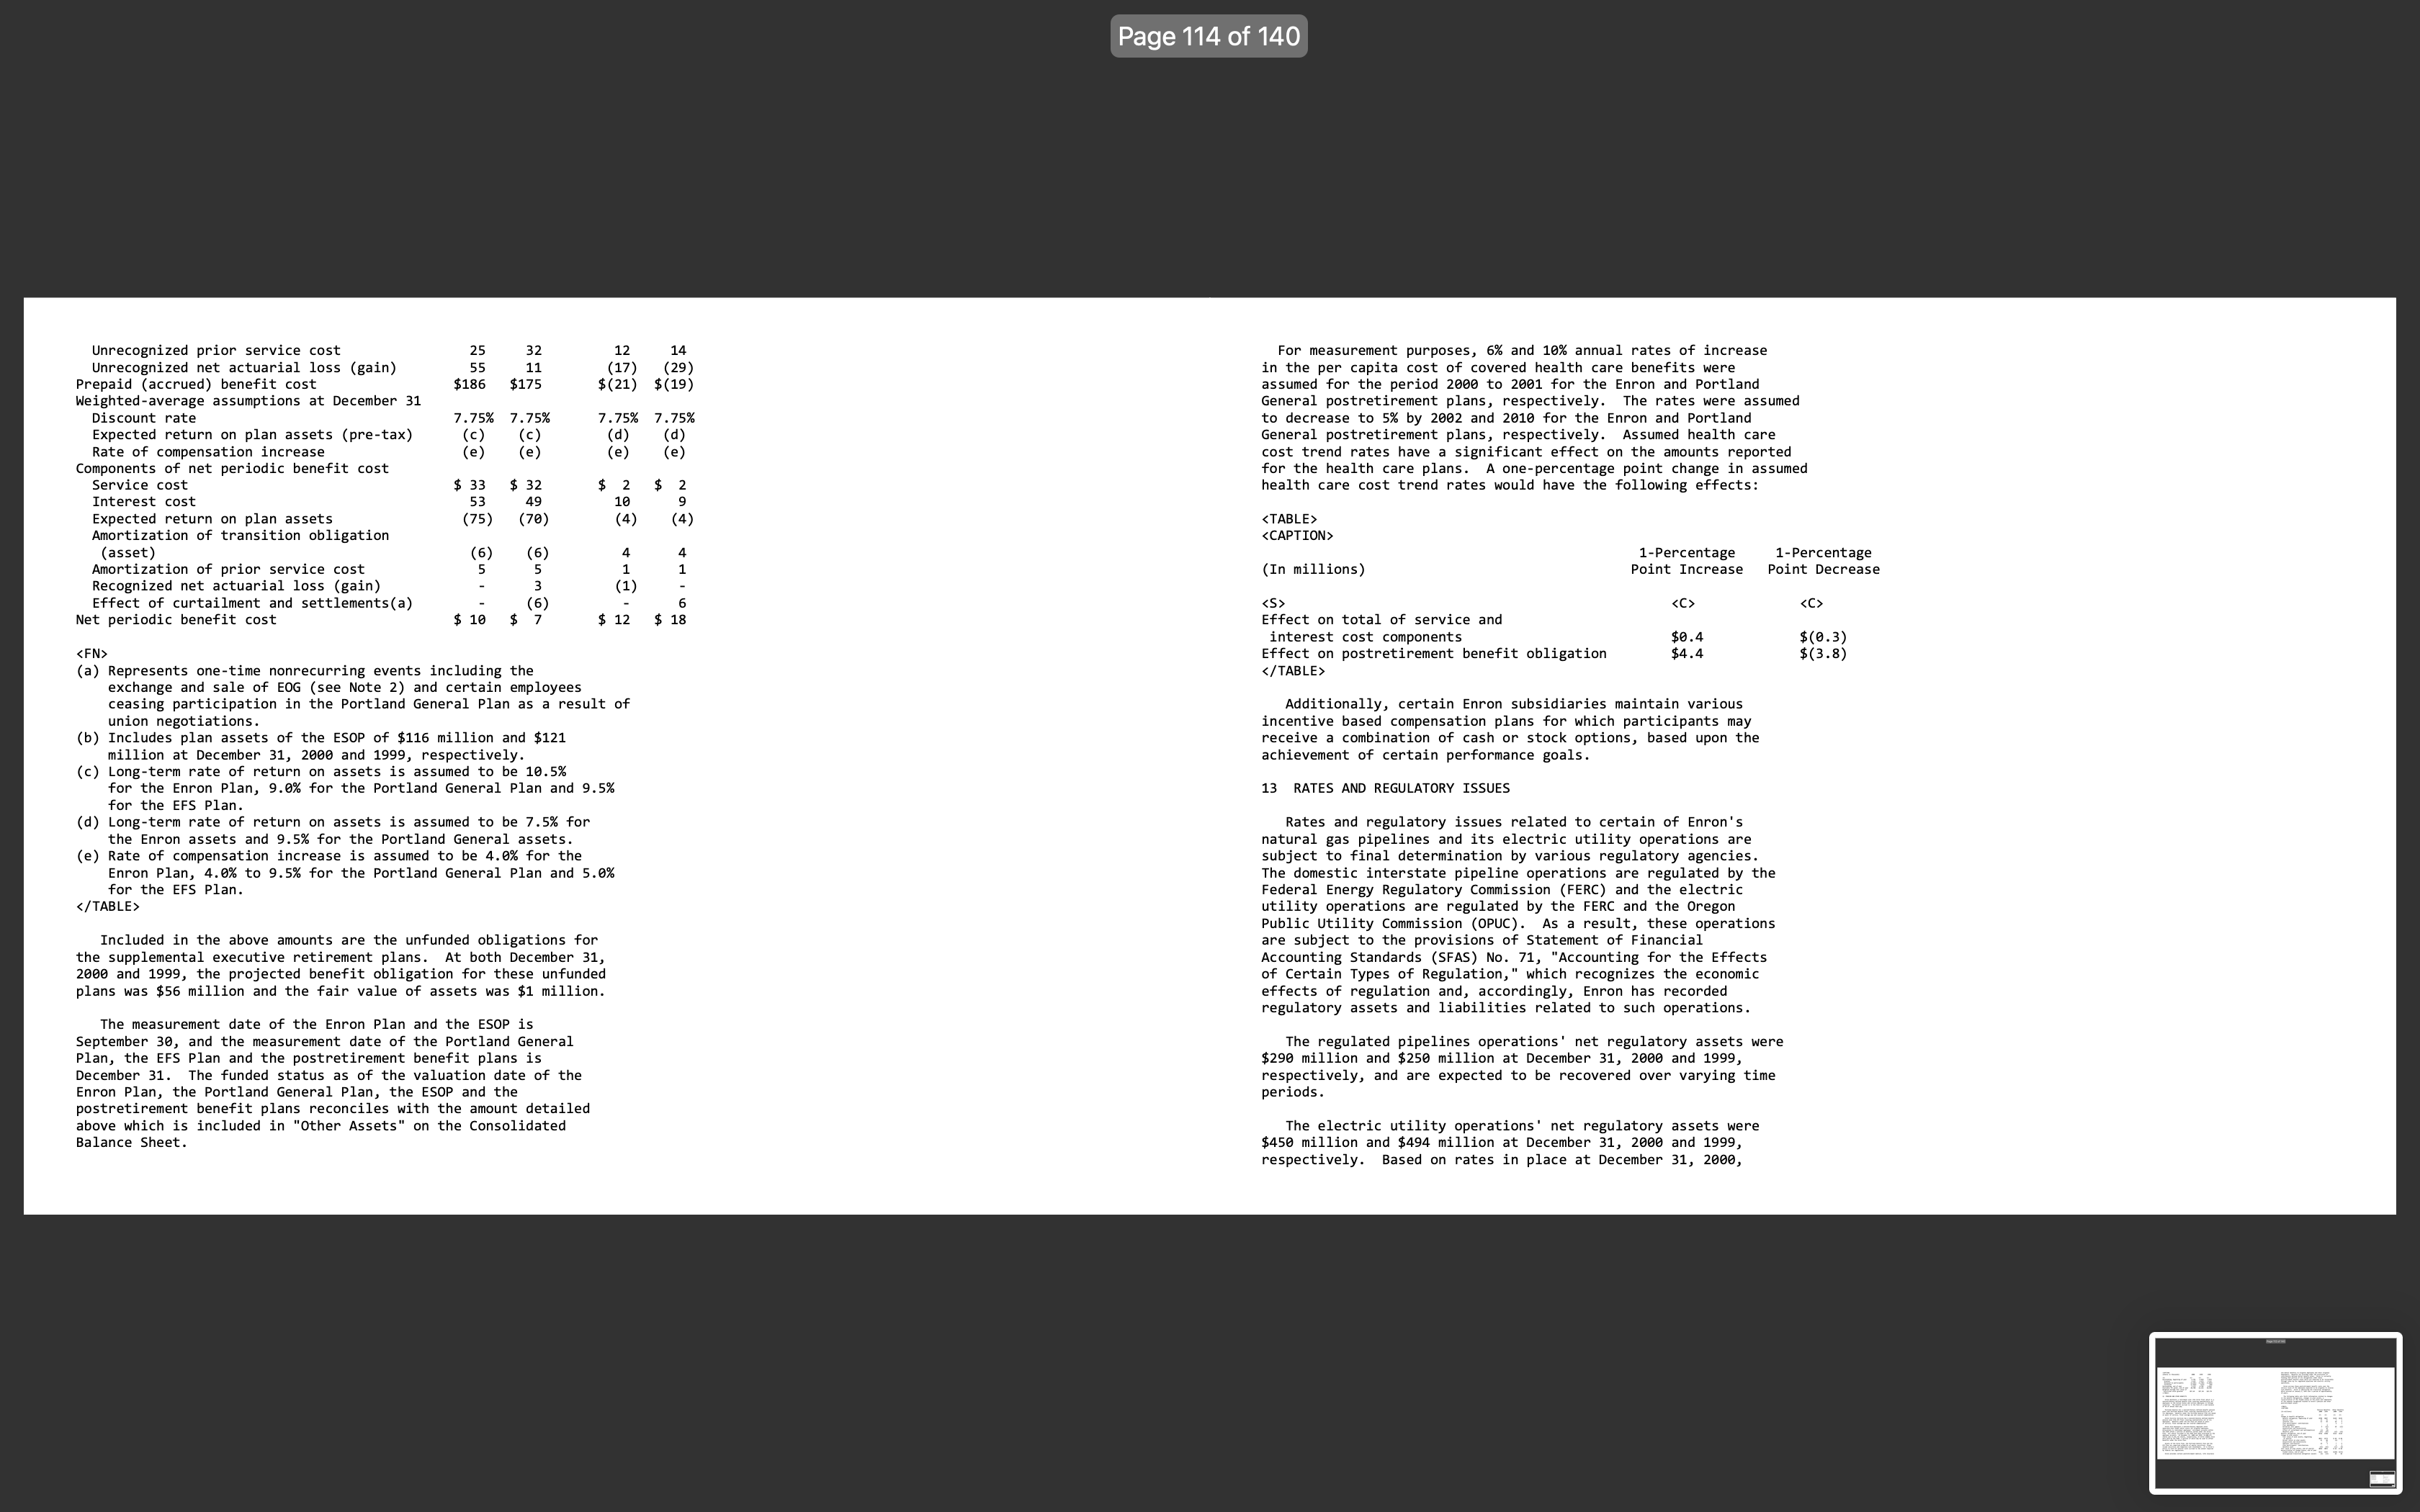
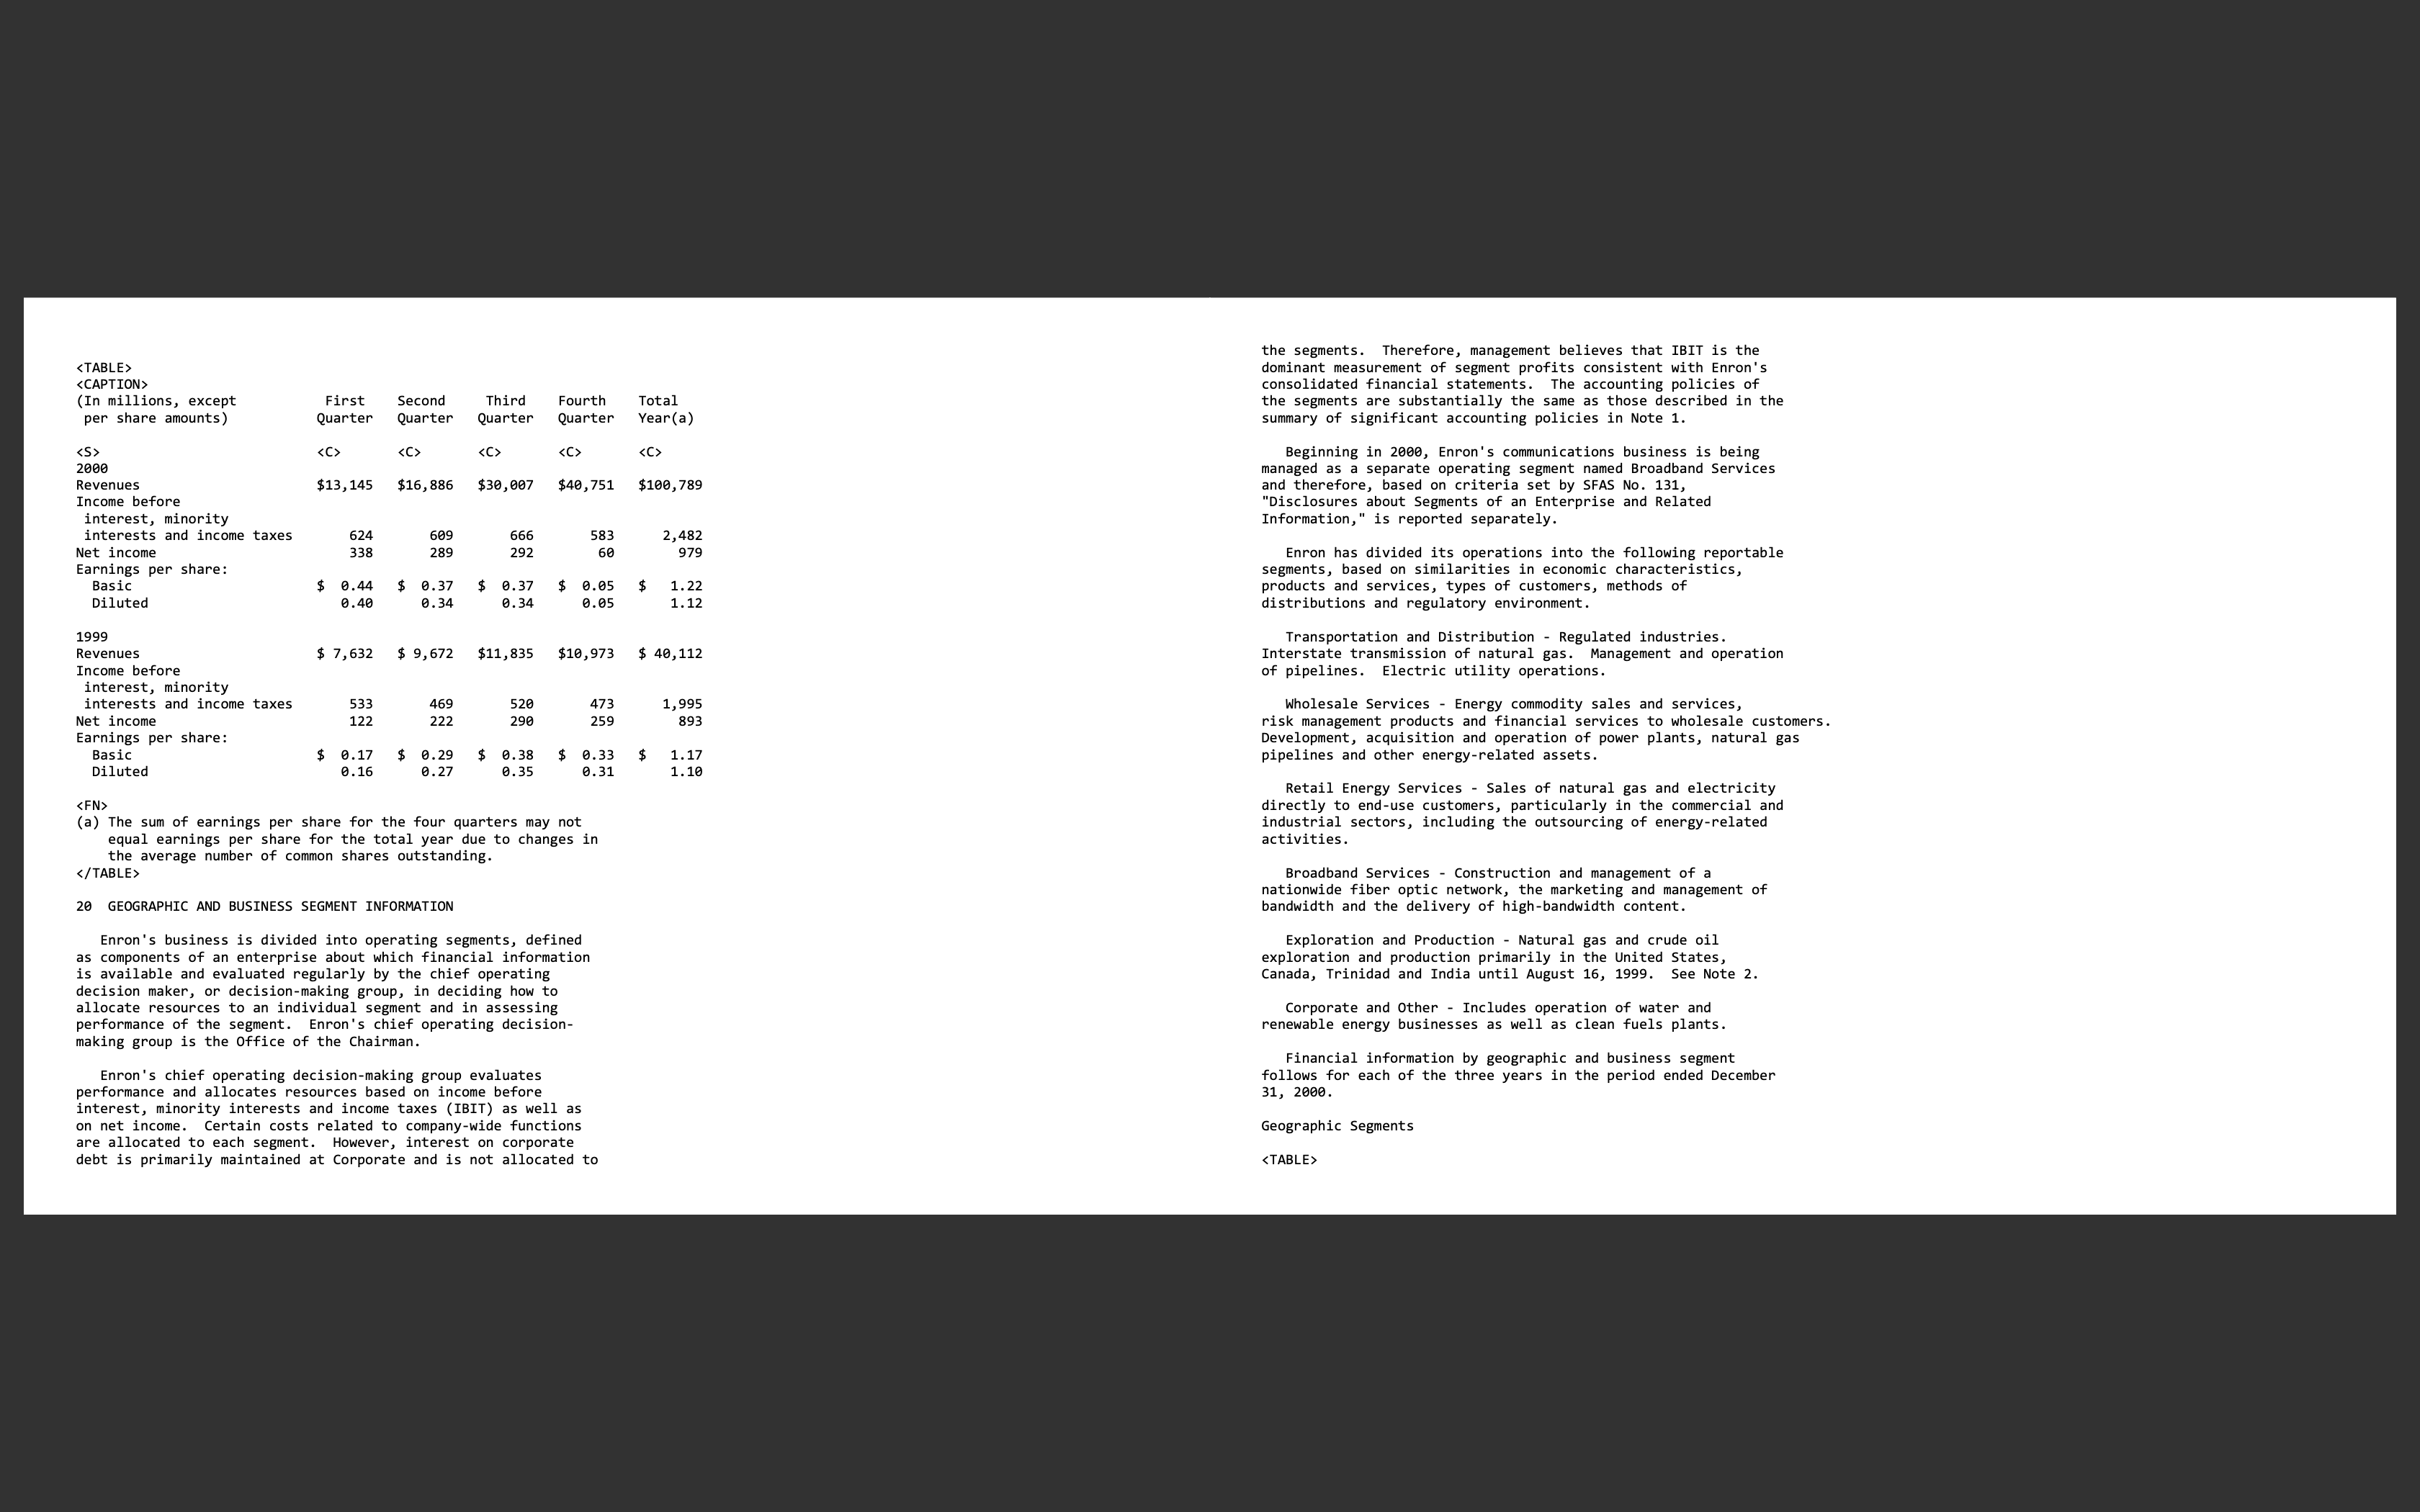
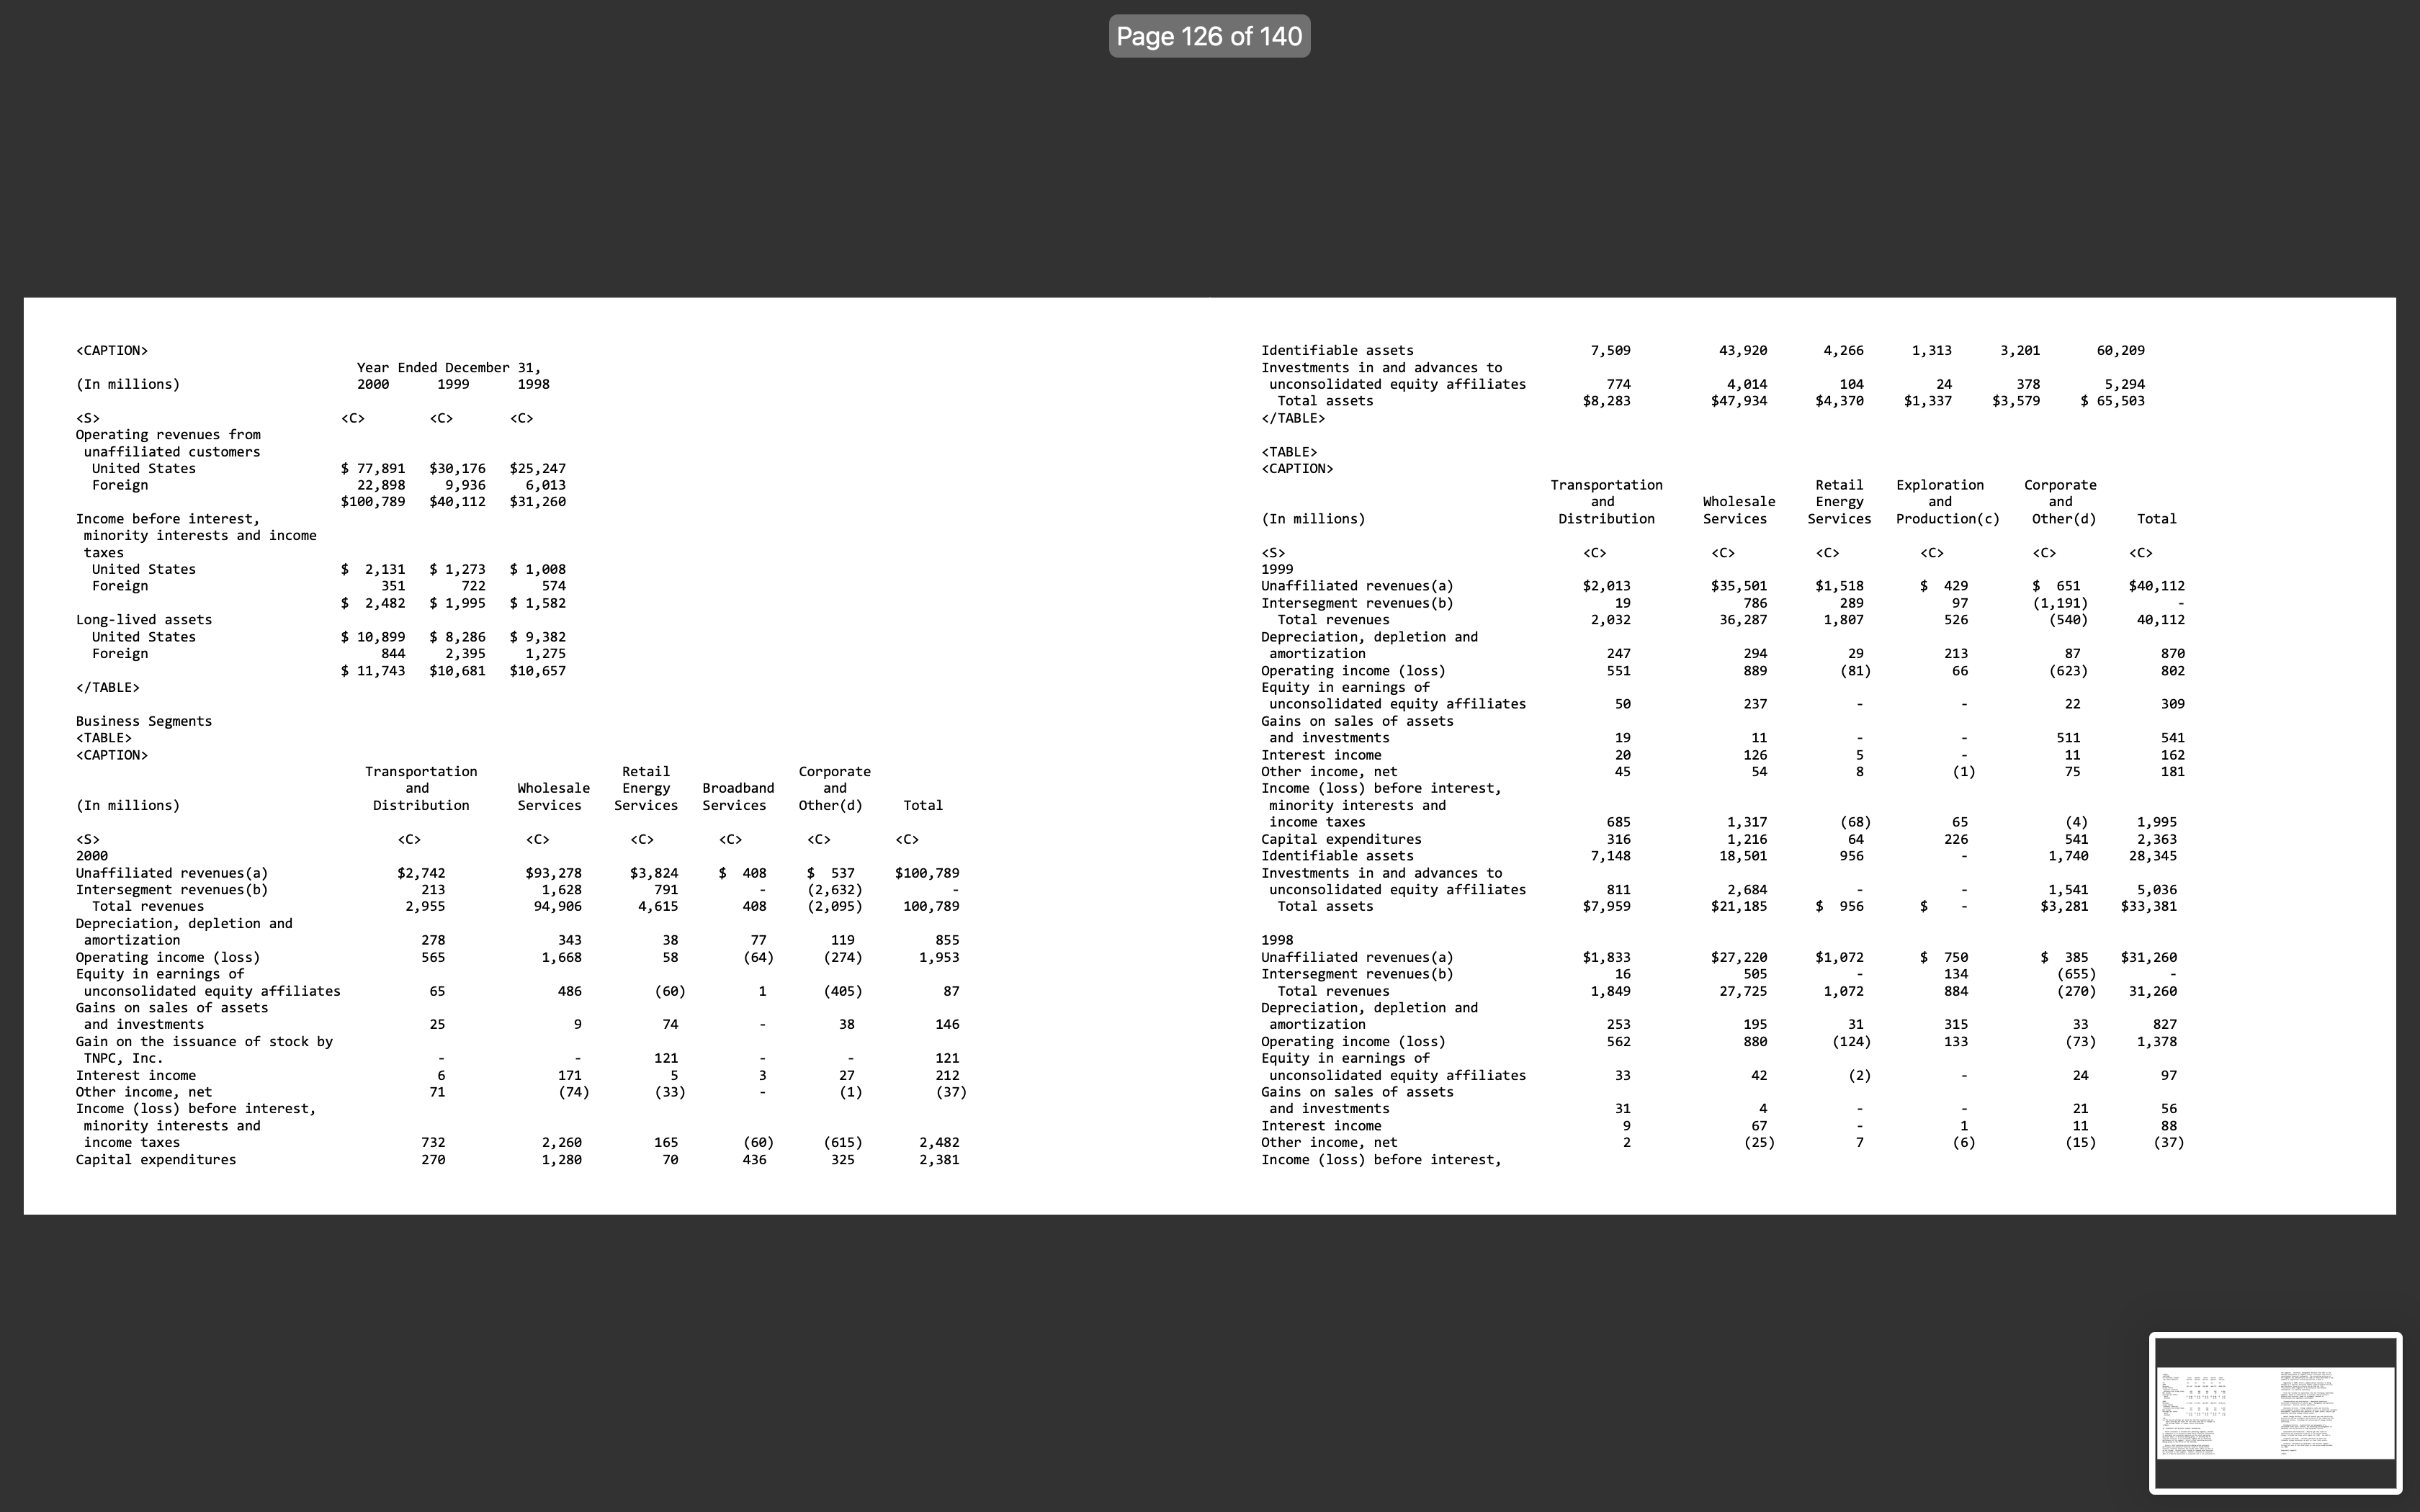
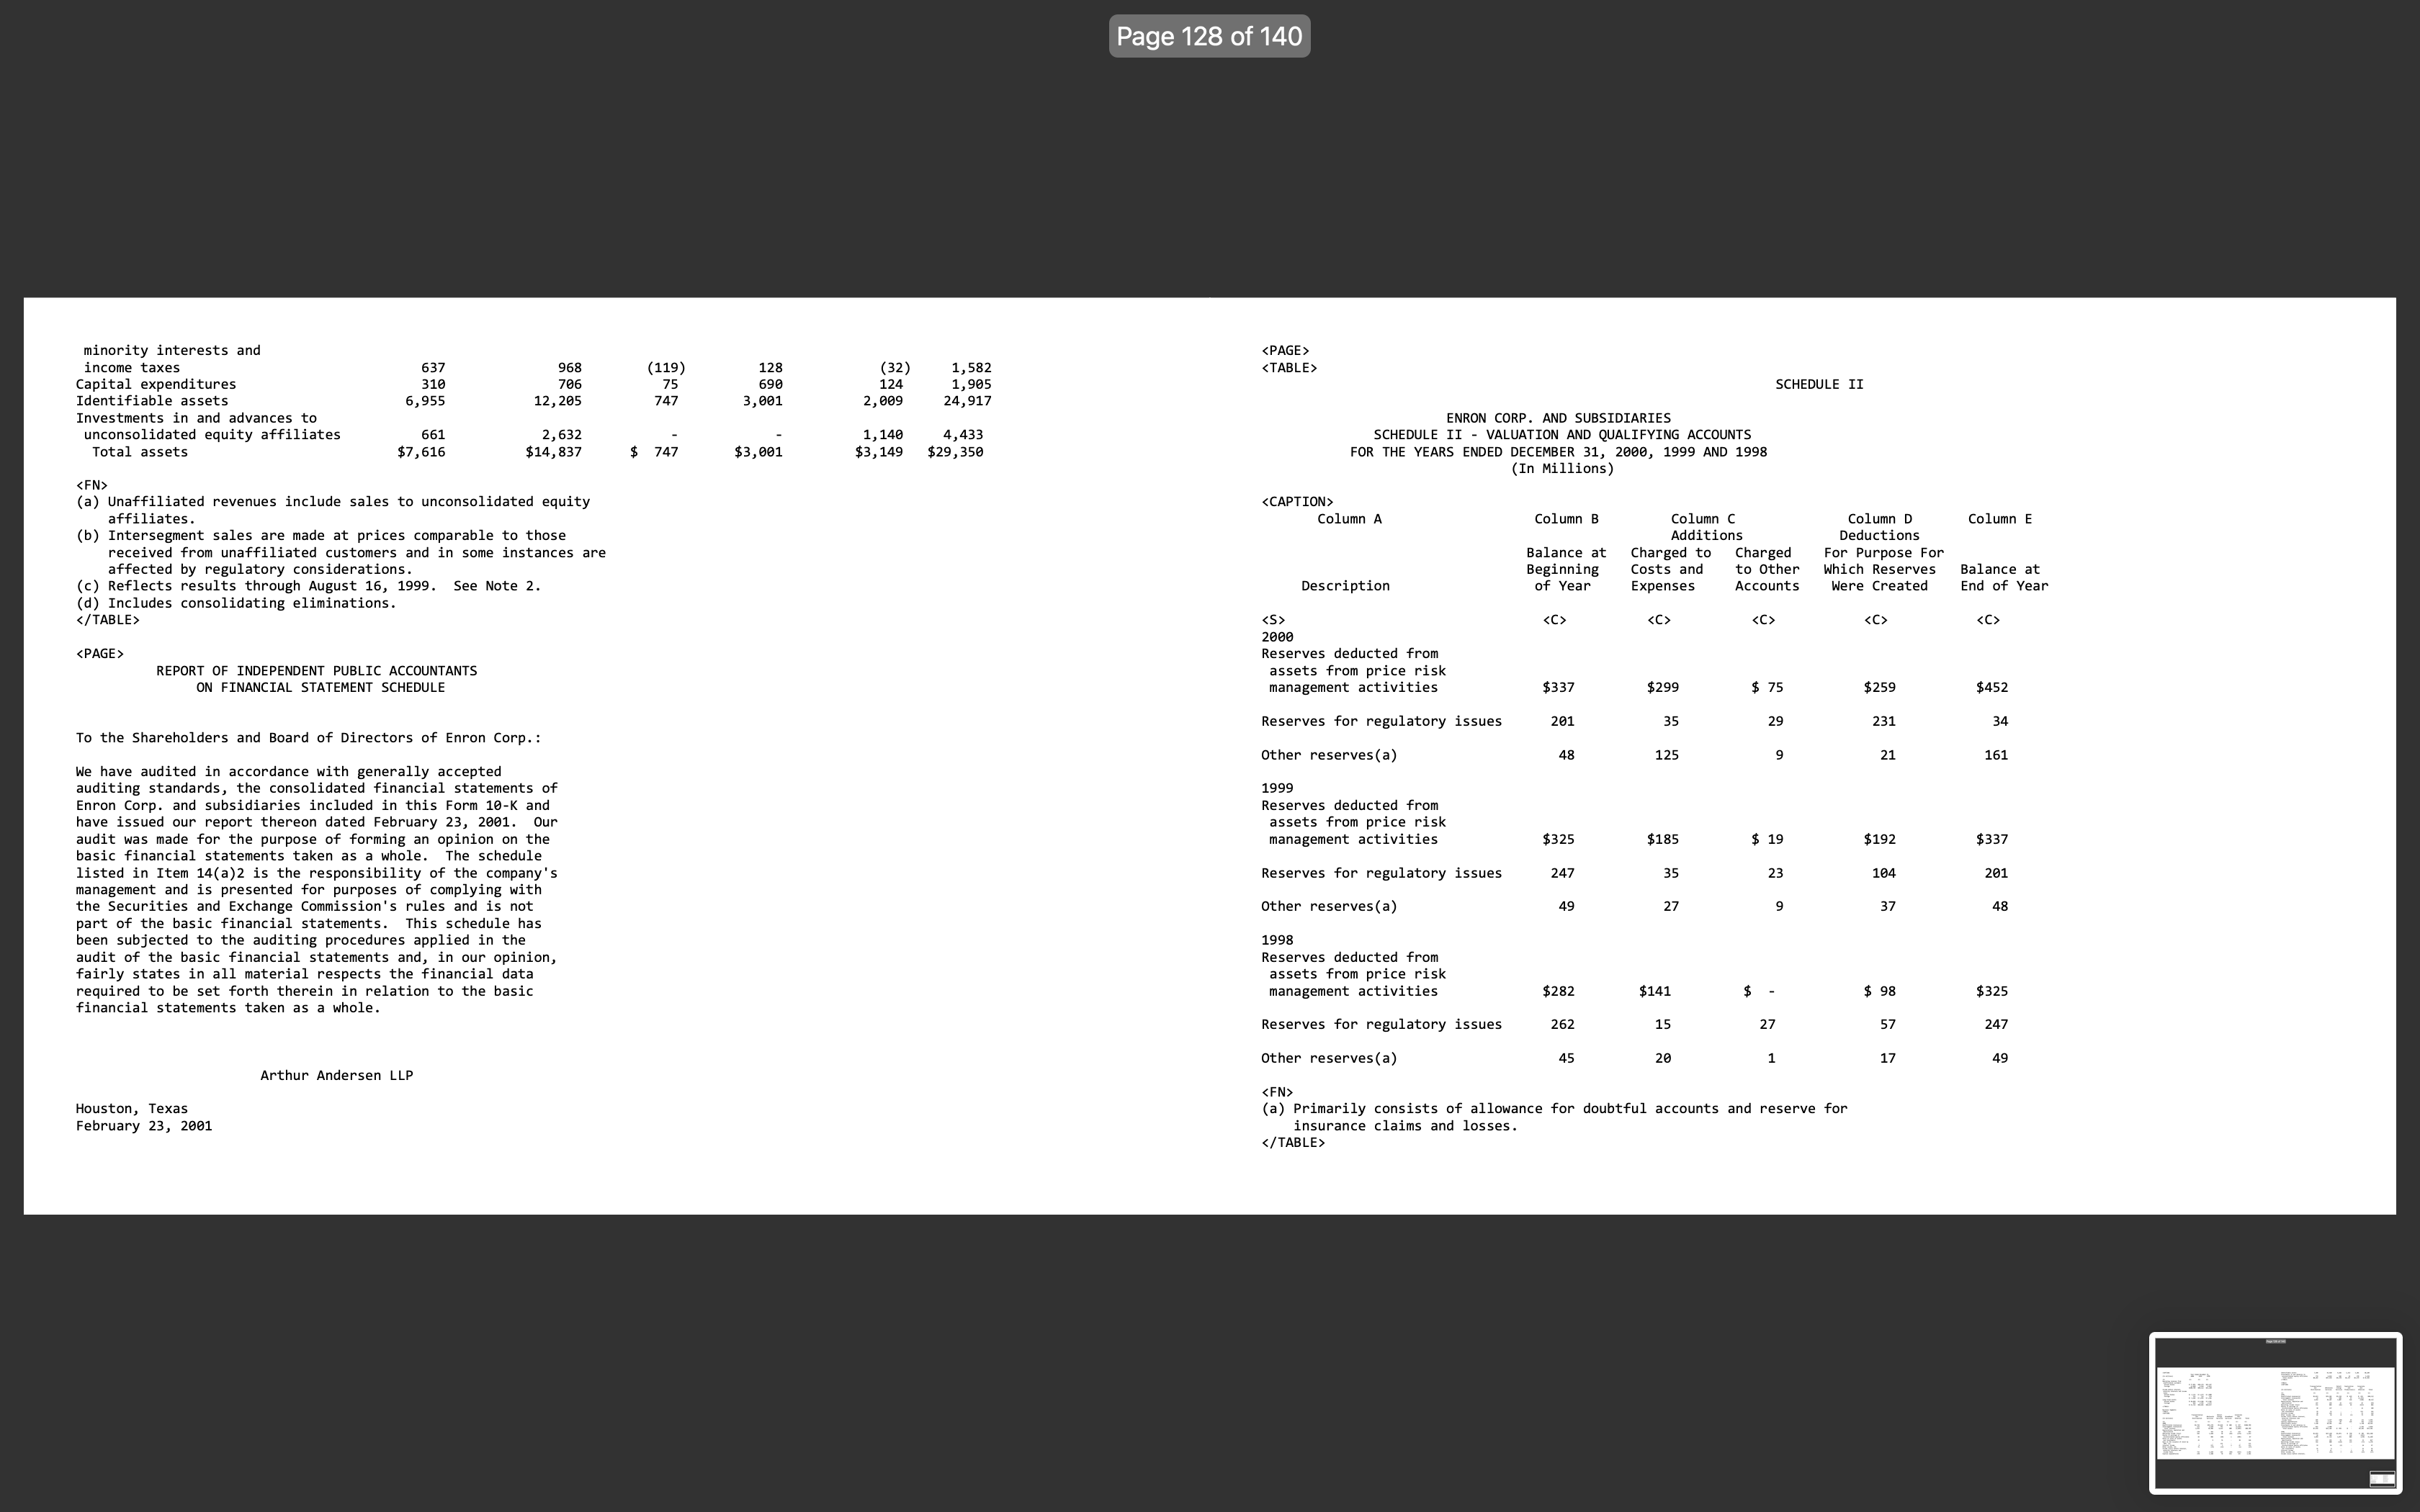
- Regarding Enron, this was a company that resulted in the creation of the Sarbanes-Oxley Act and many reforms to the accounting profession
- Ratio Analysis. Using the 2000 Enron 10-K, calculate 2 years of the following liquidity, solvency and profitability ratios. Include your calculations and analysis for these ratios and what they tell you about the company
Liquidity: Current ratio, Accounts receivable turnover
Solvency: Debt to assets ratio, Times interest earned
Profitability: Profit margin, Earnings per share
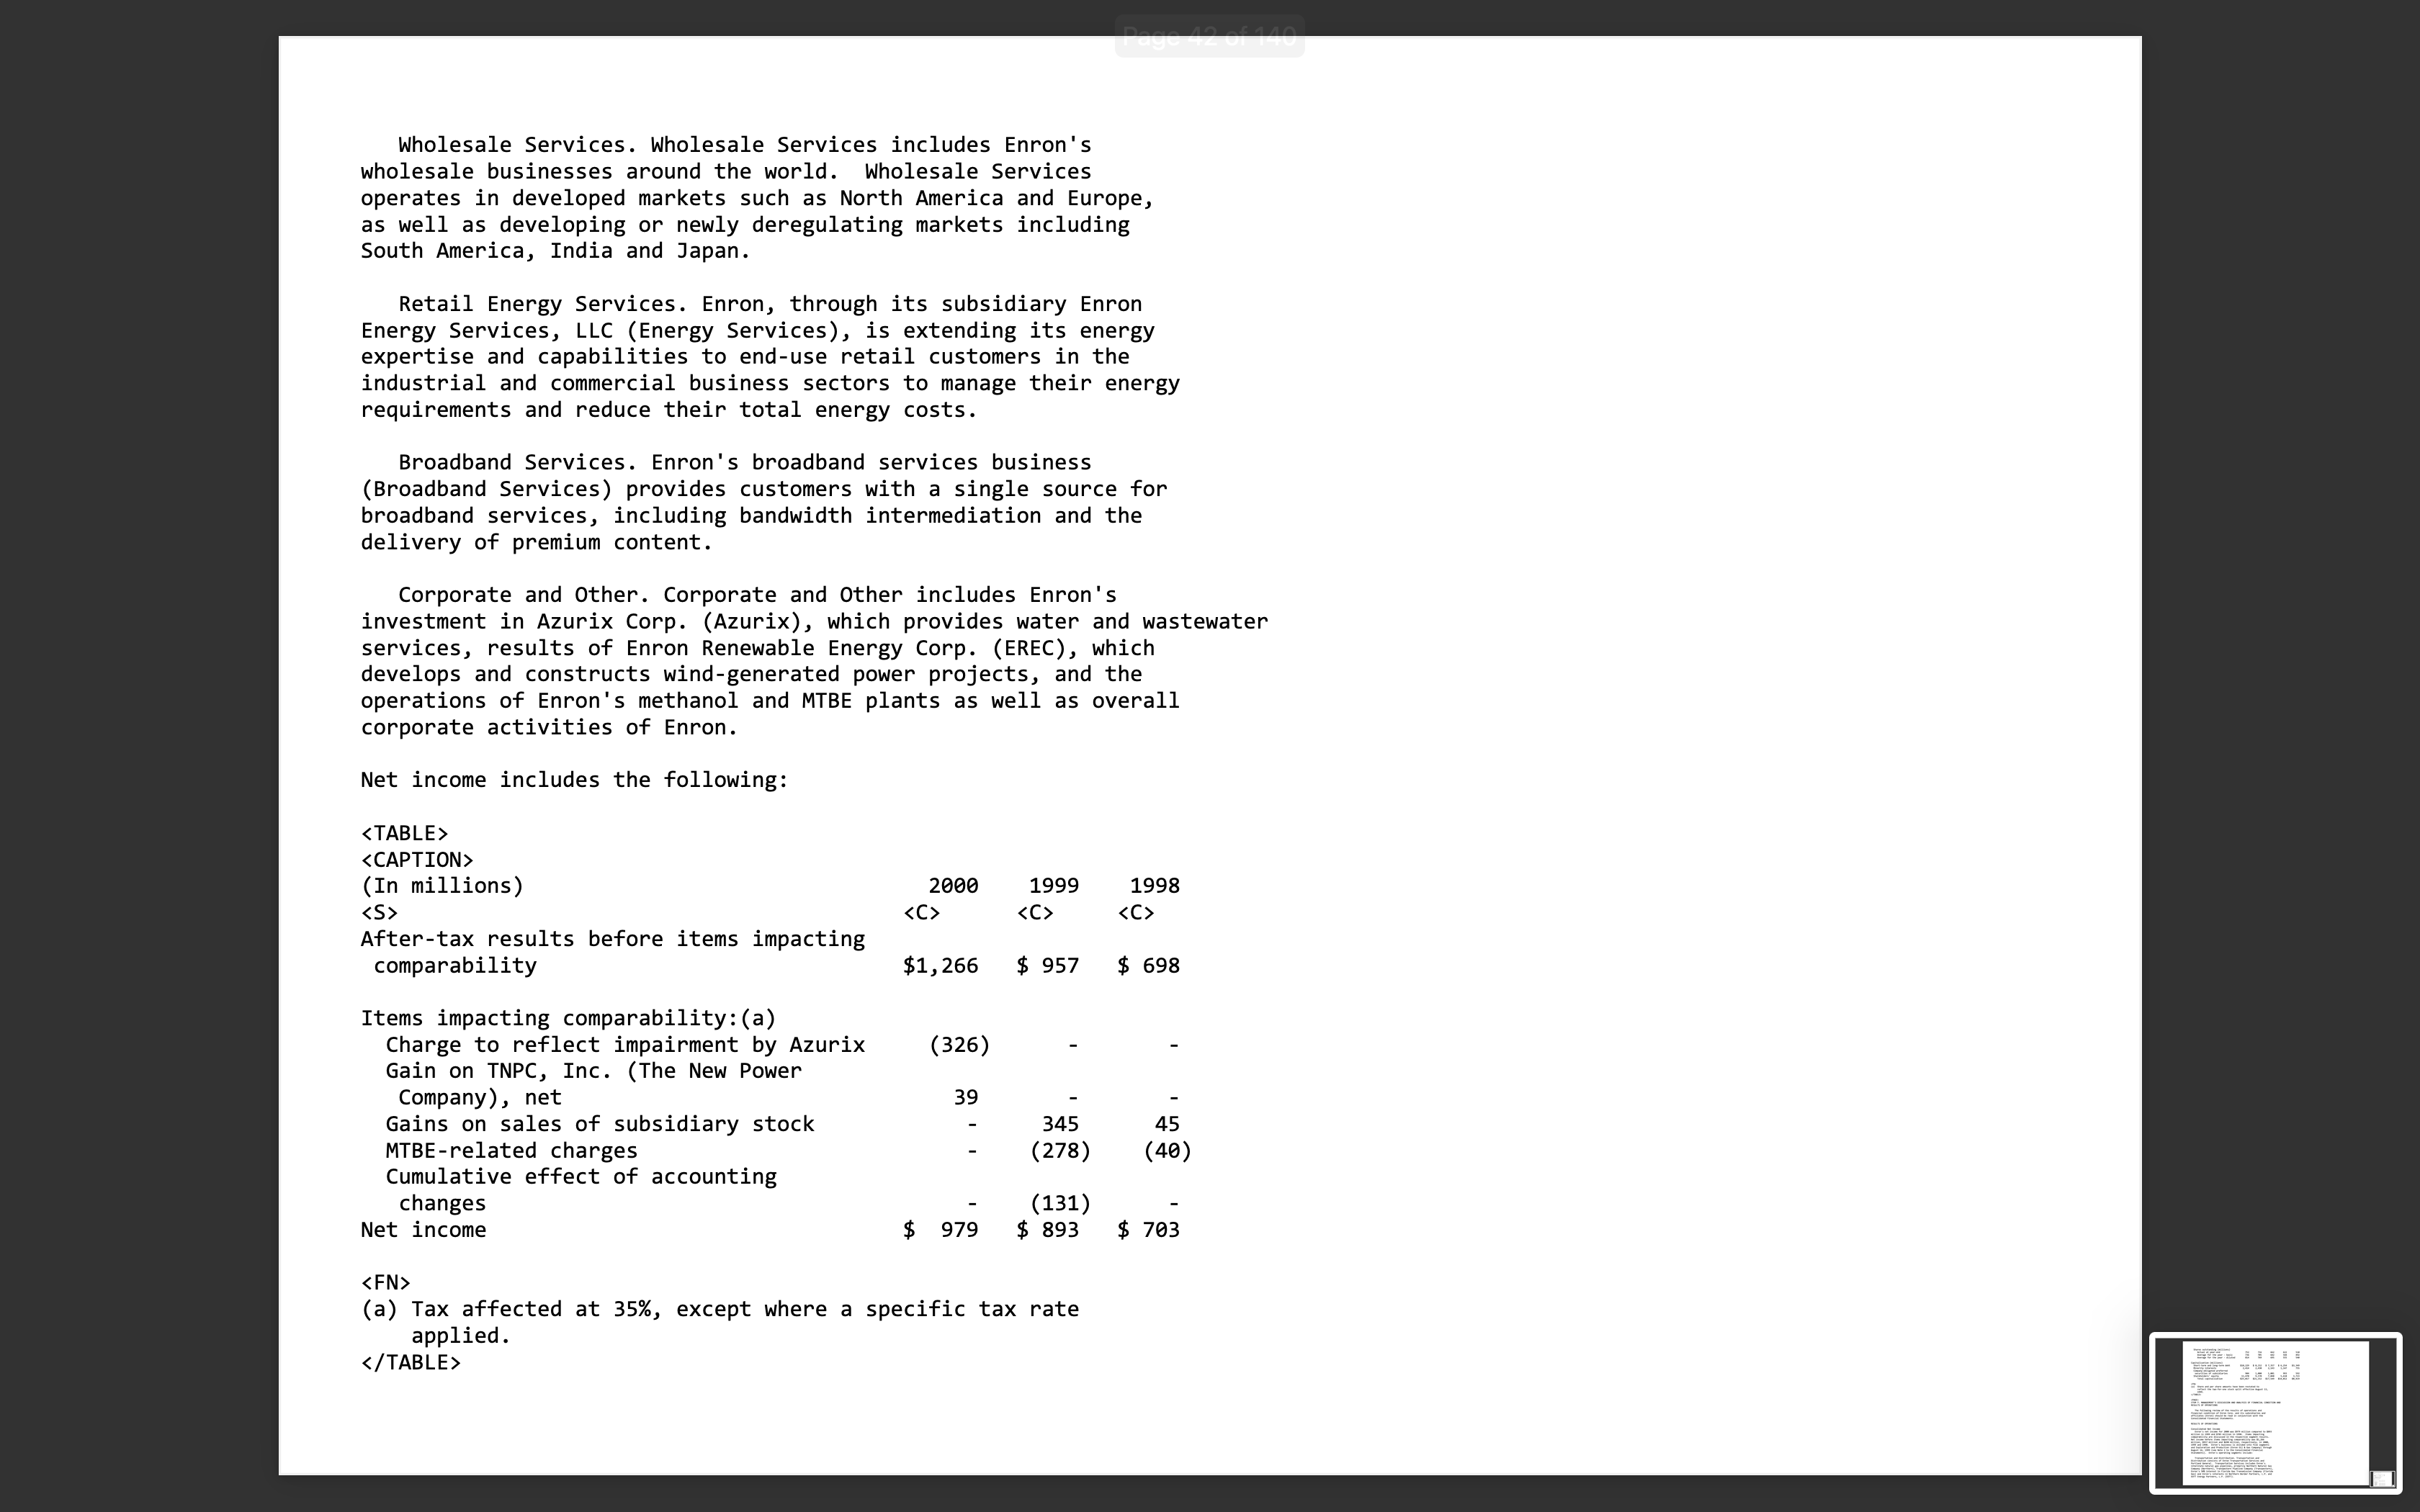
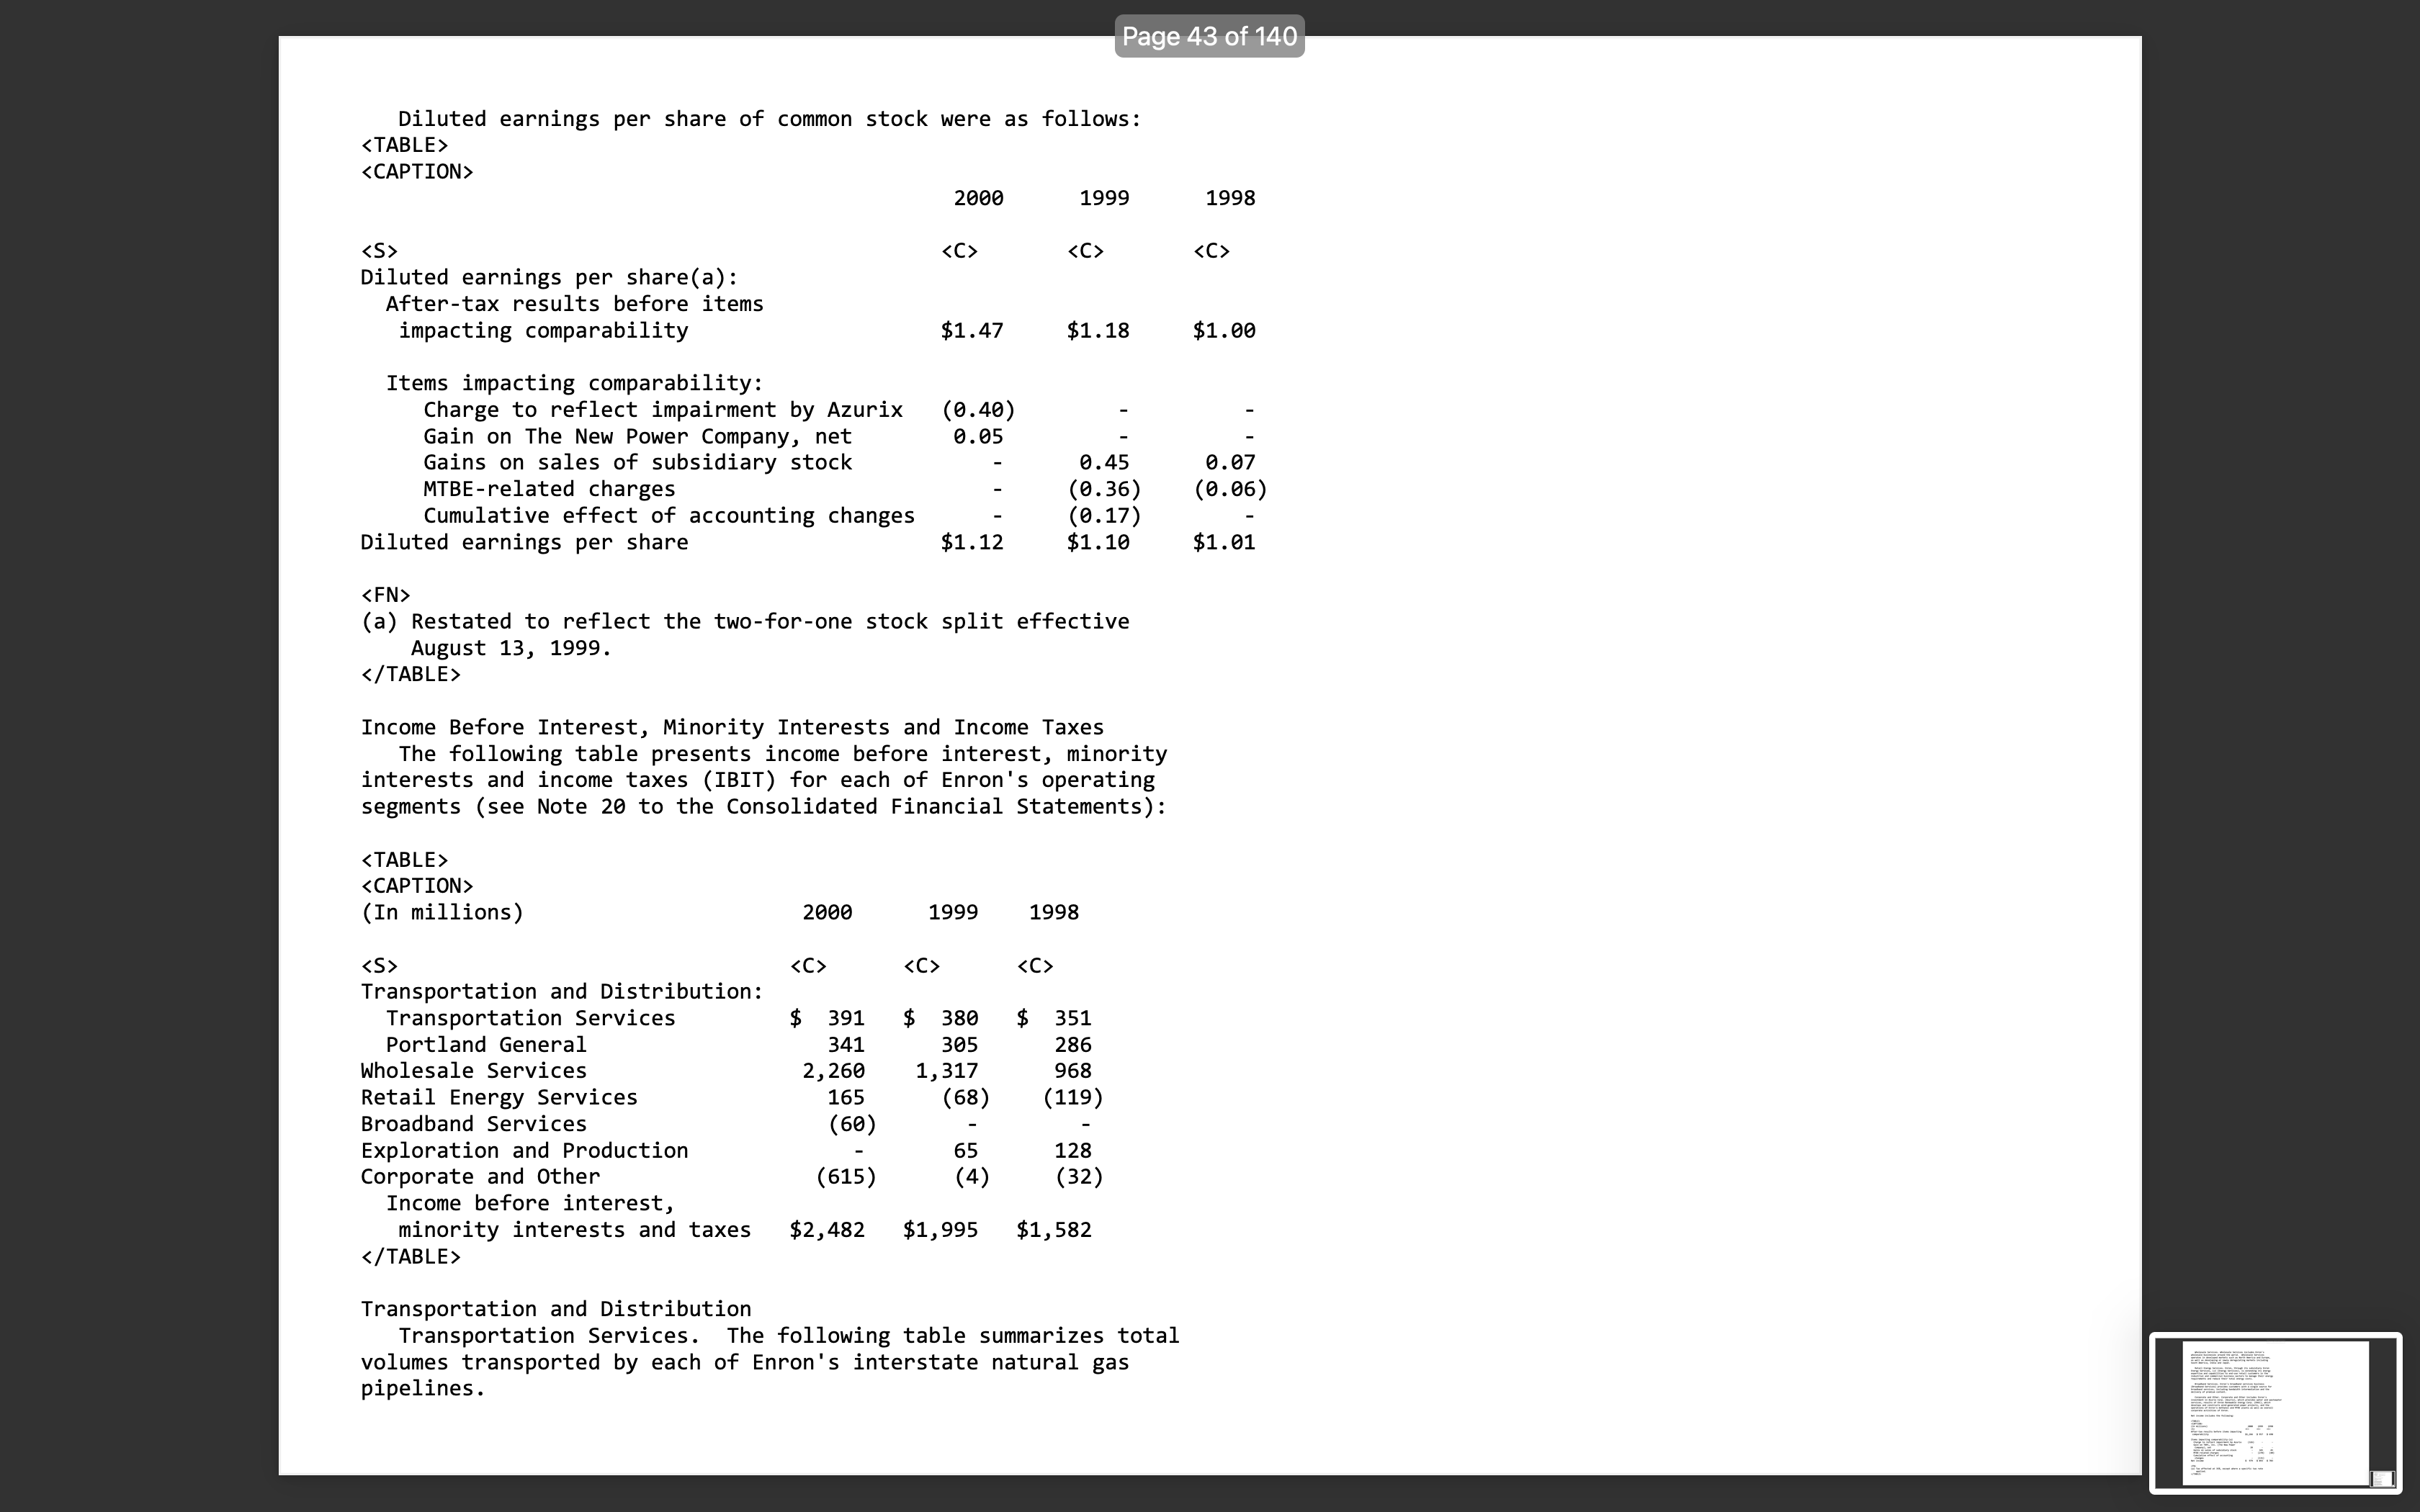
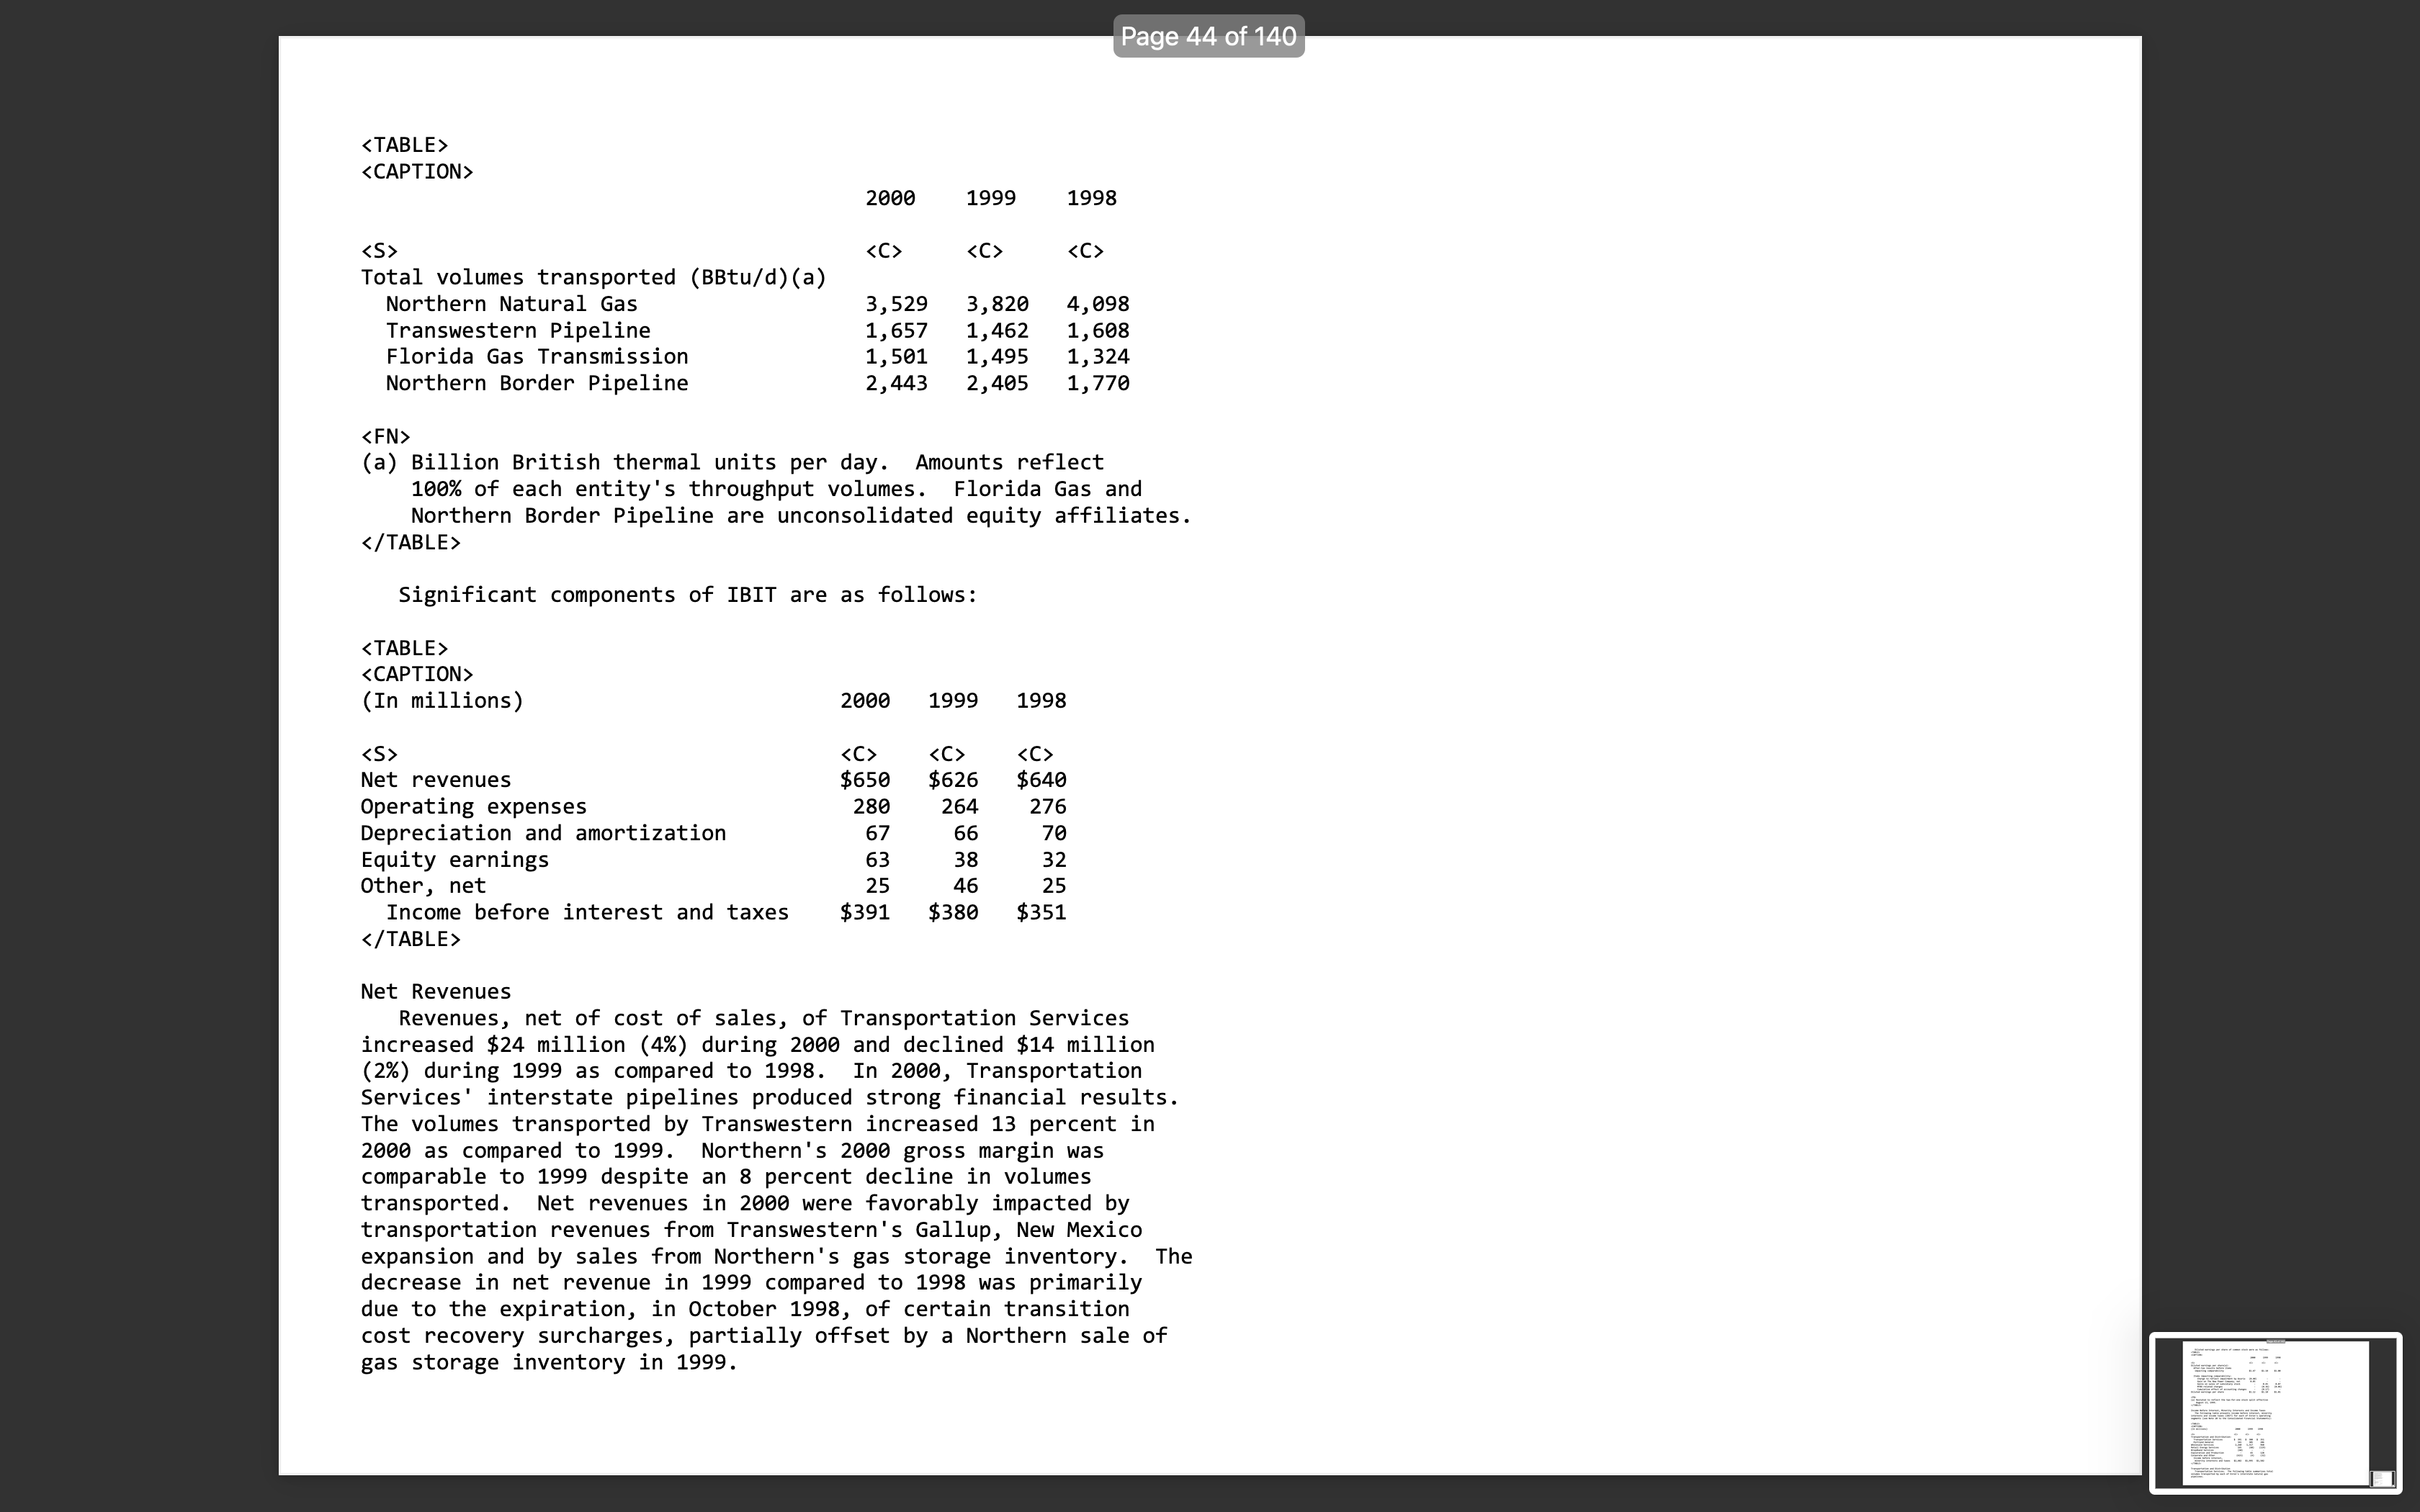
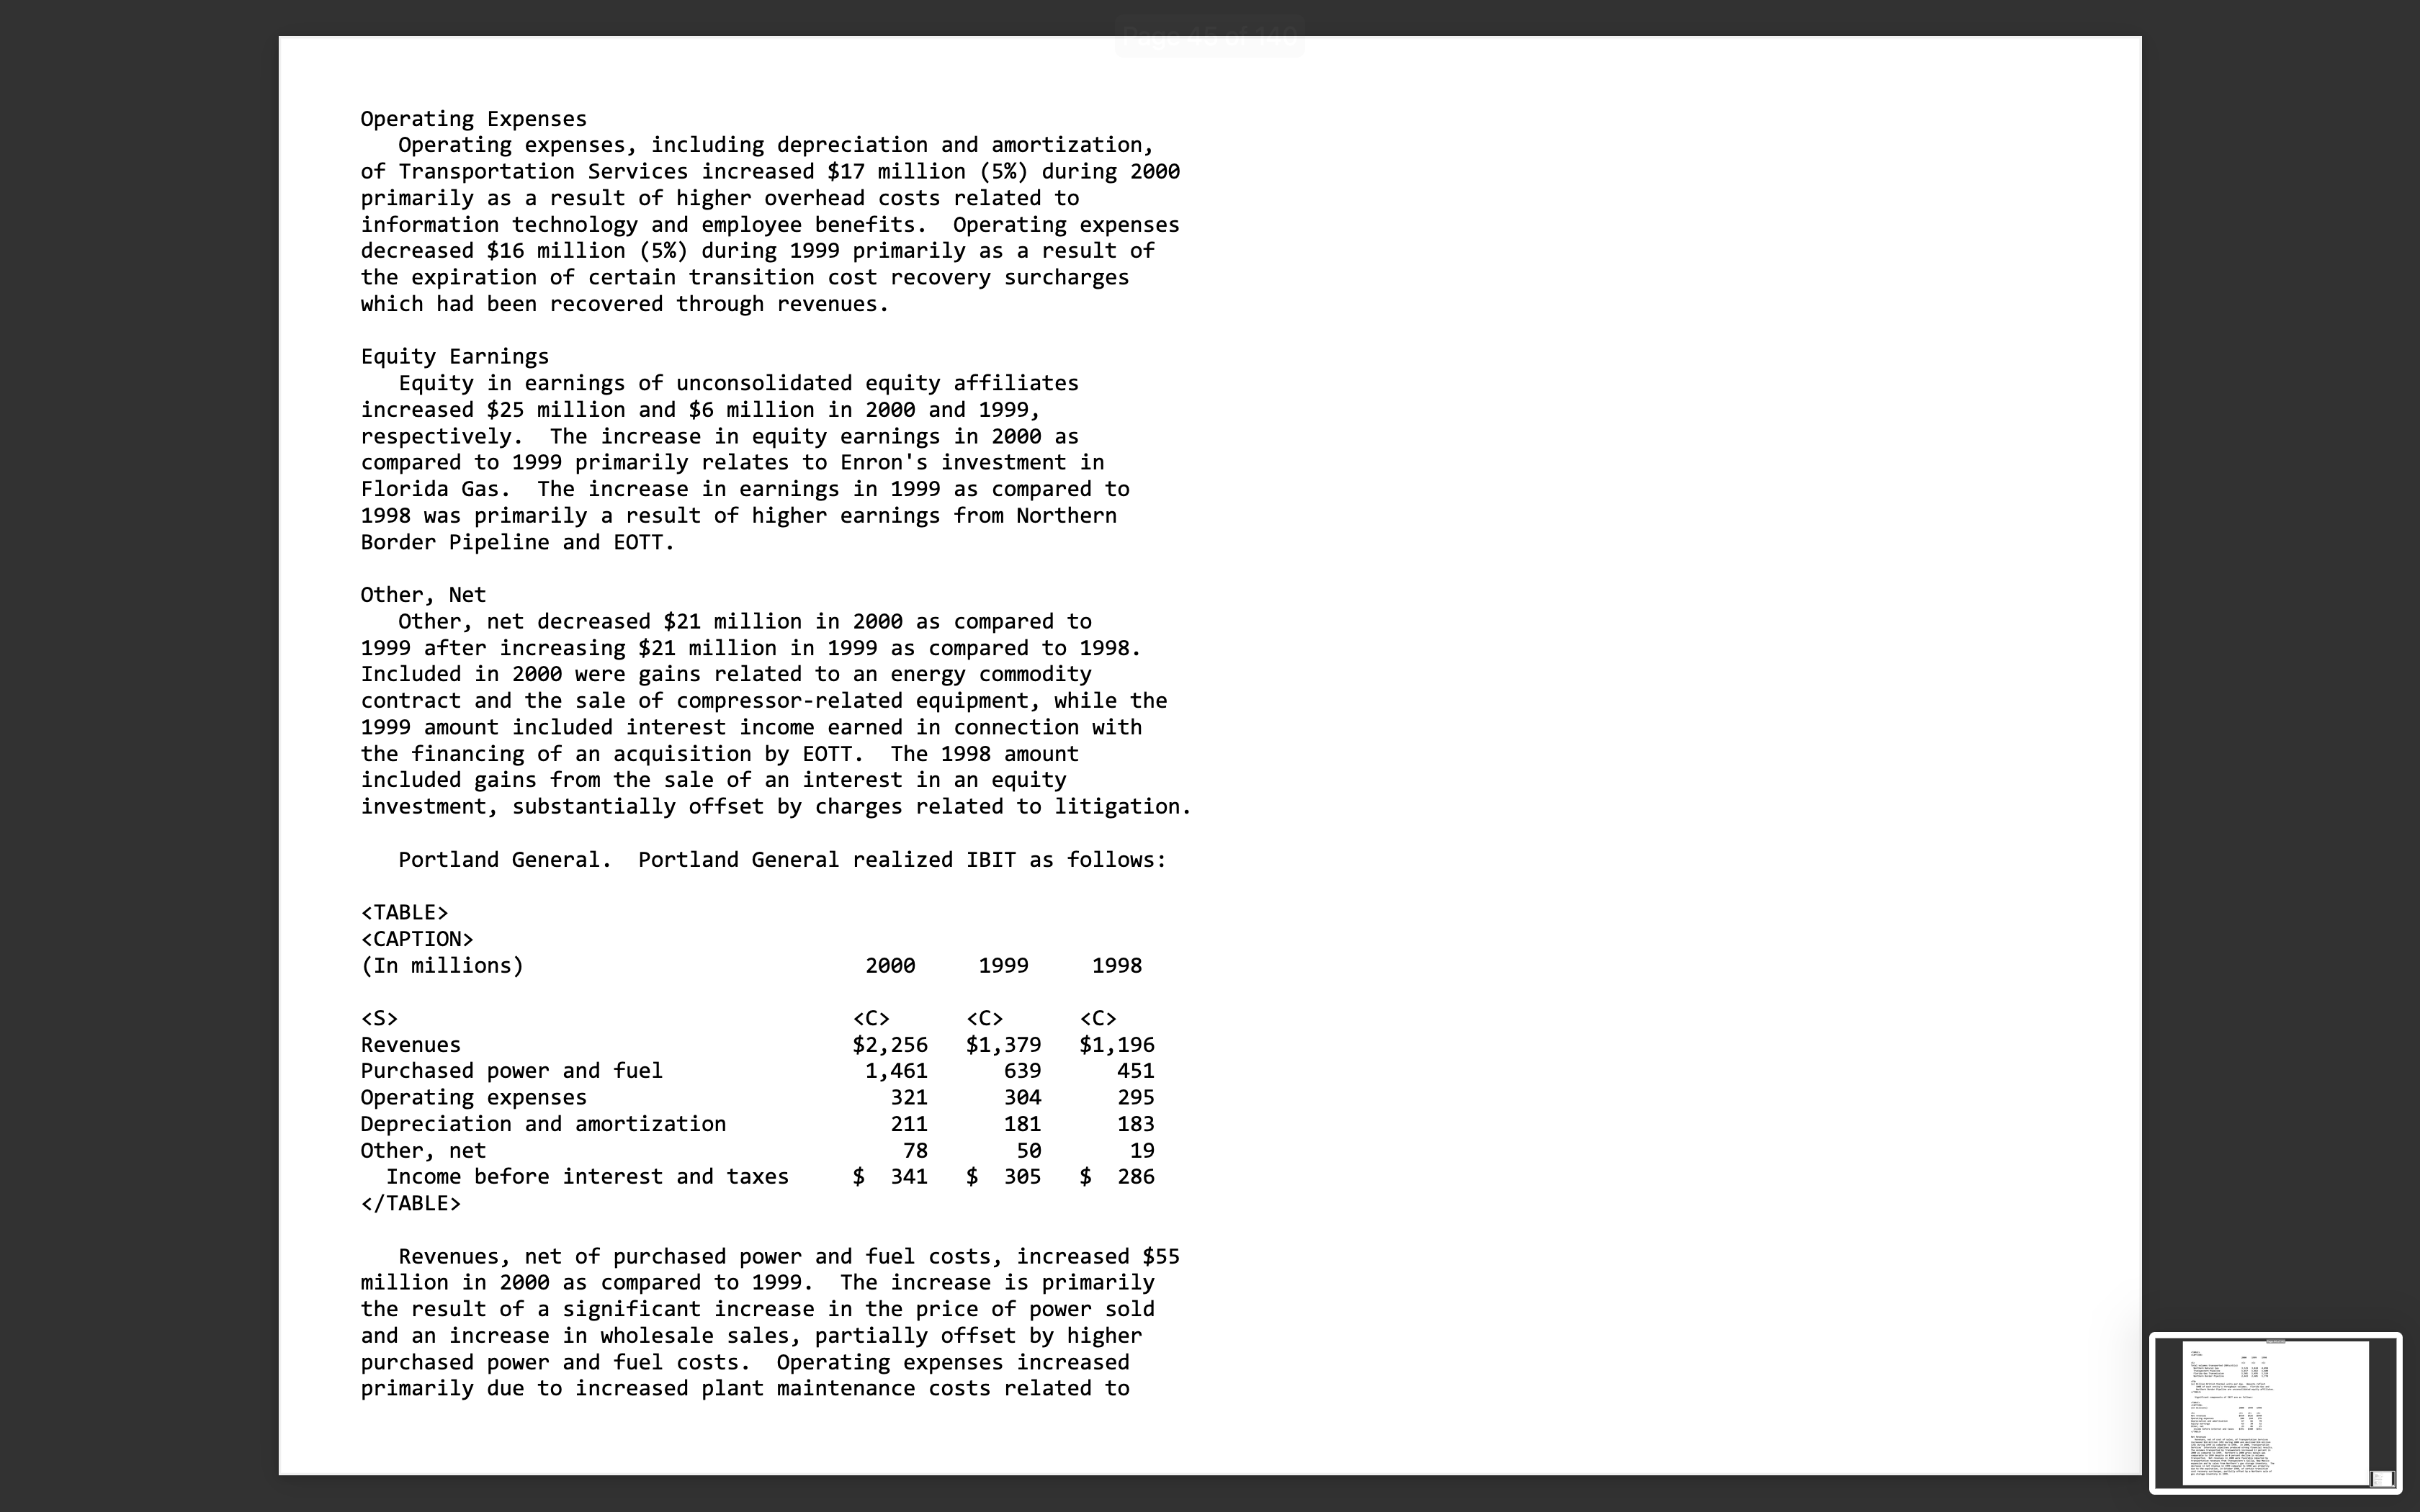
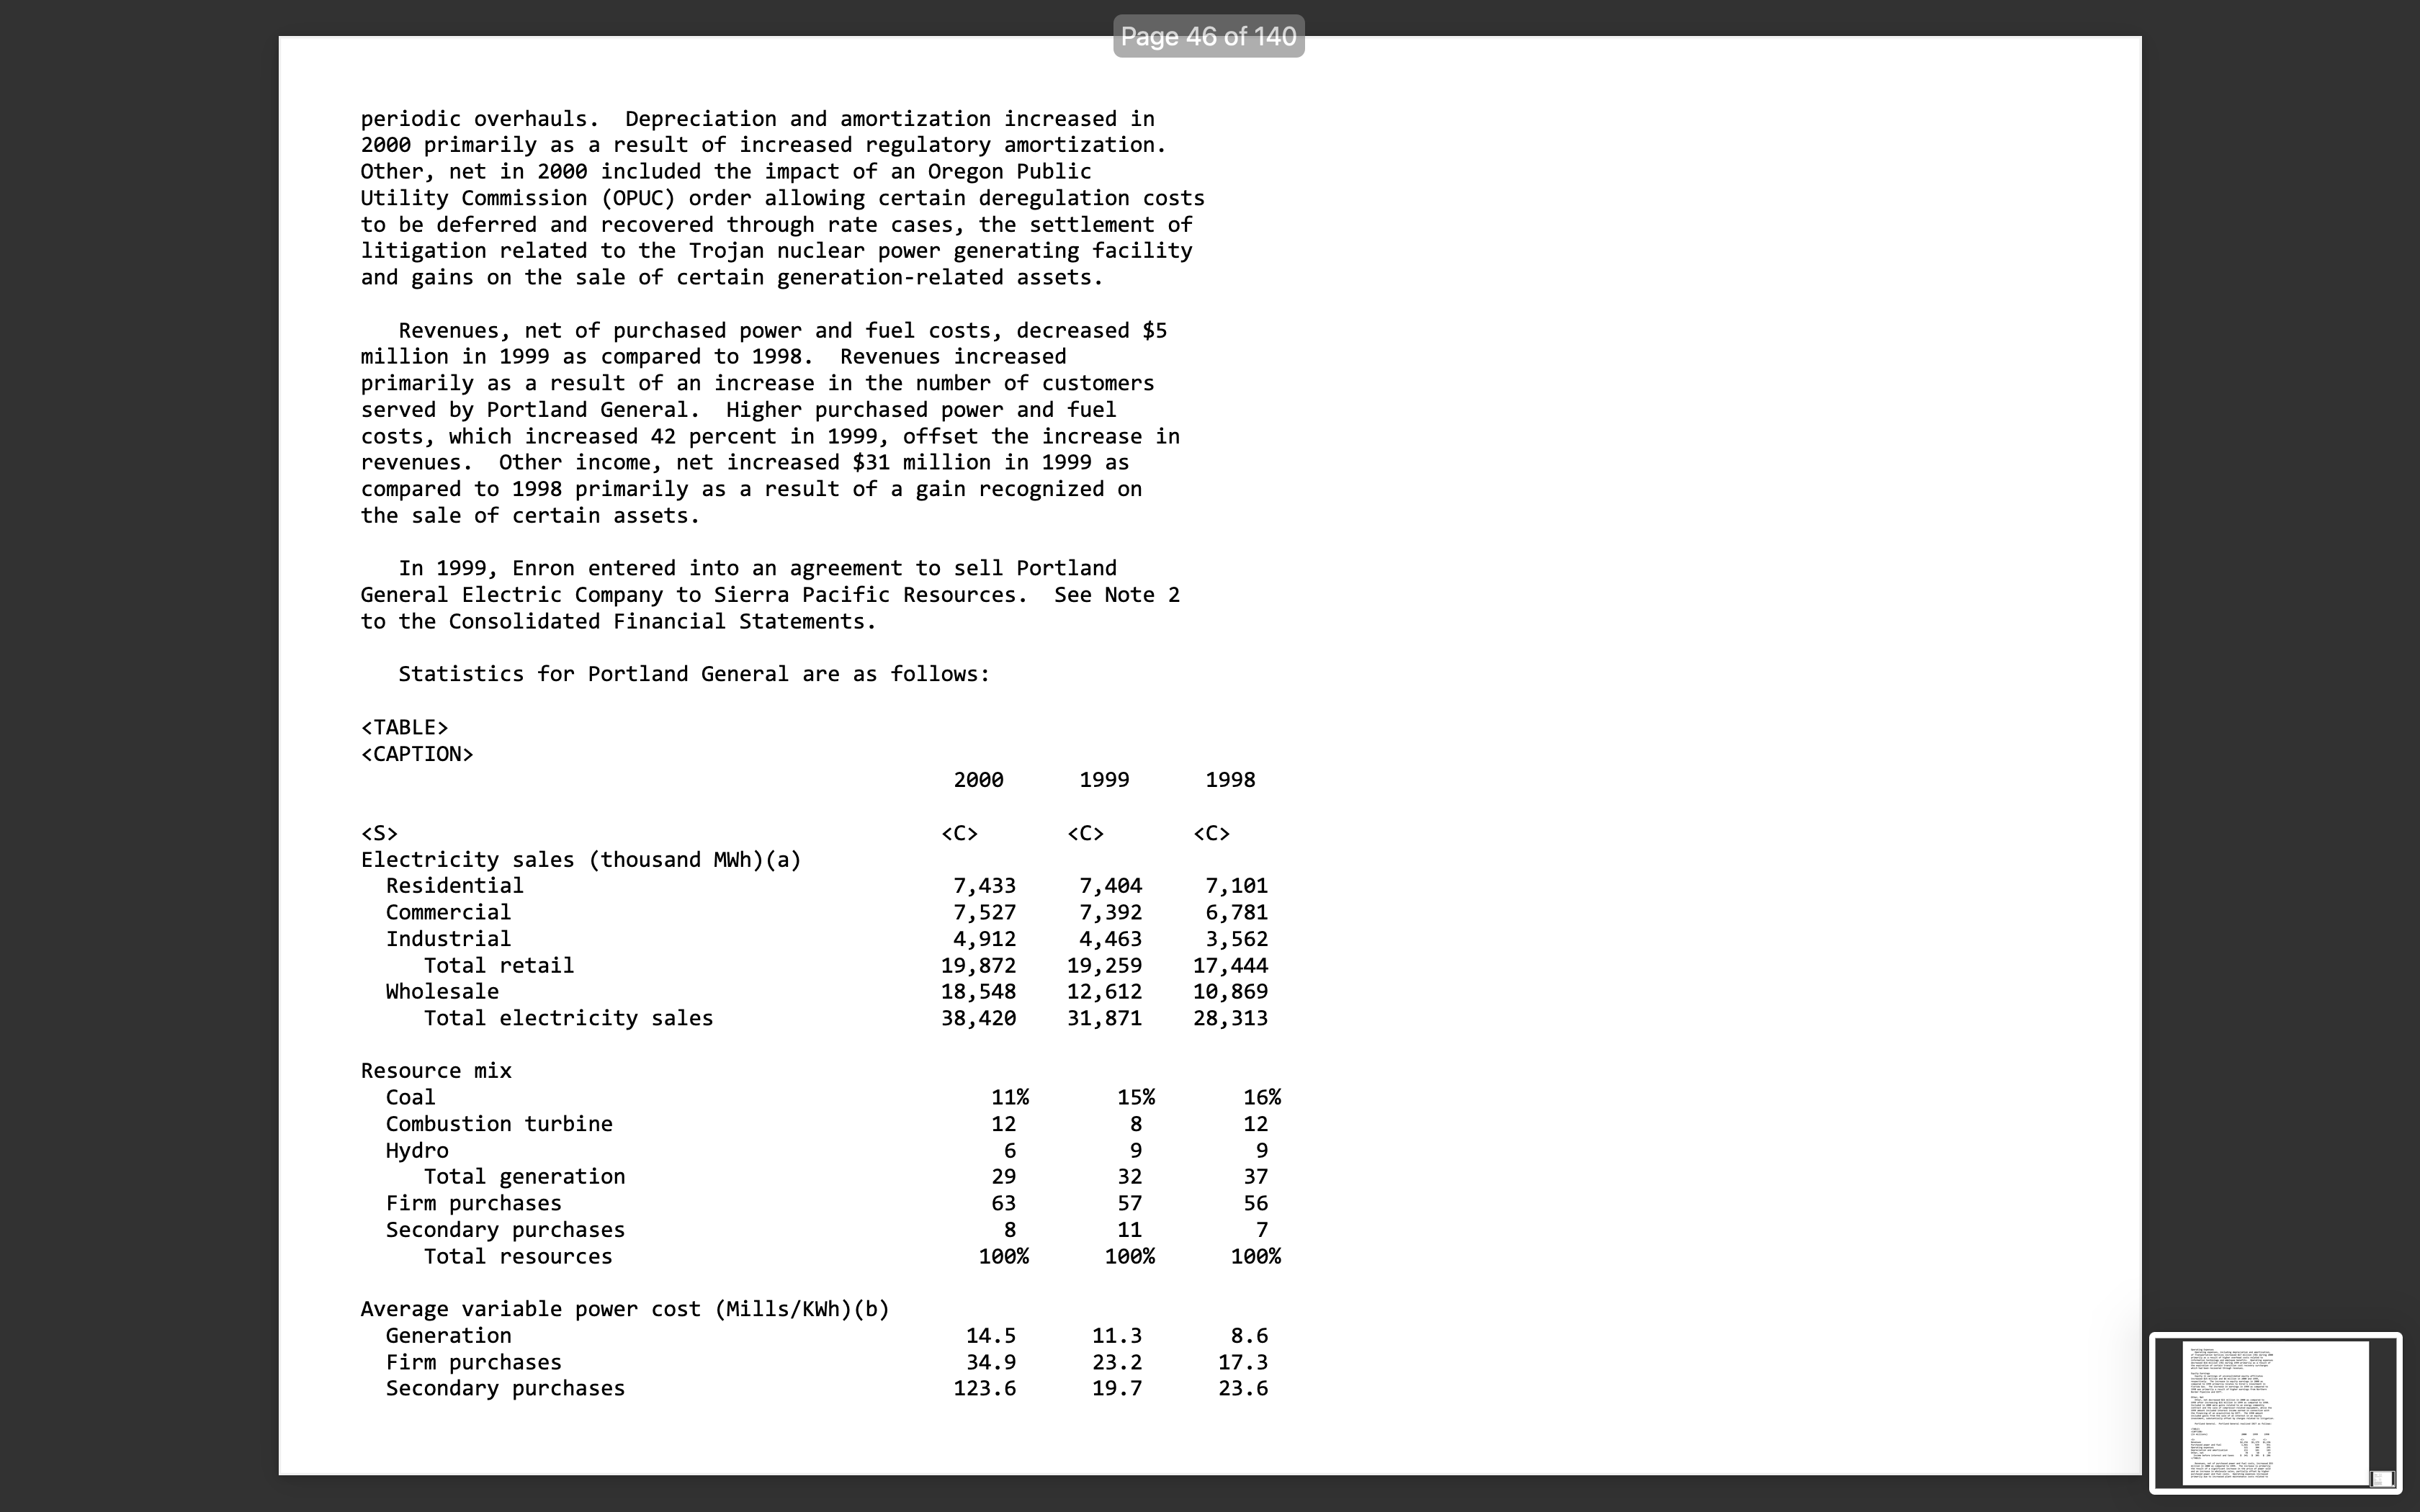
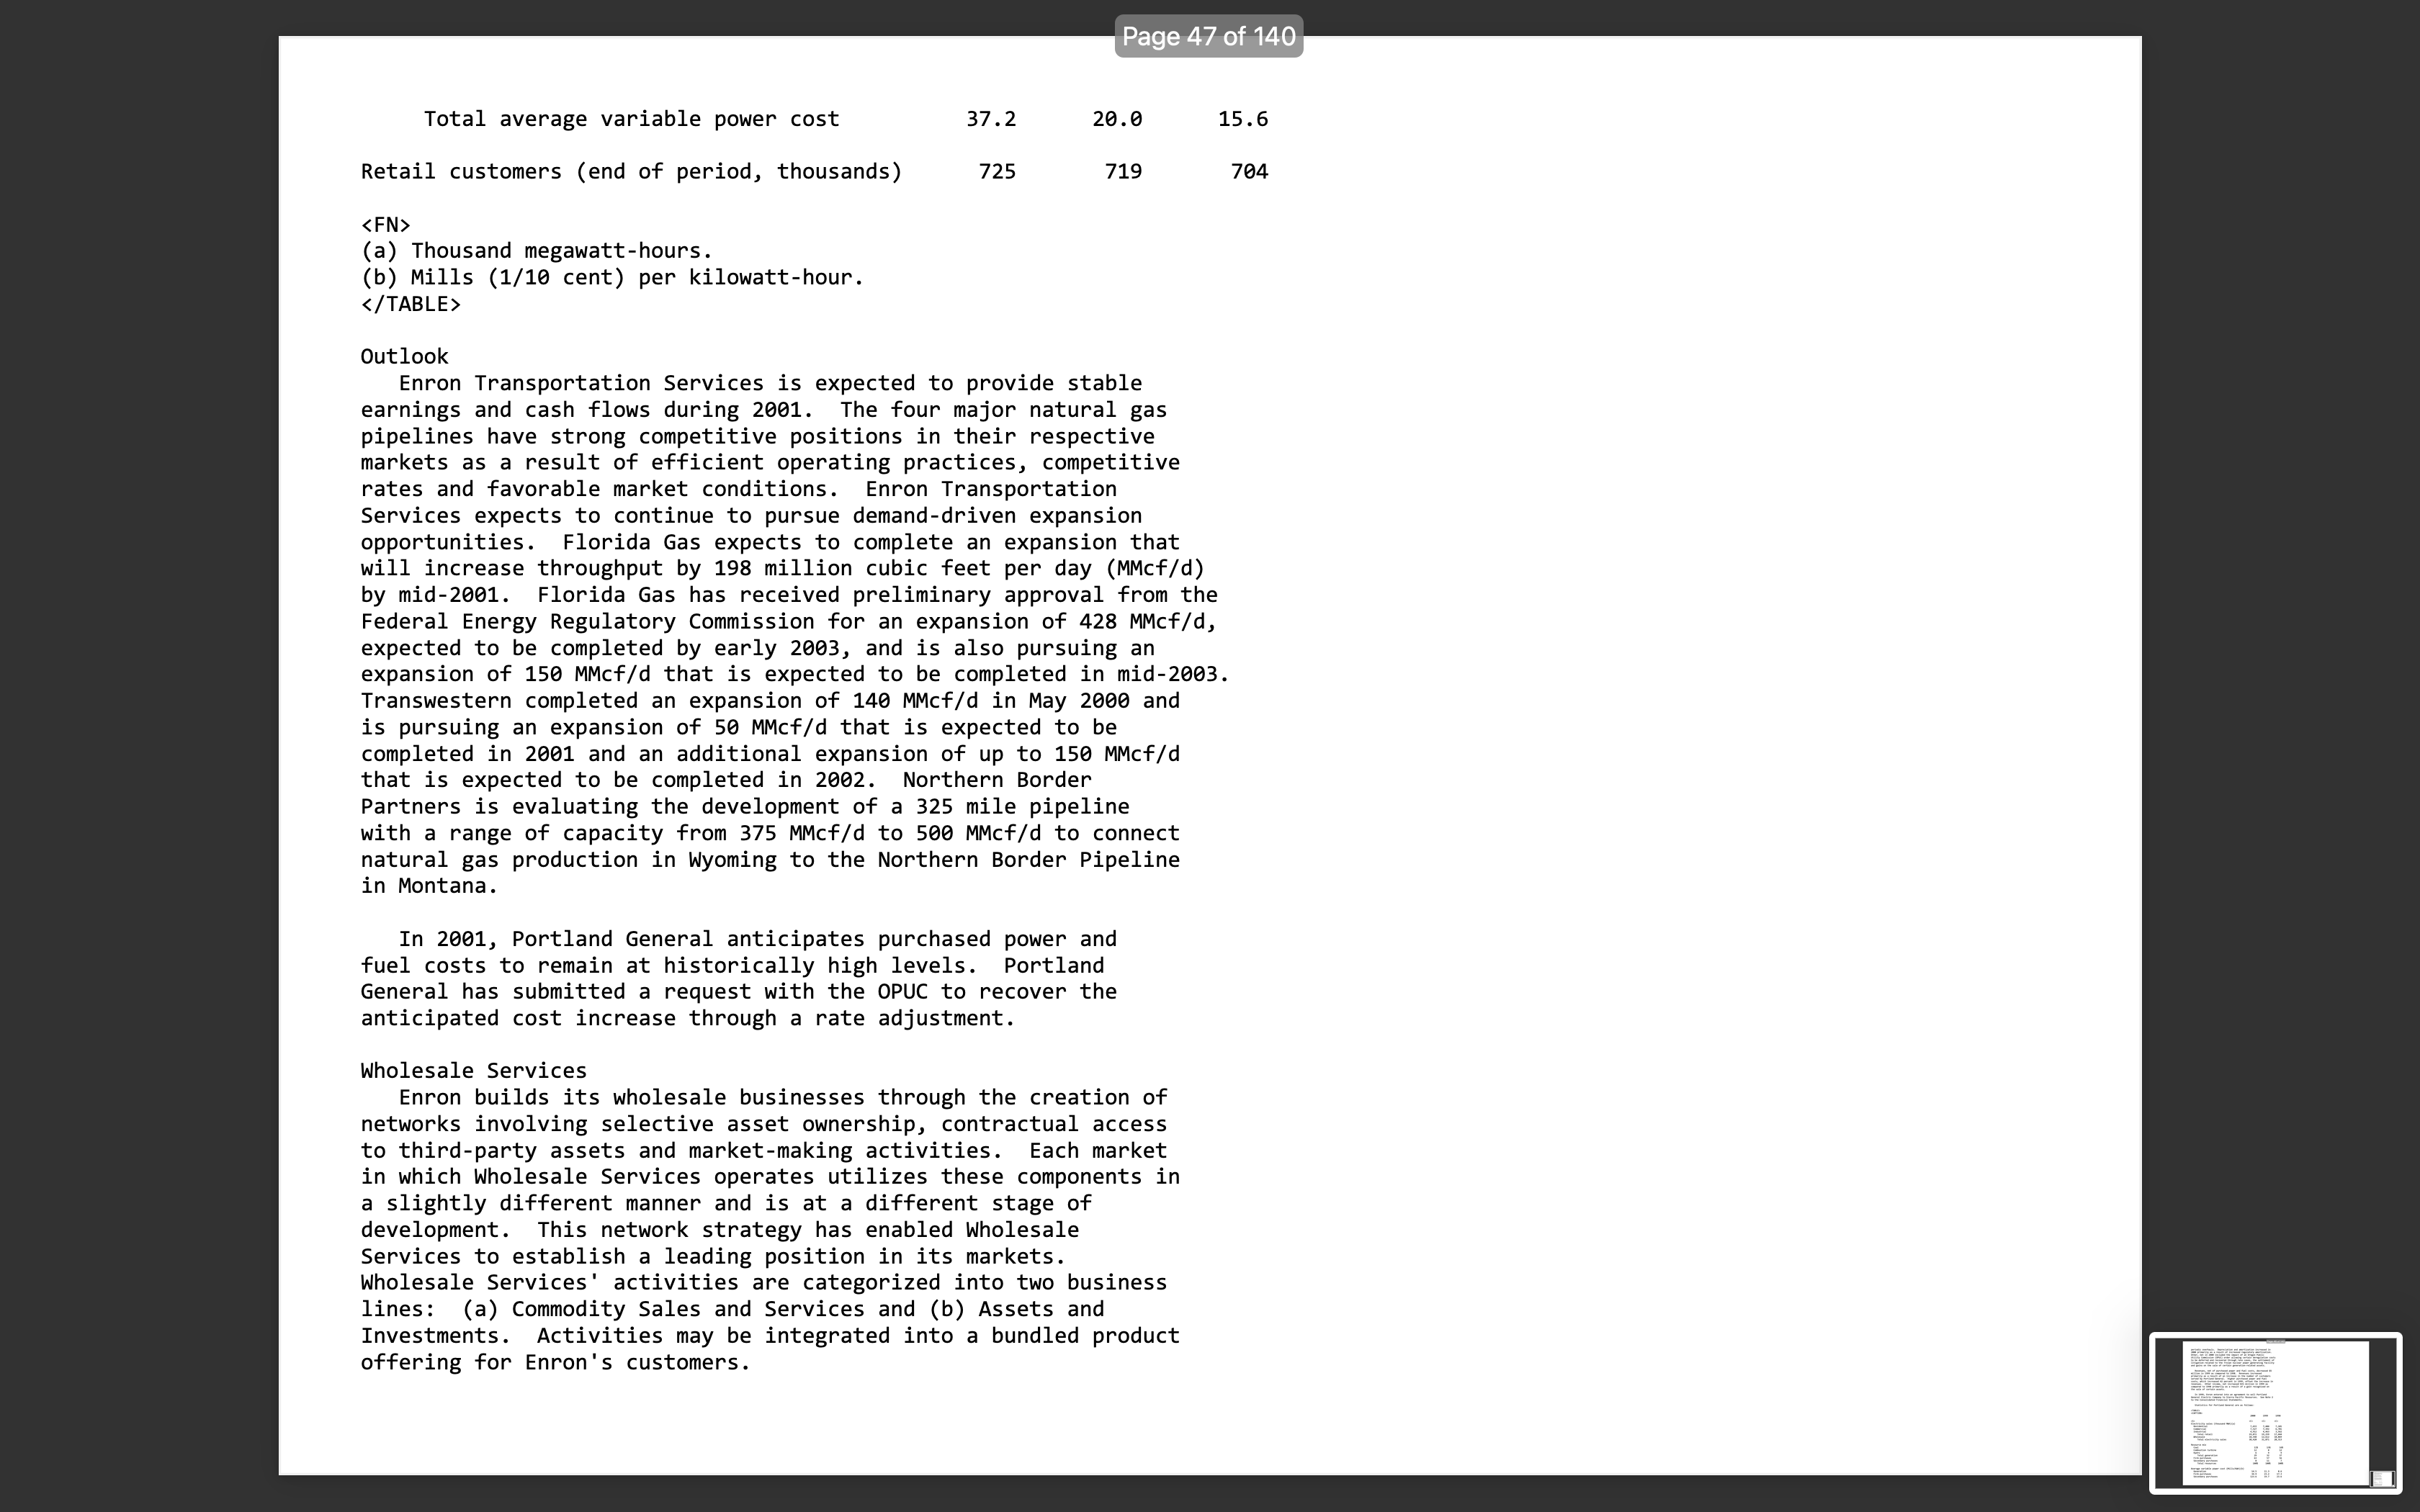
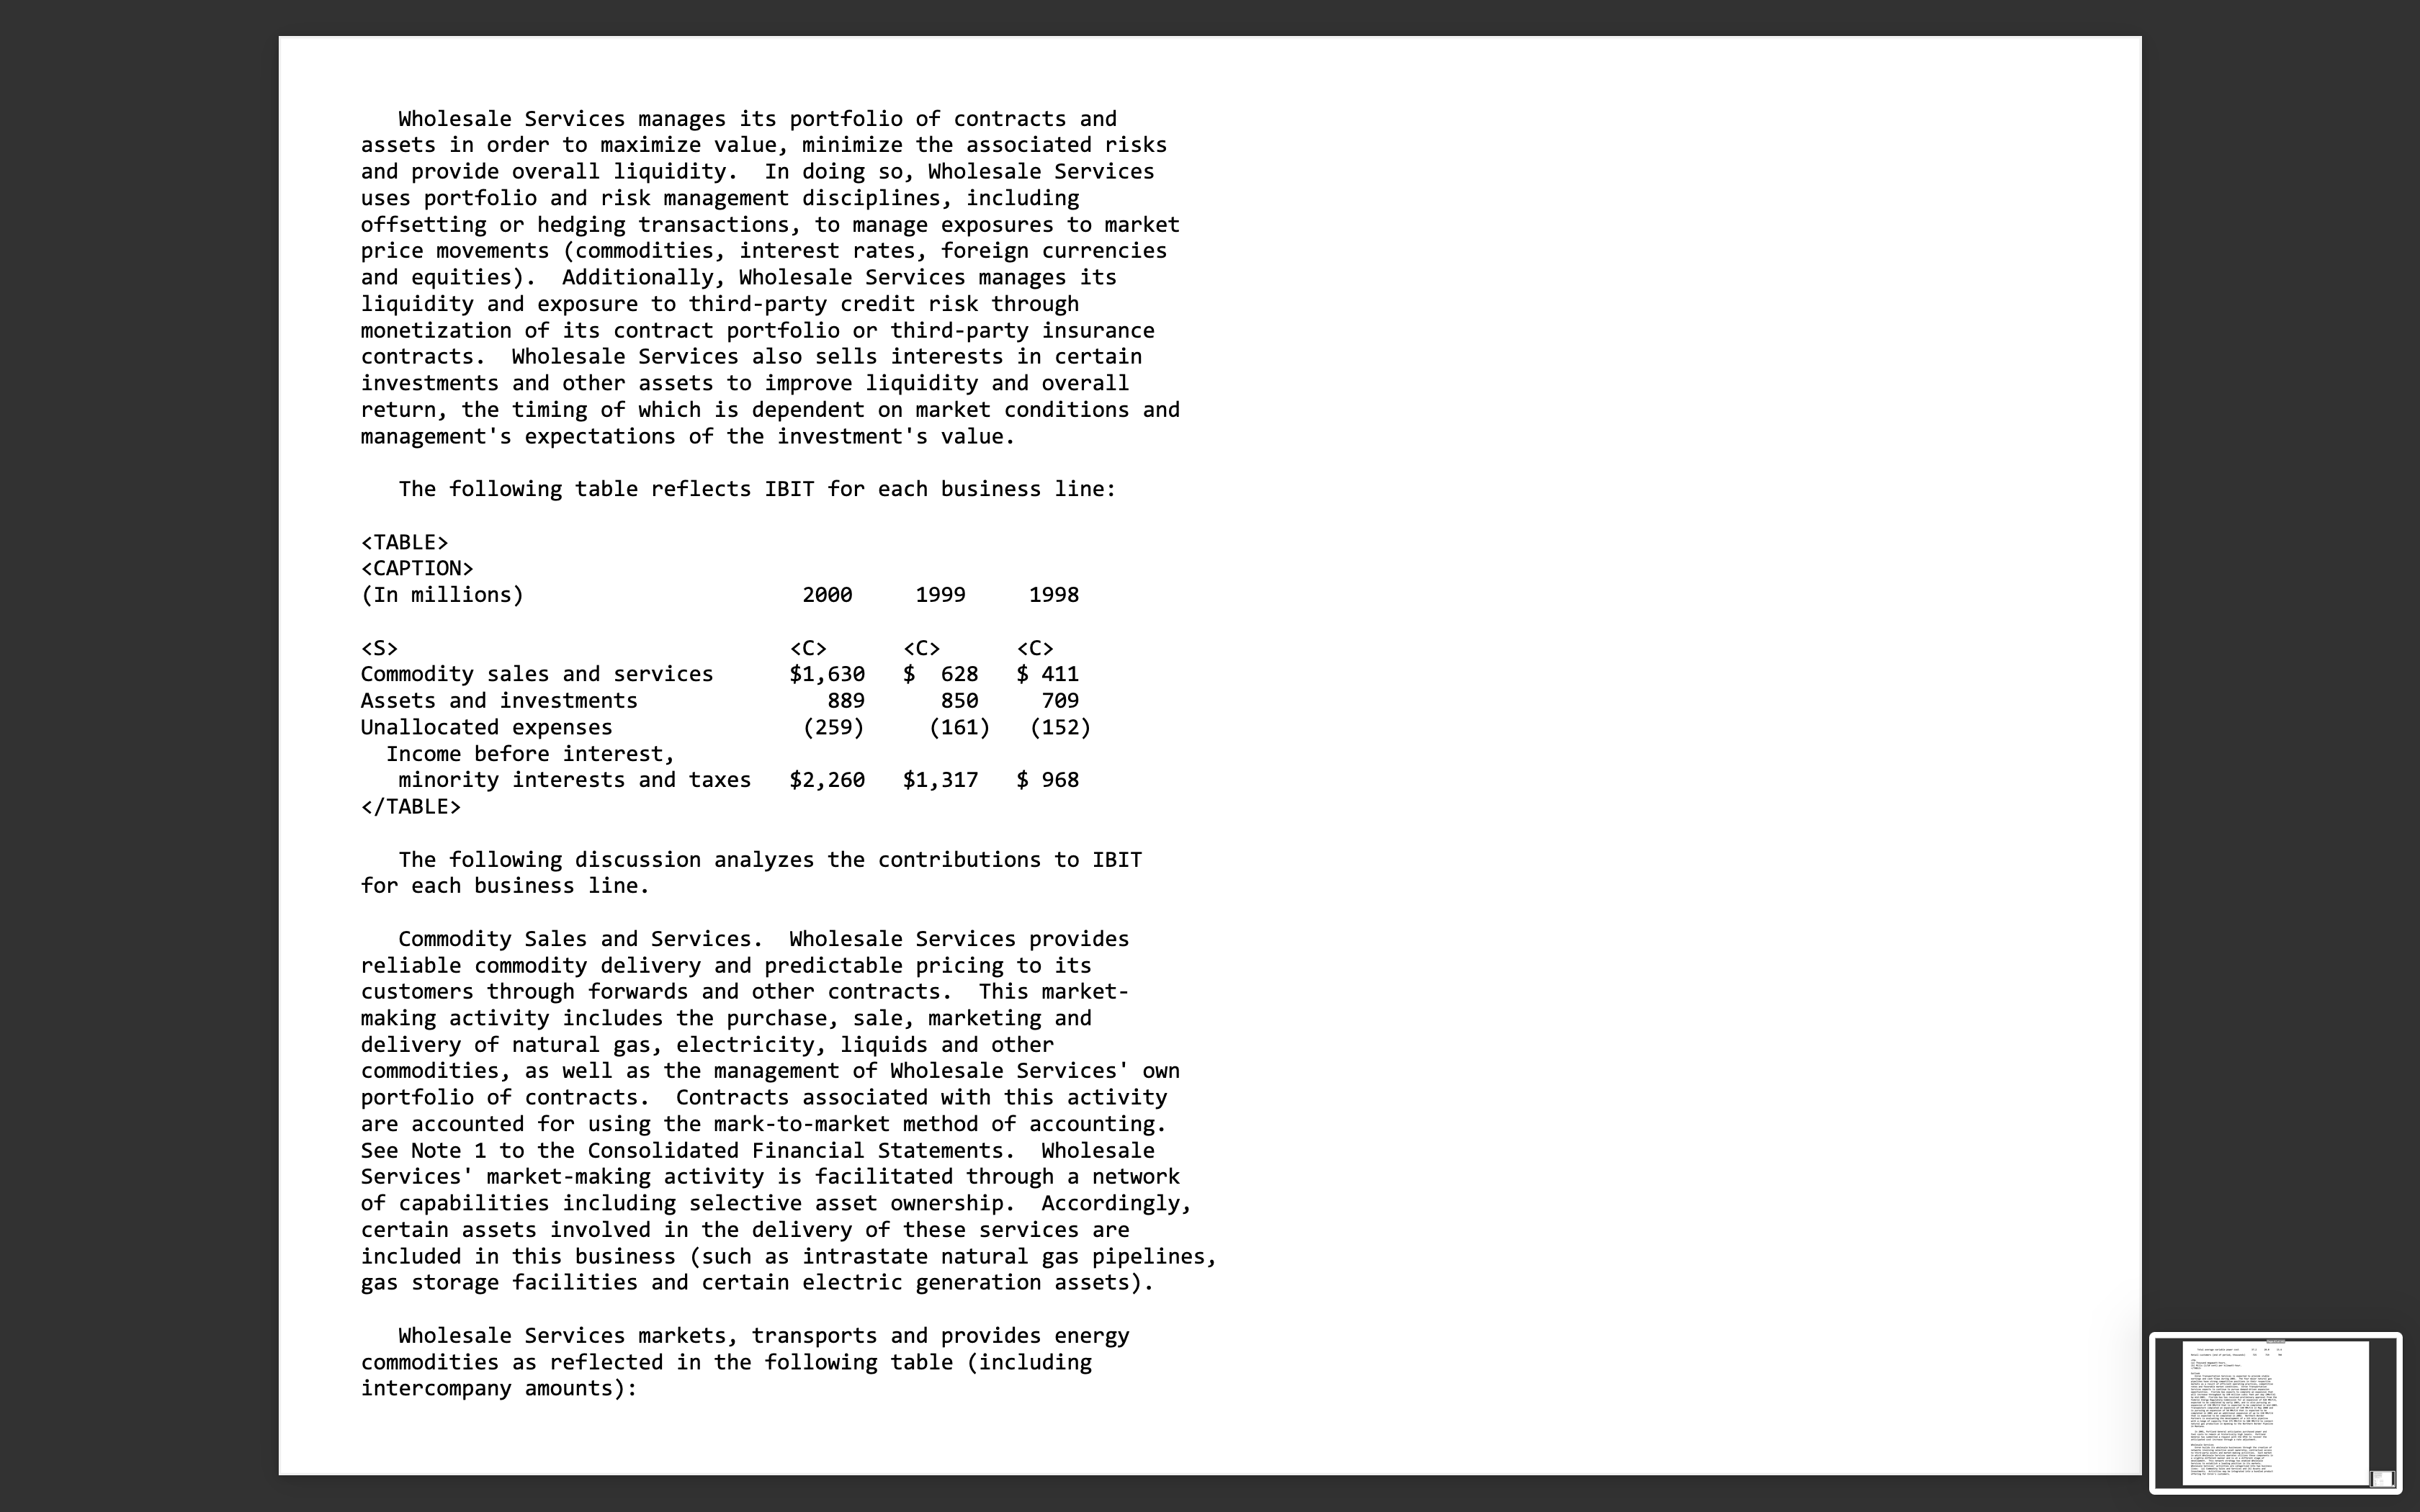
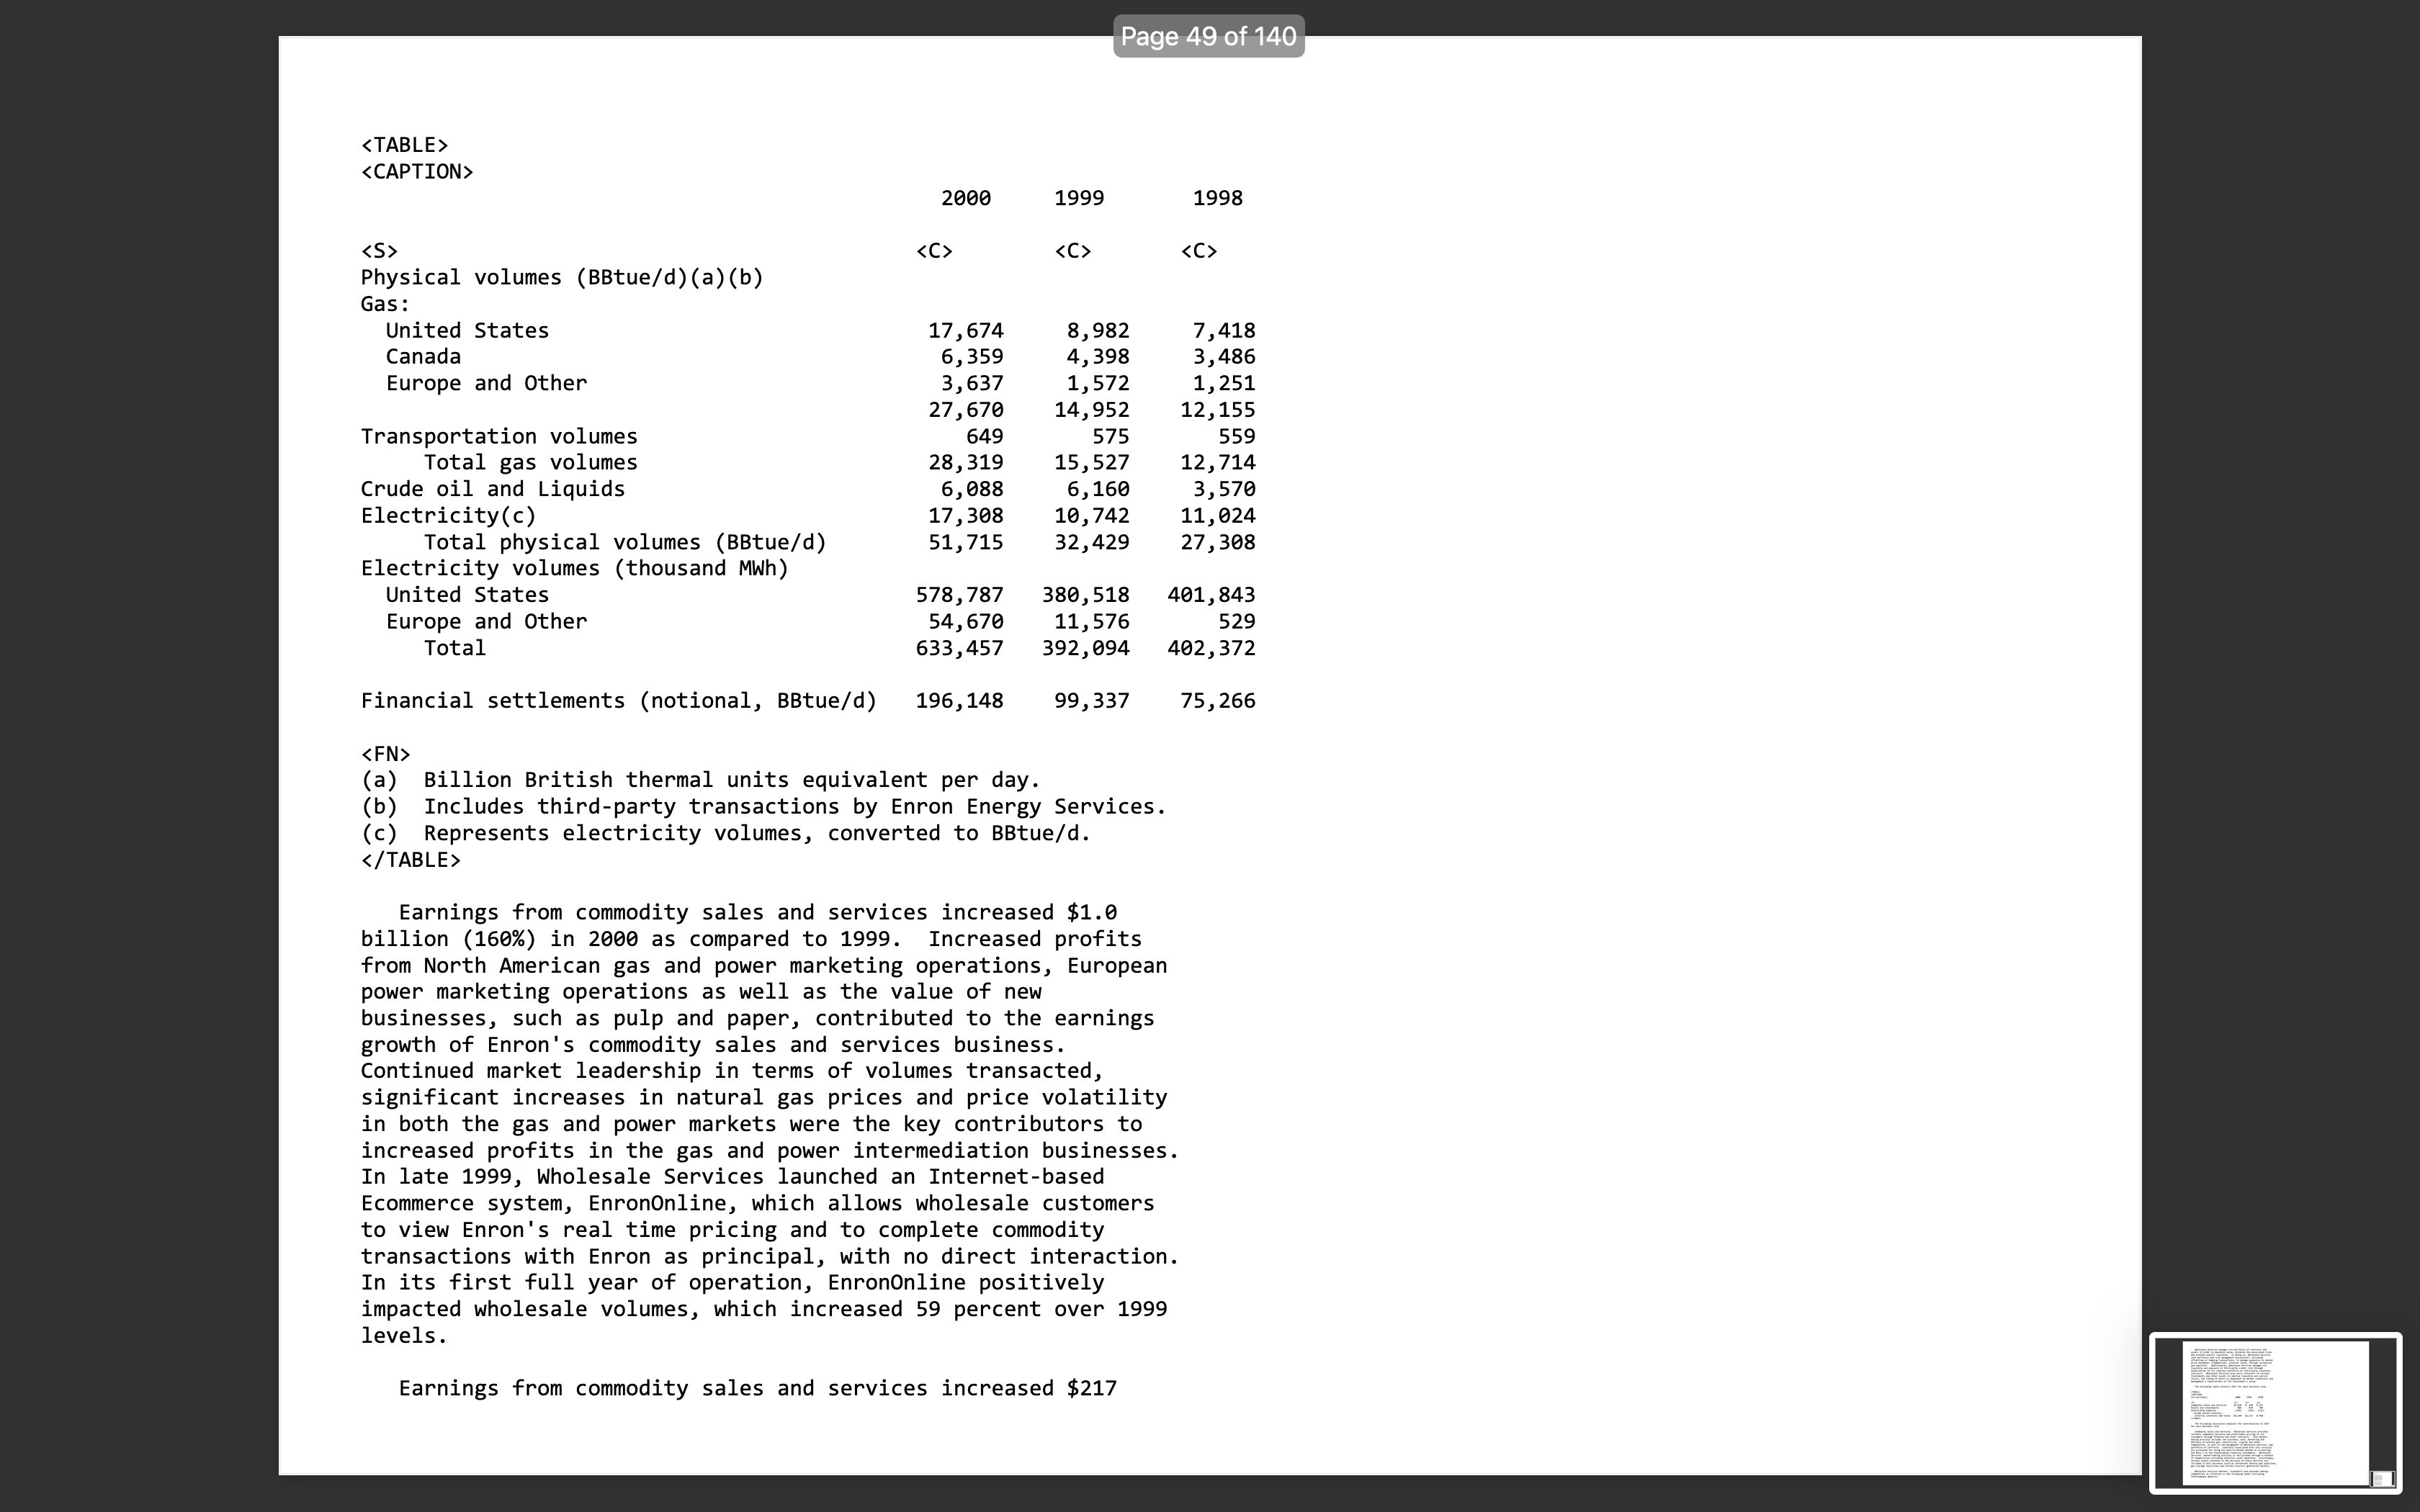
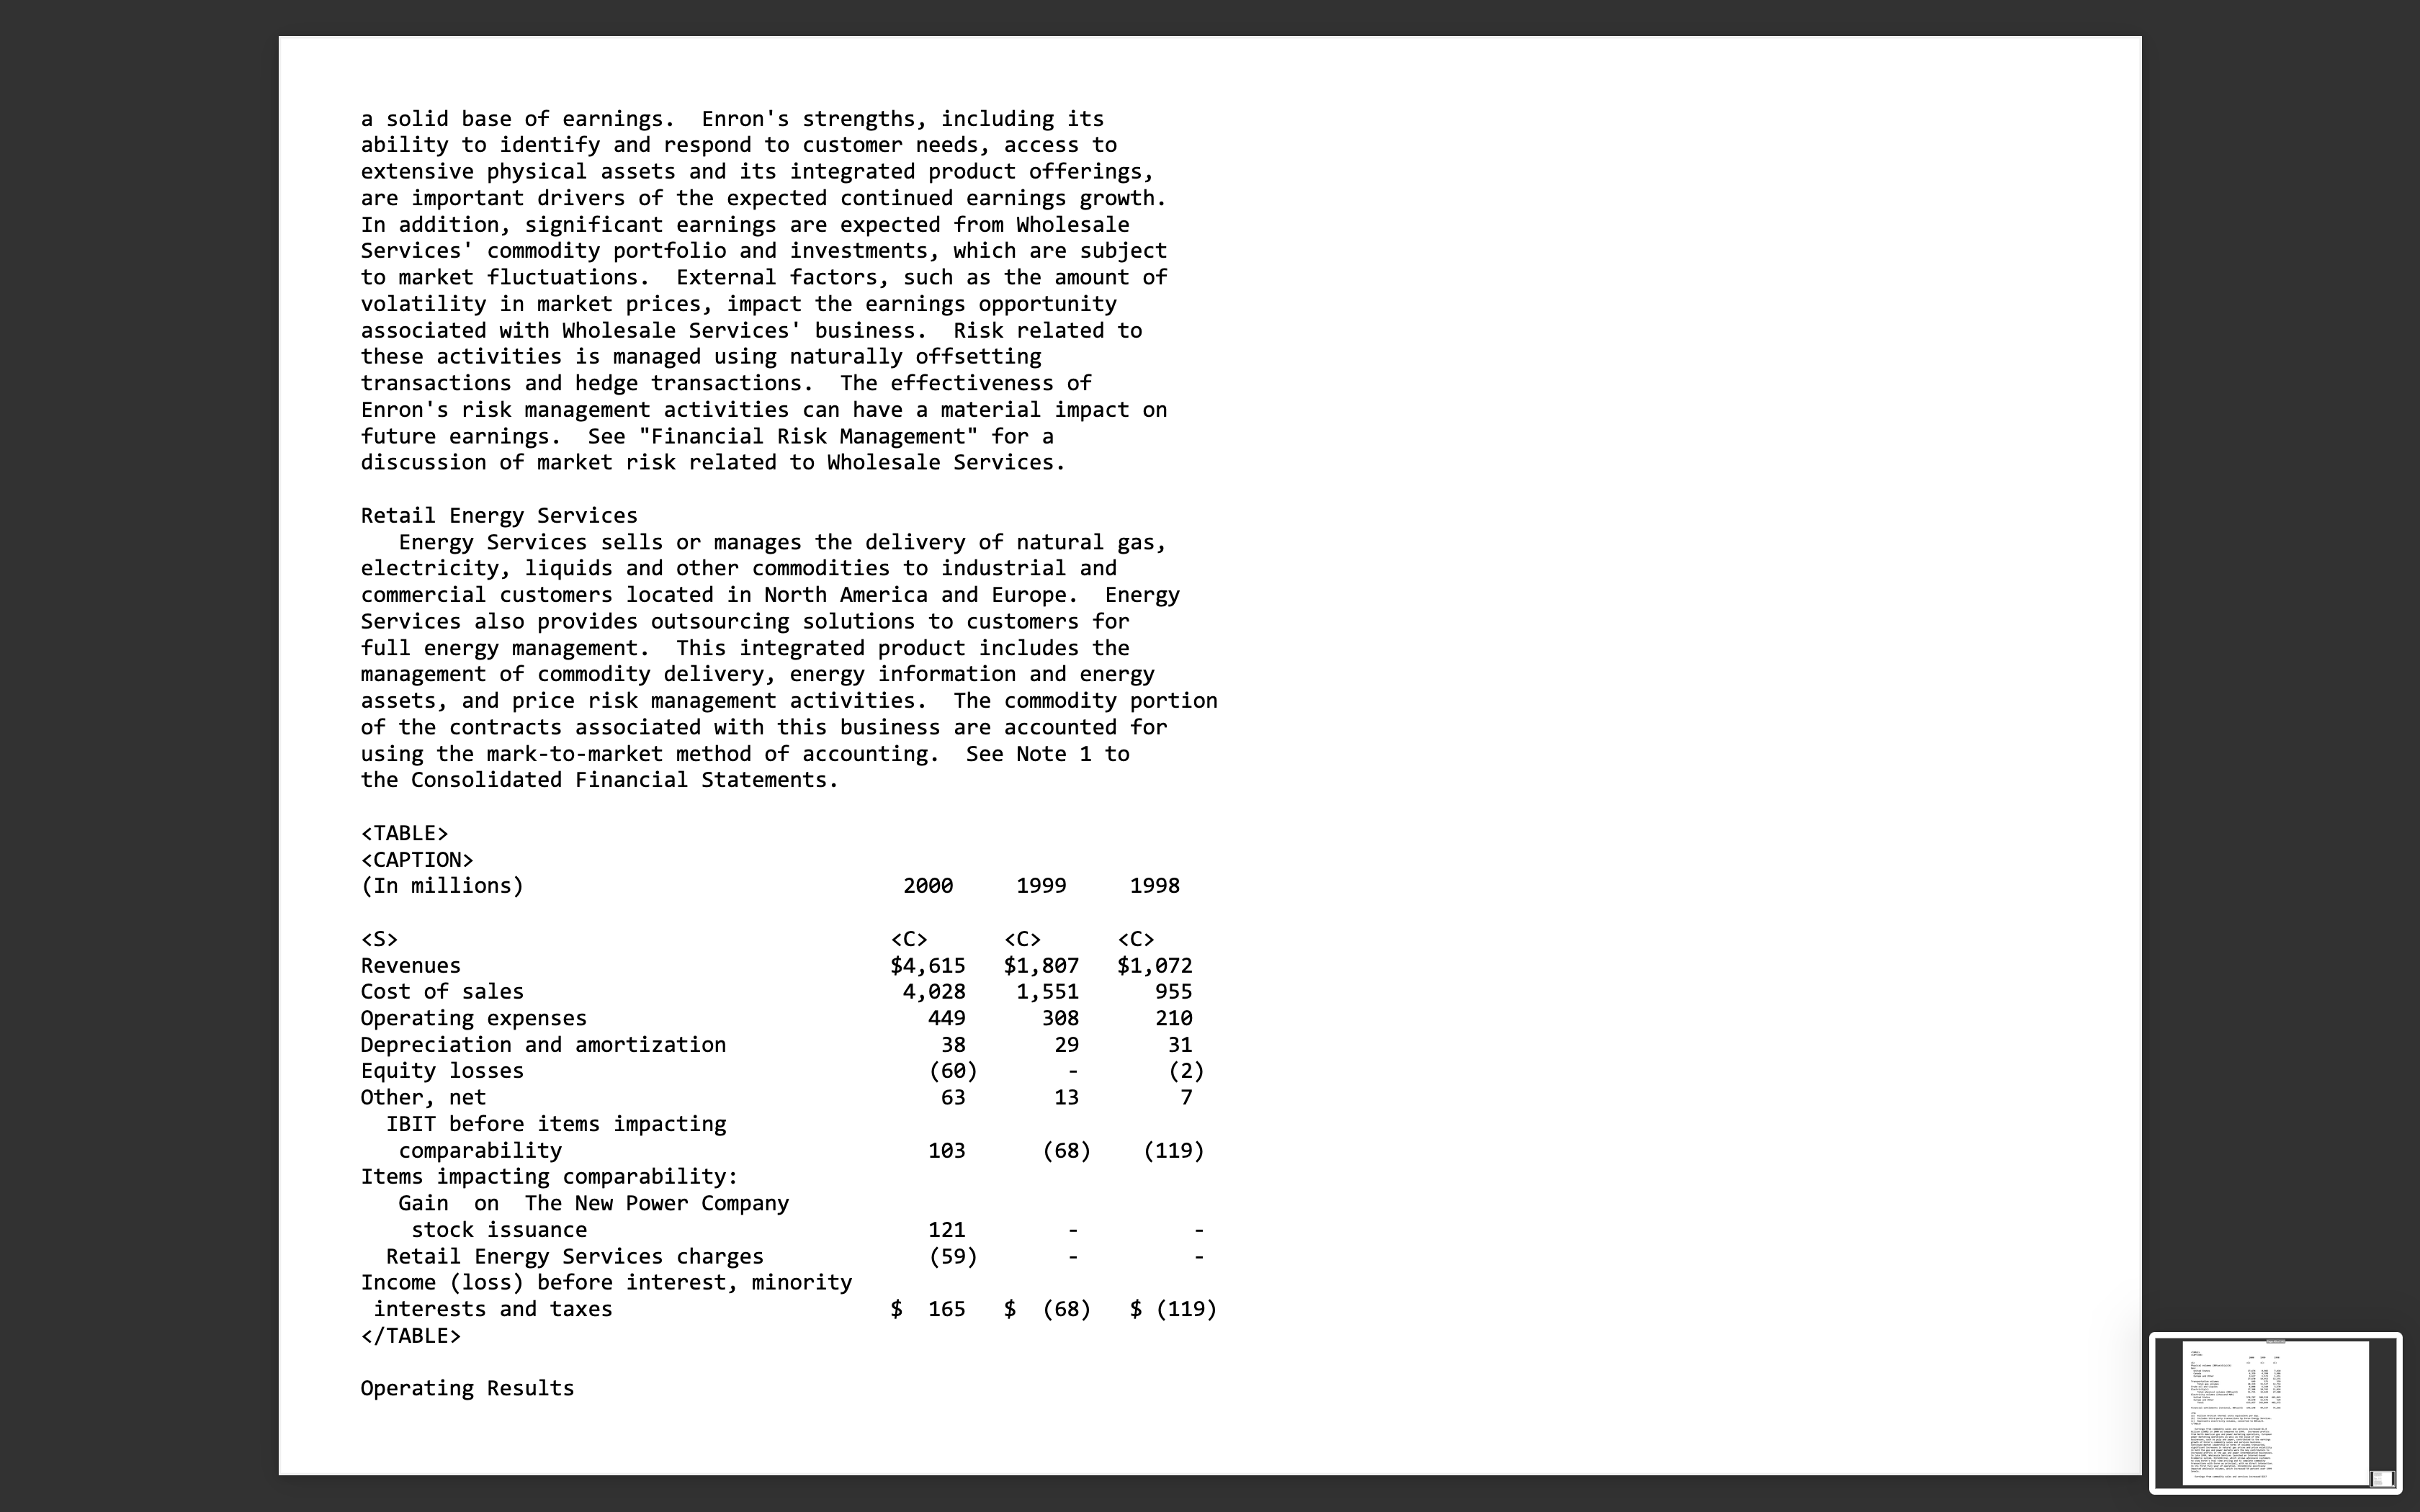
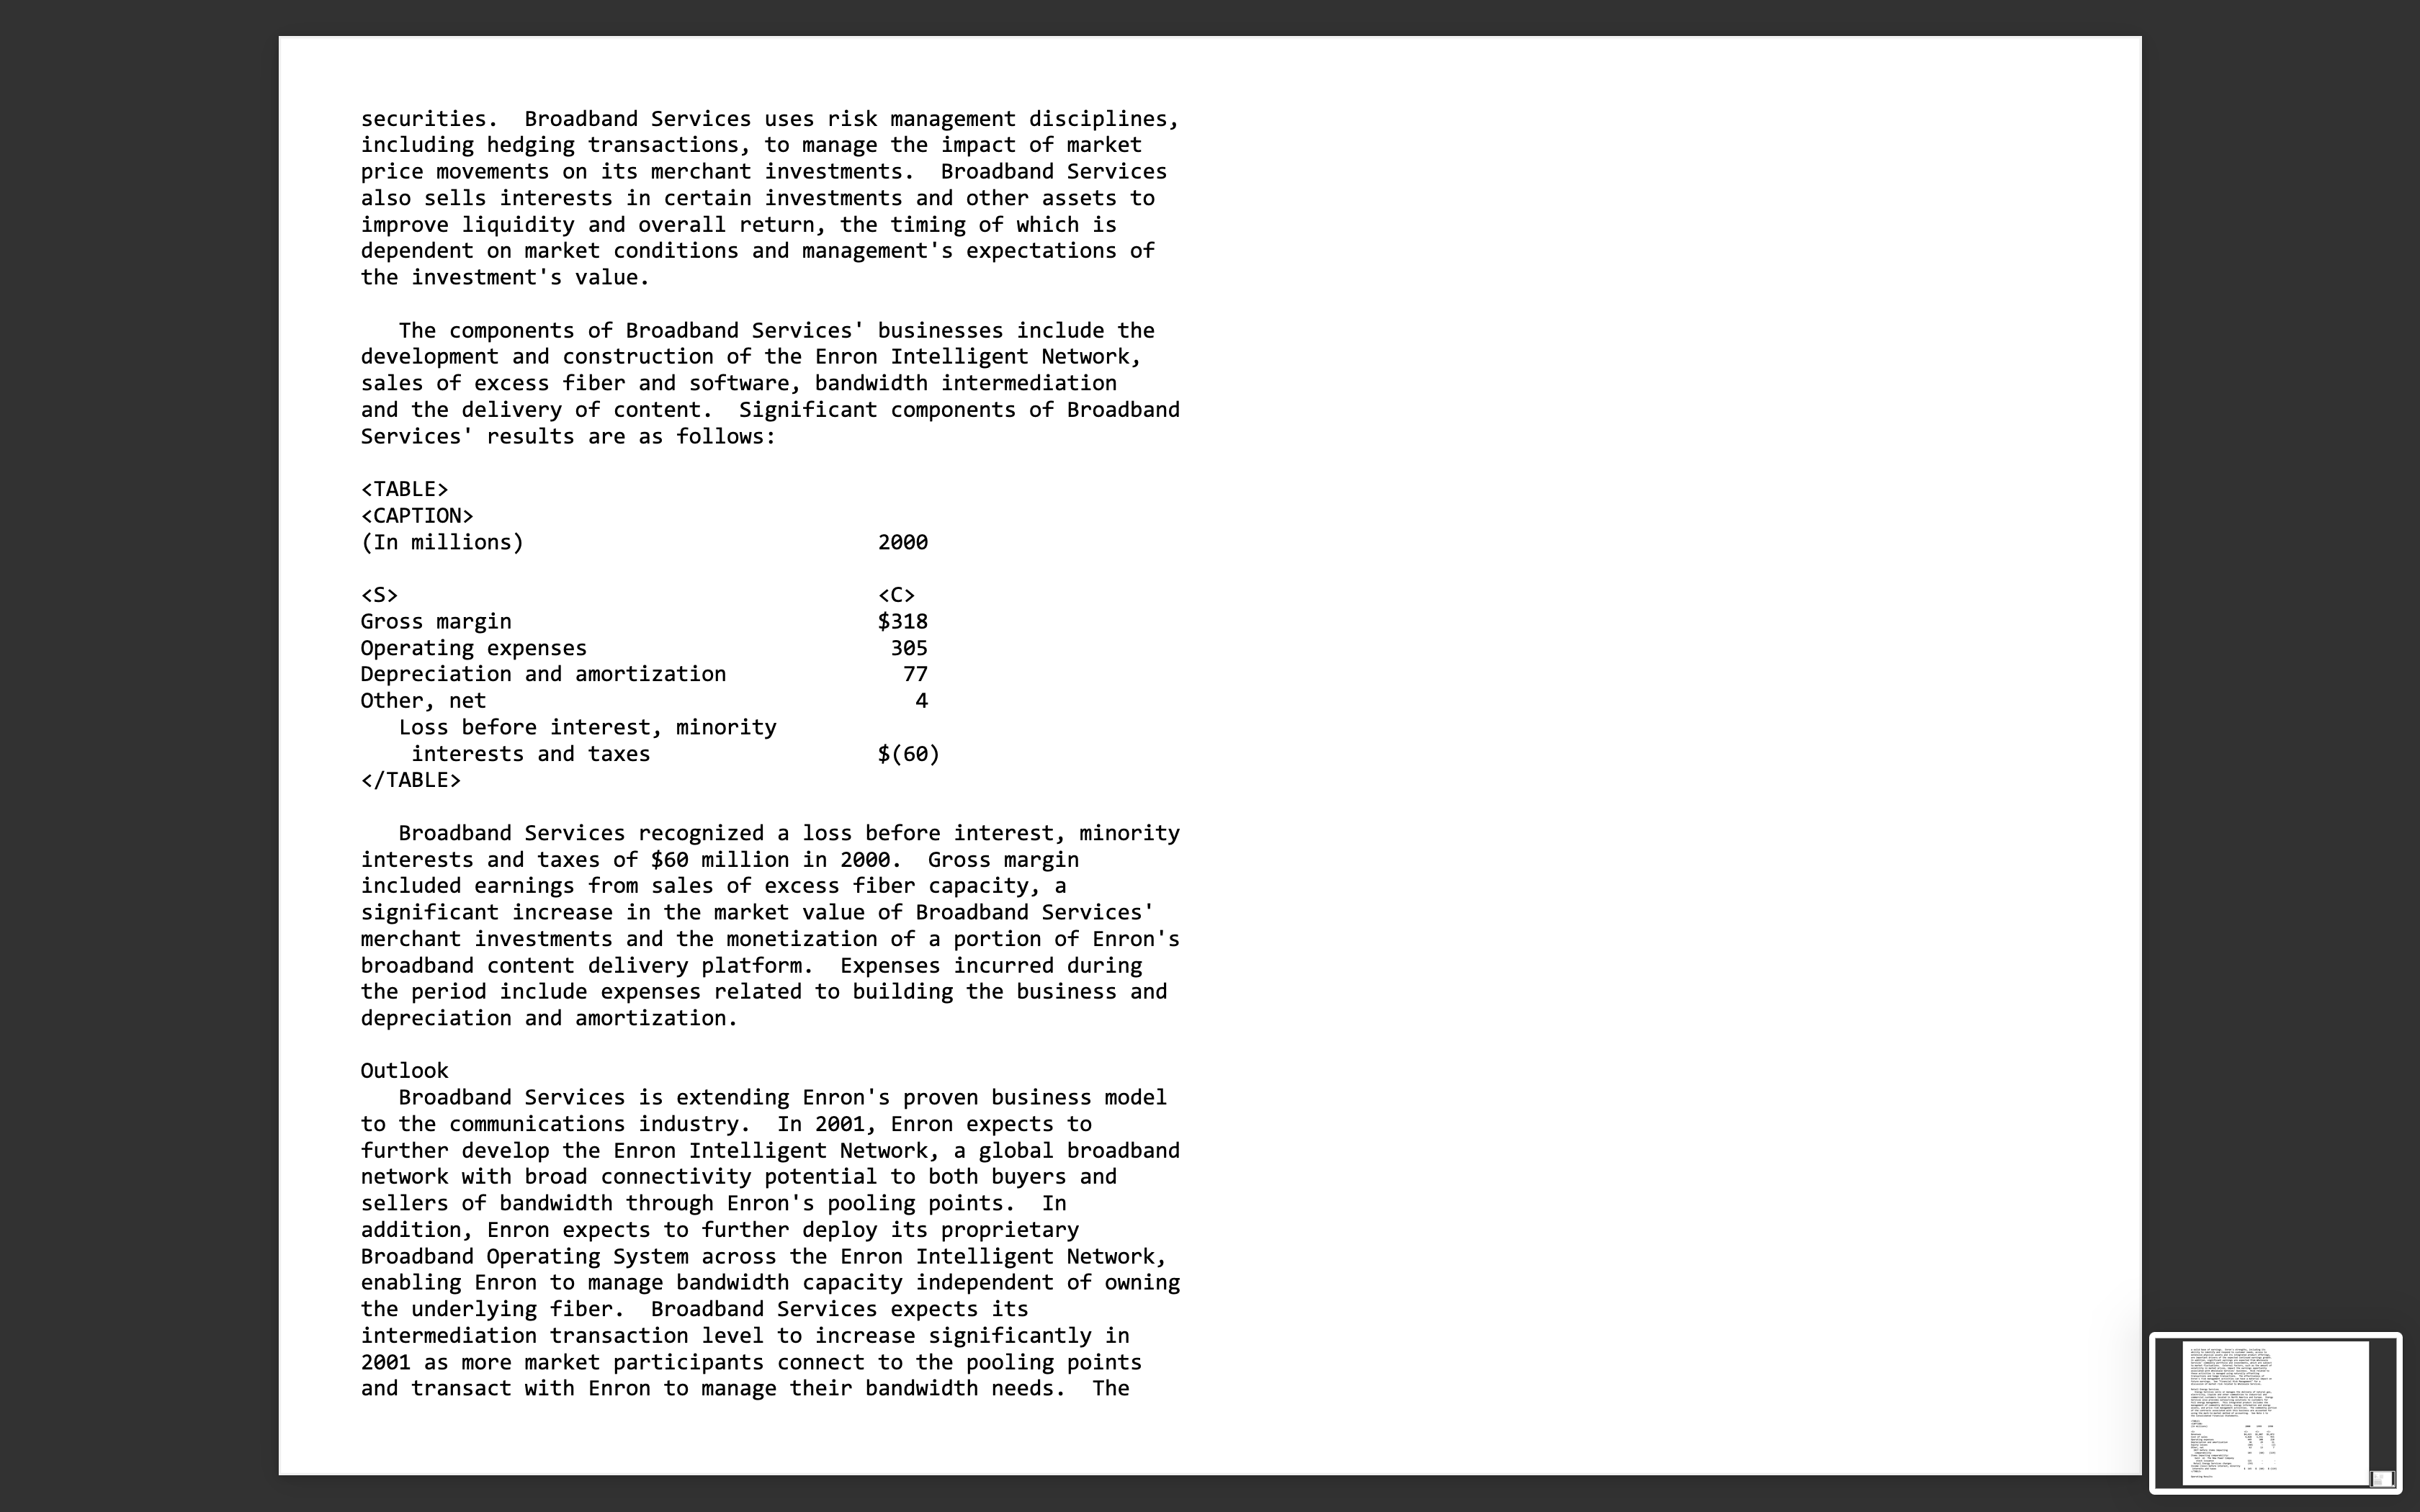
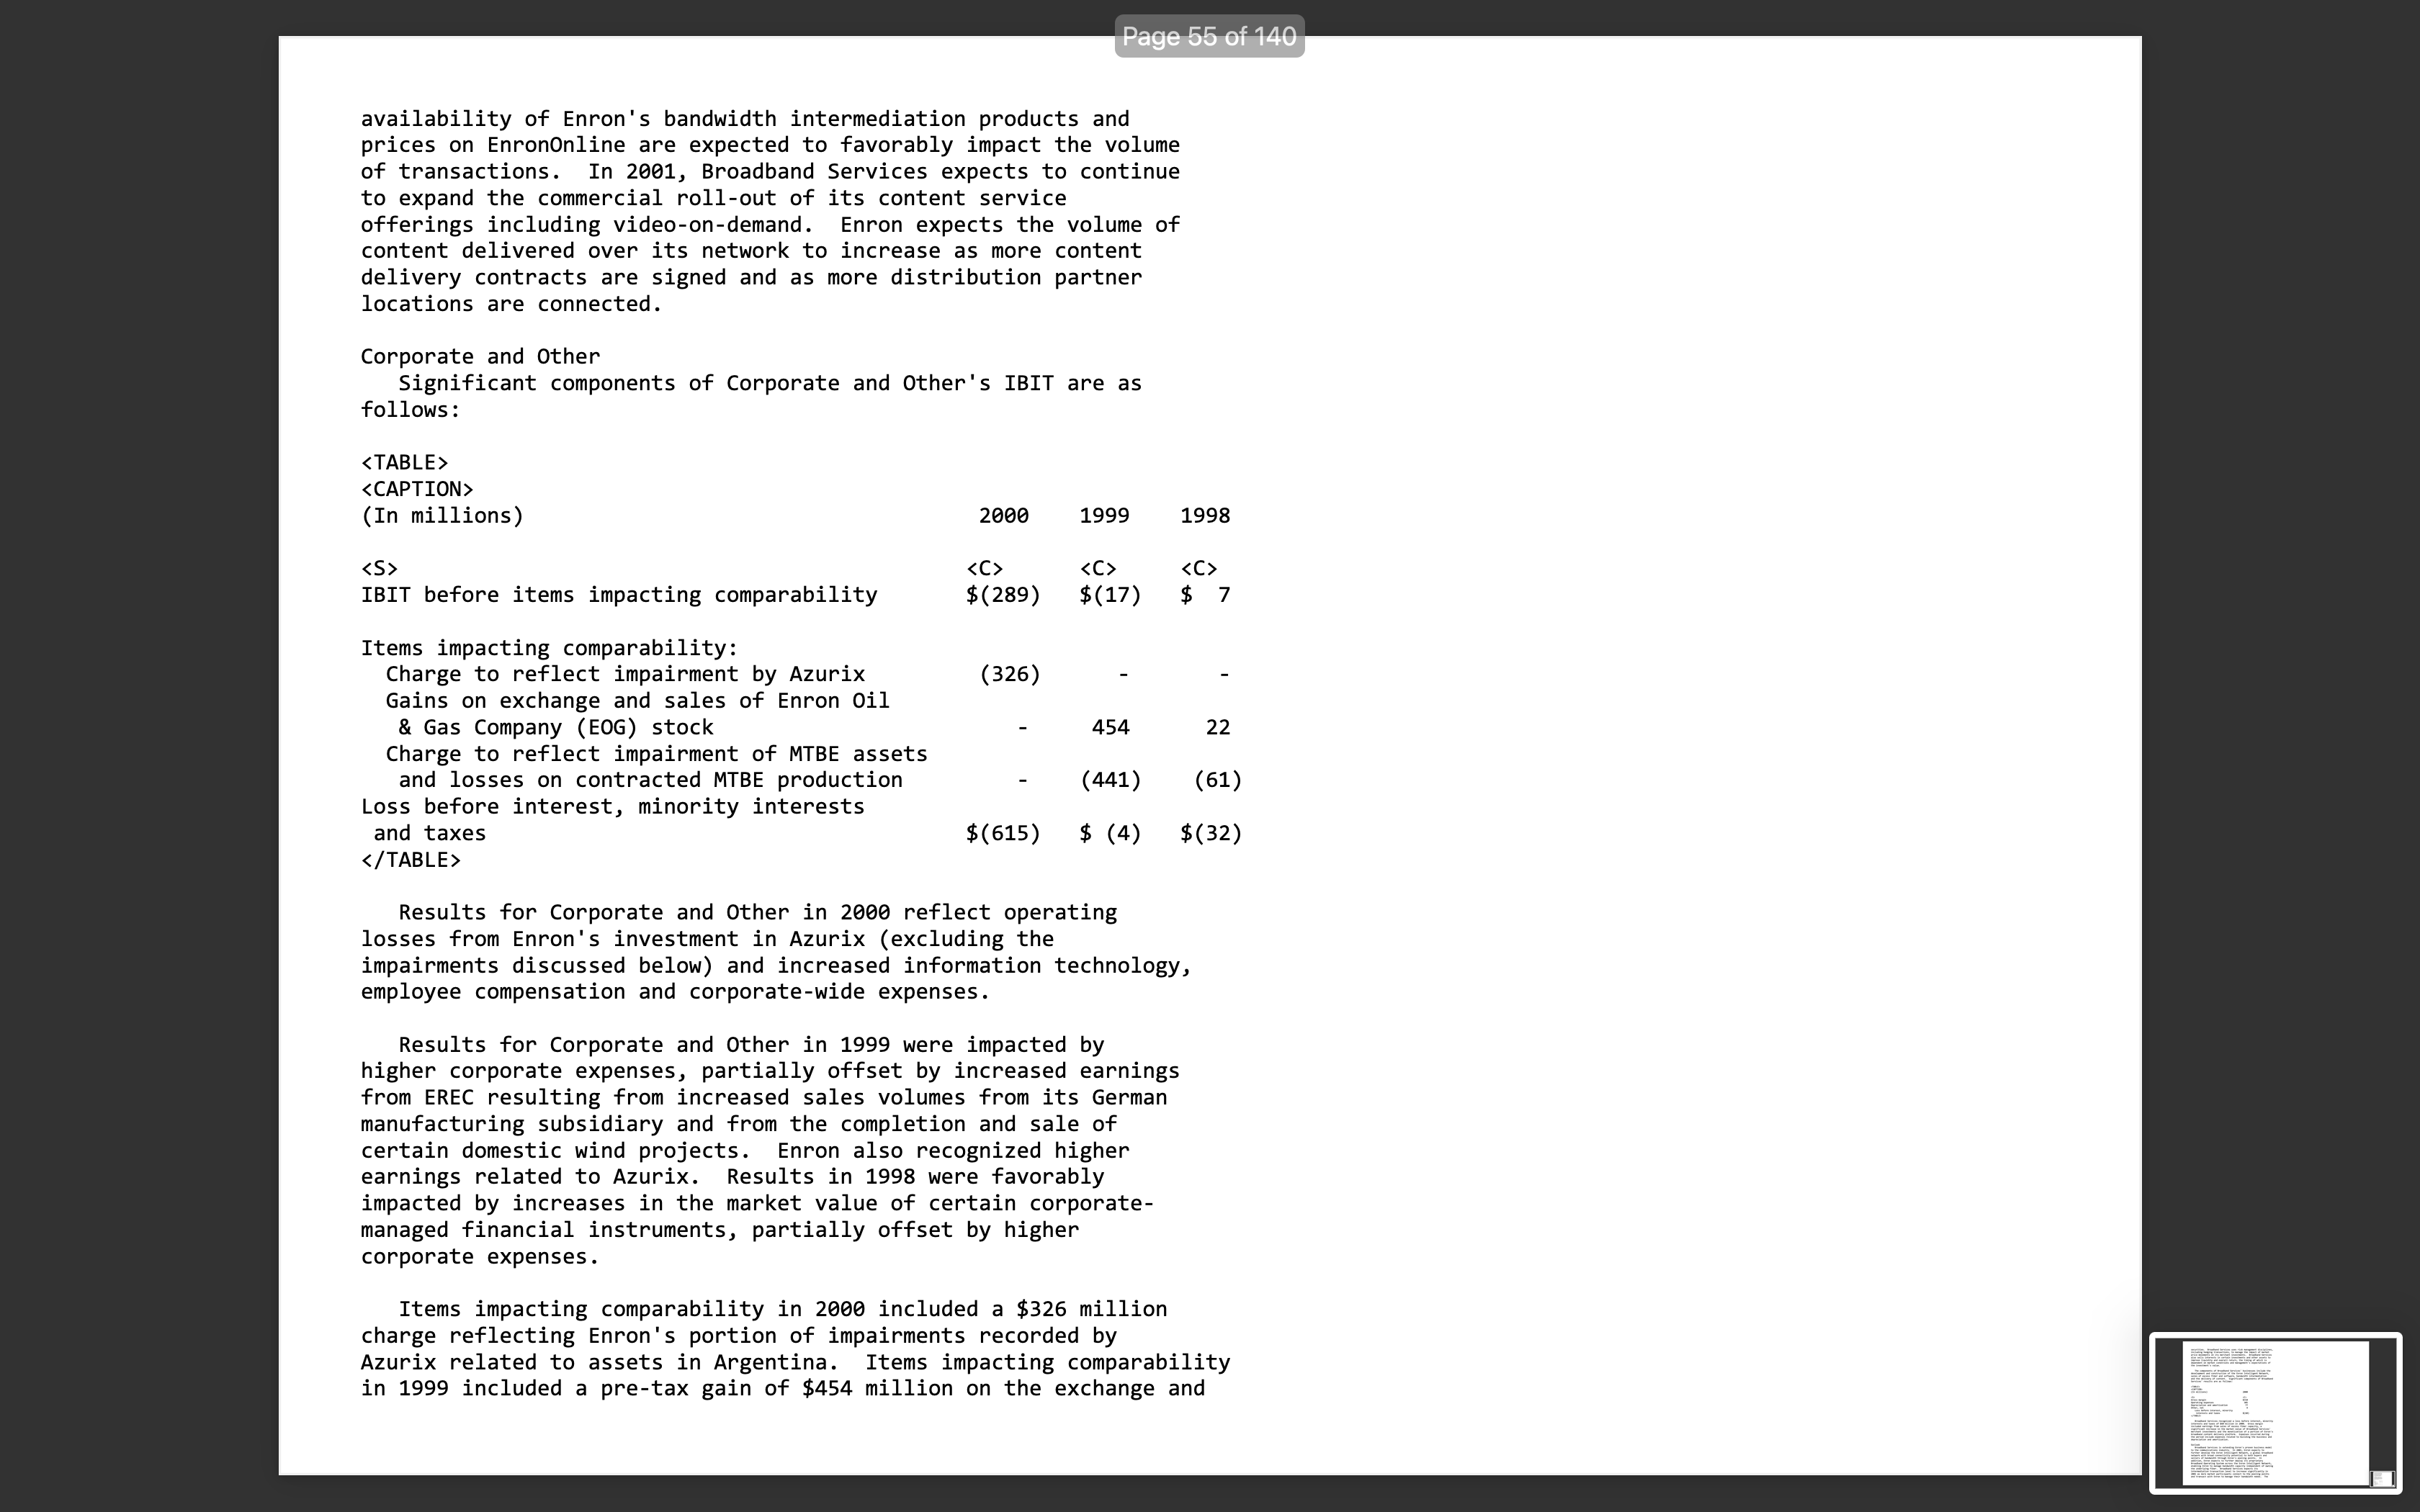
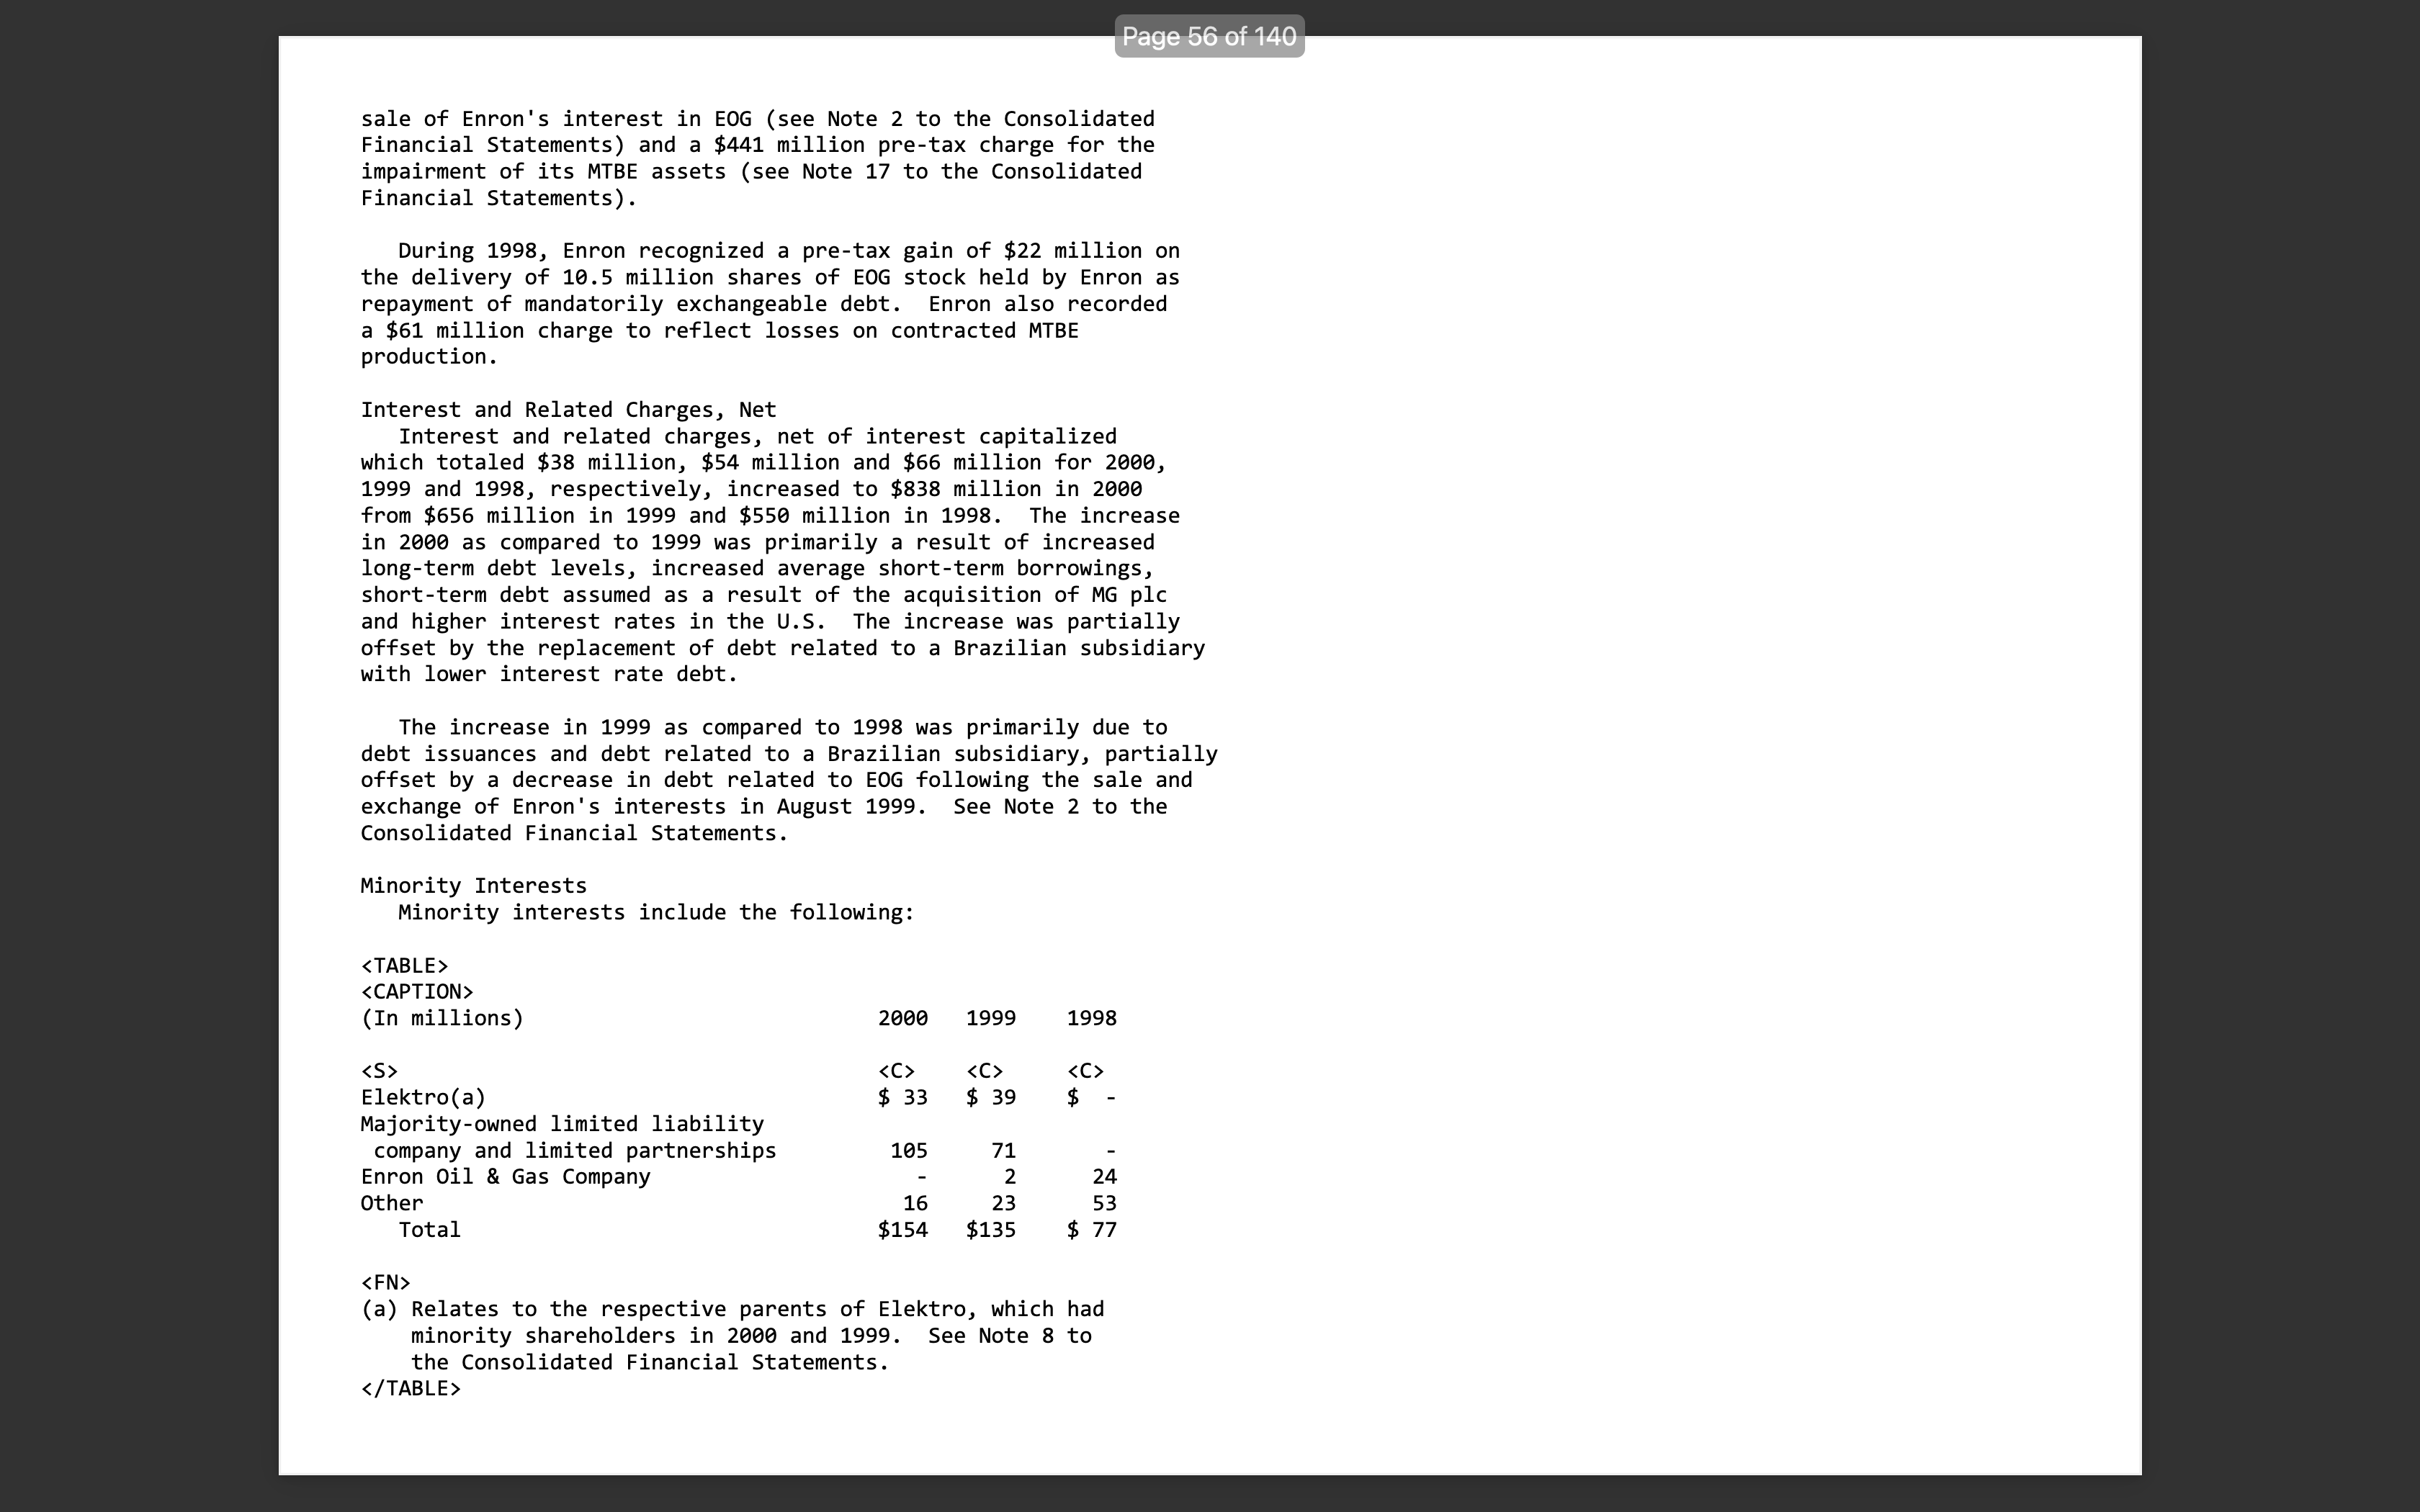
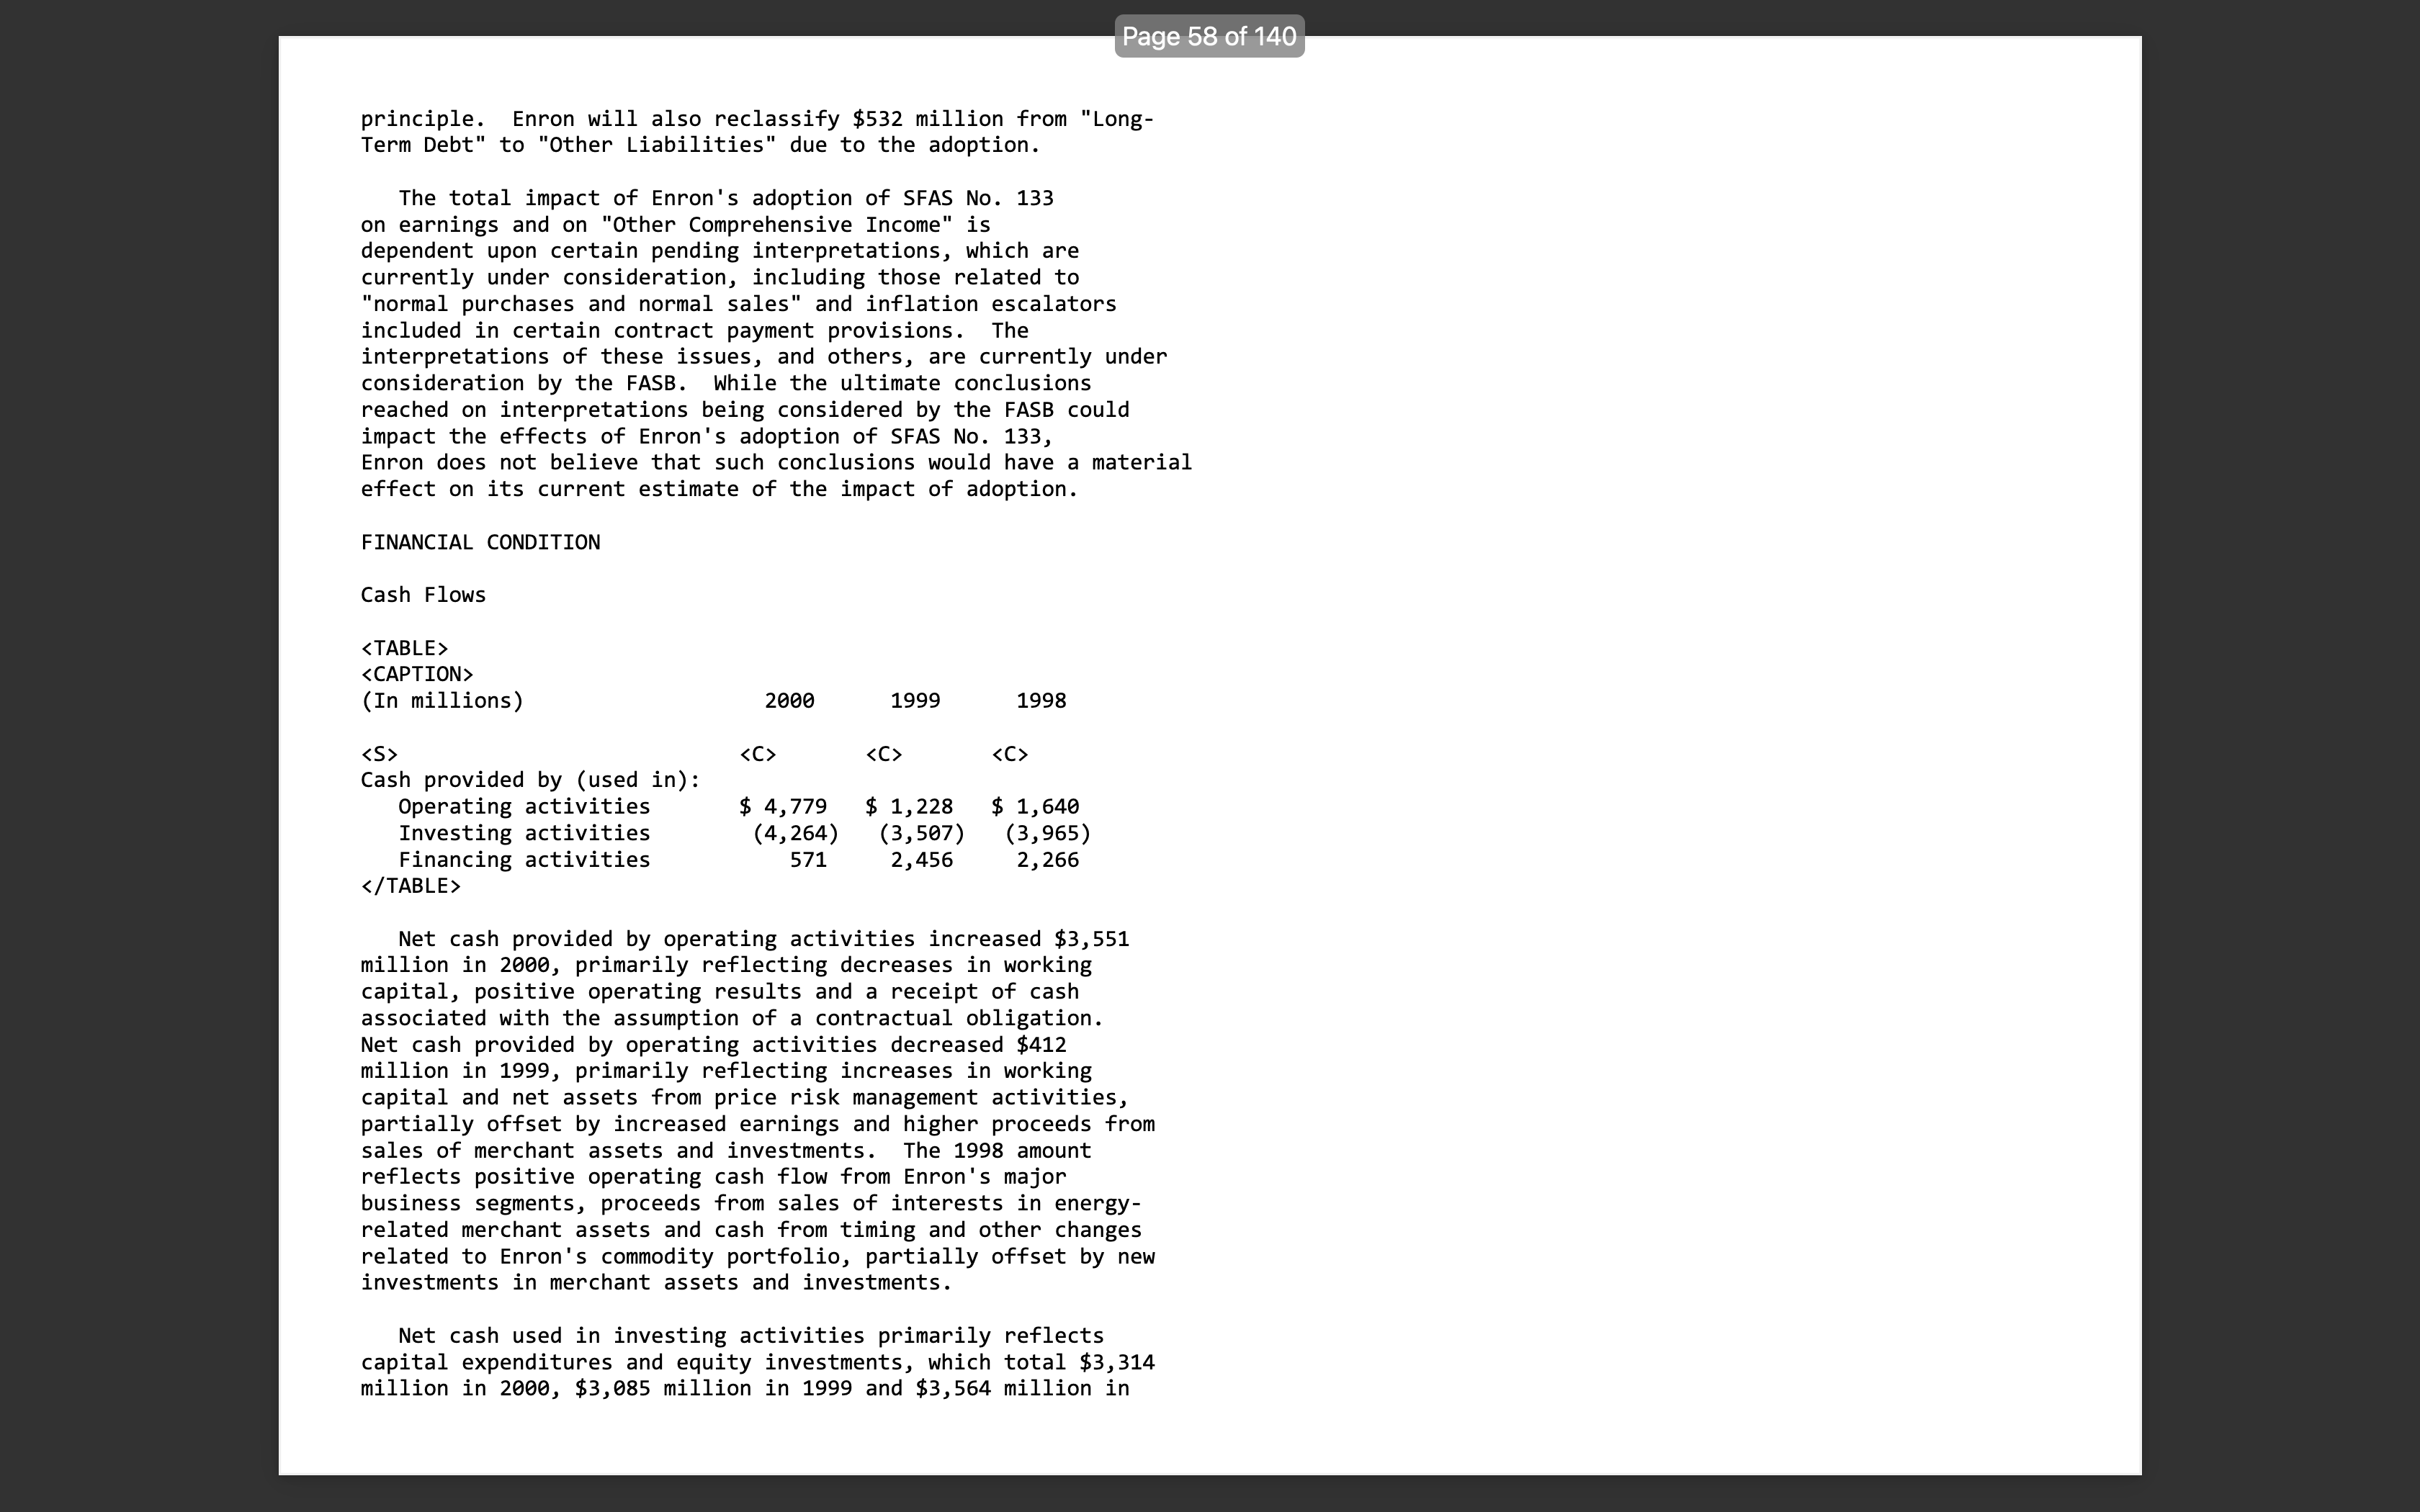
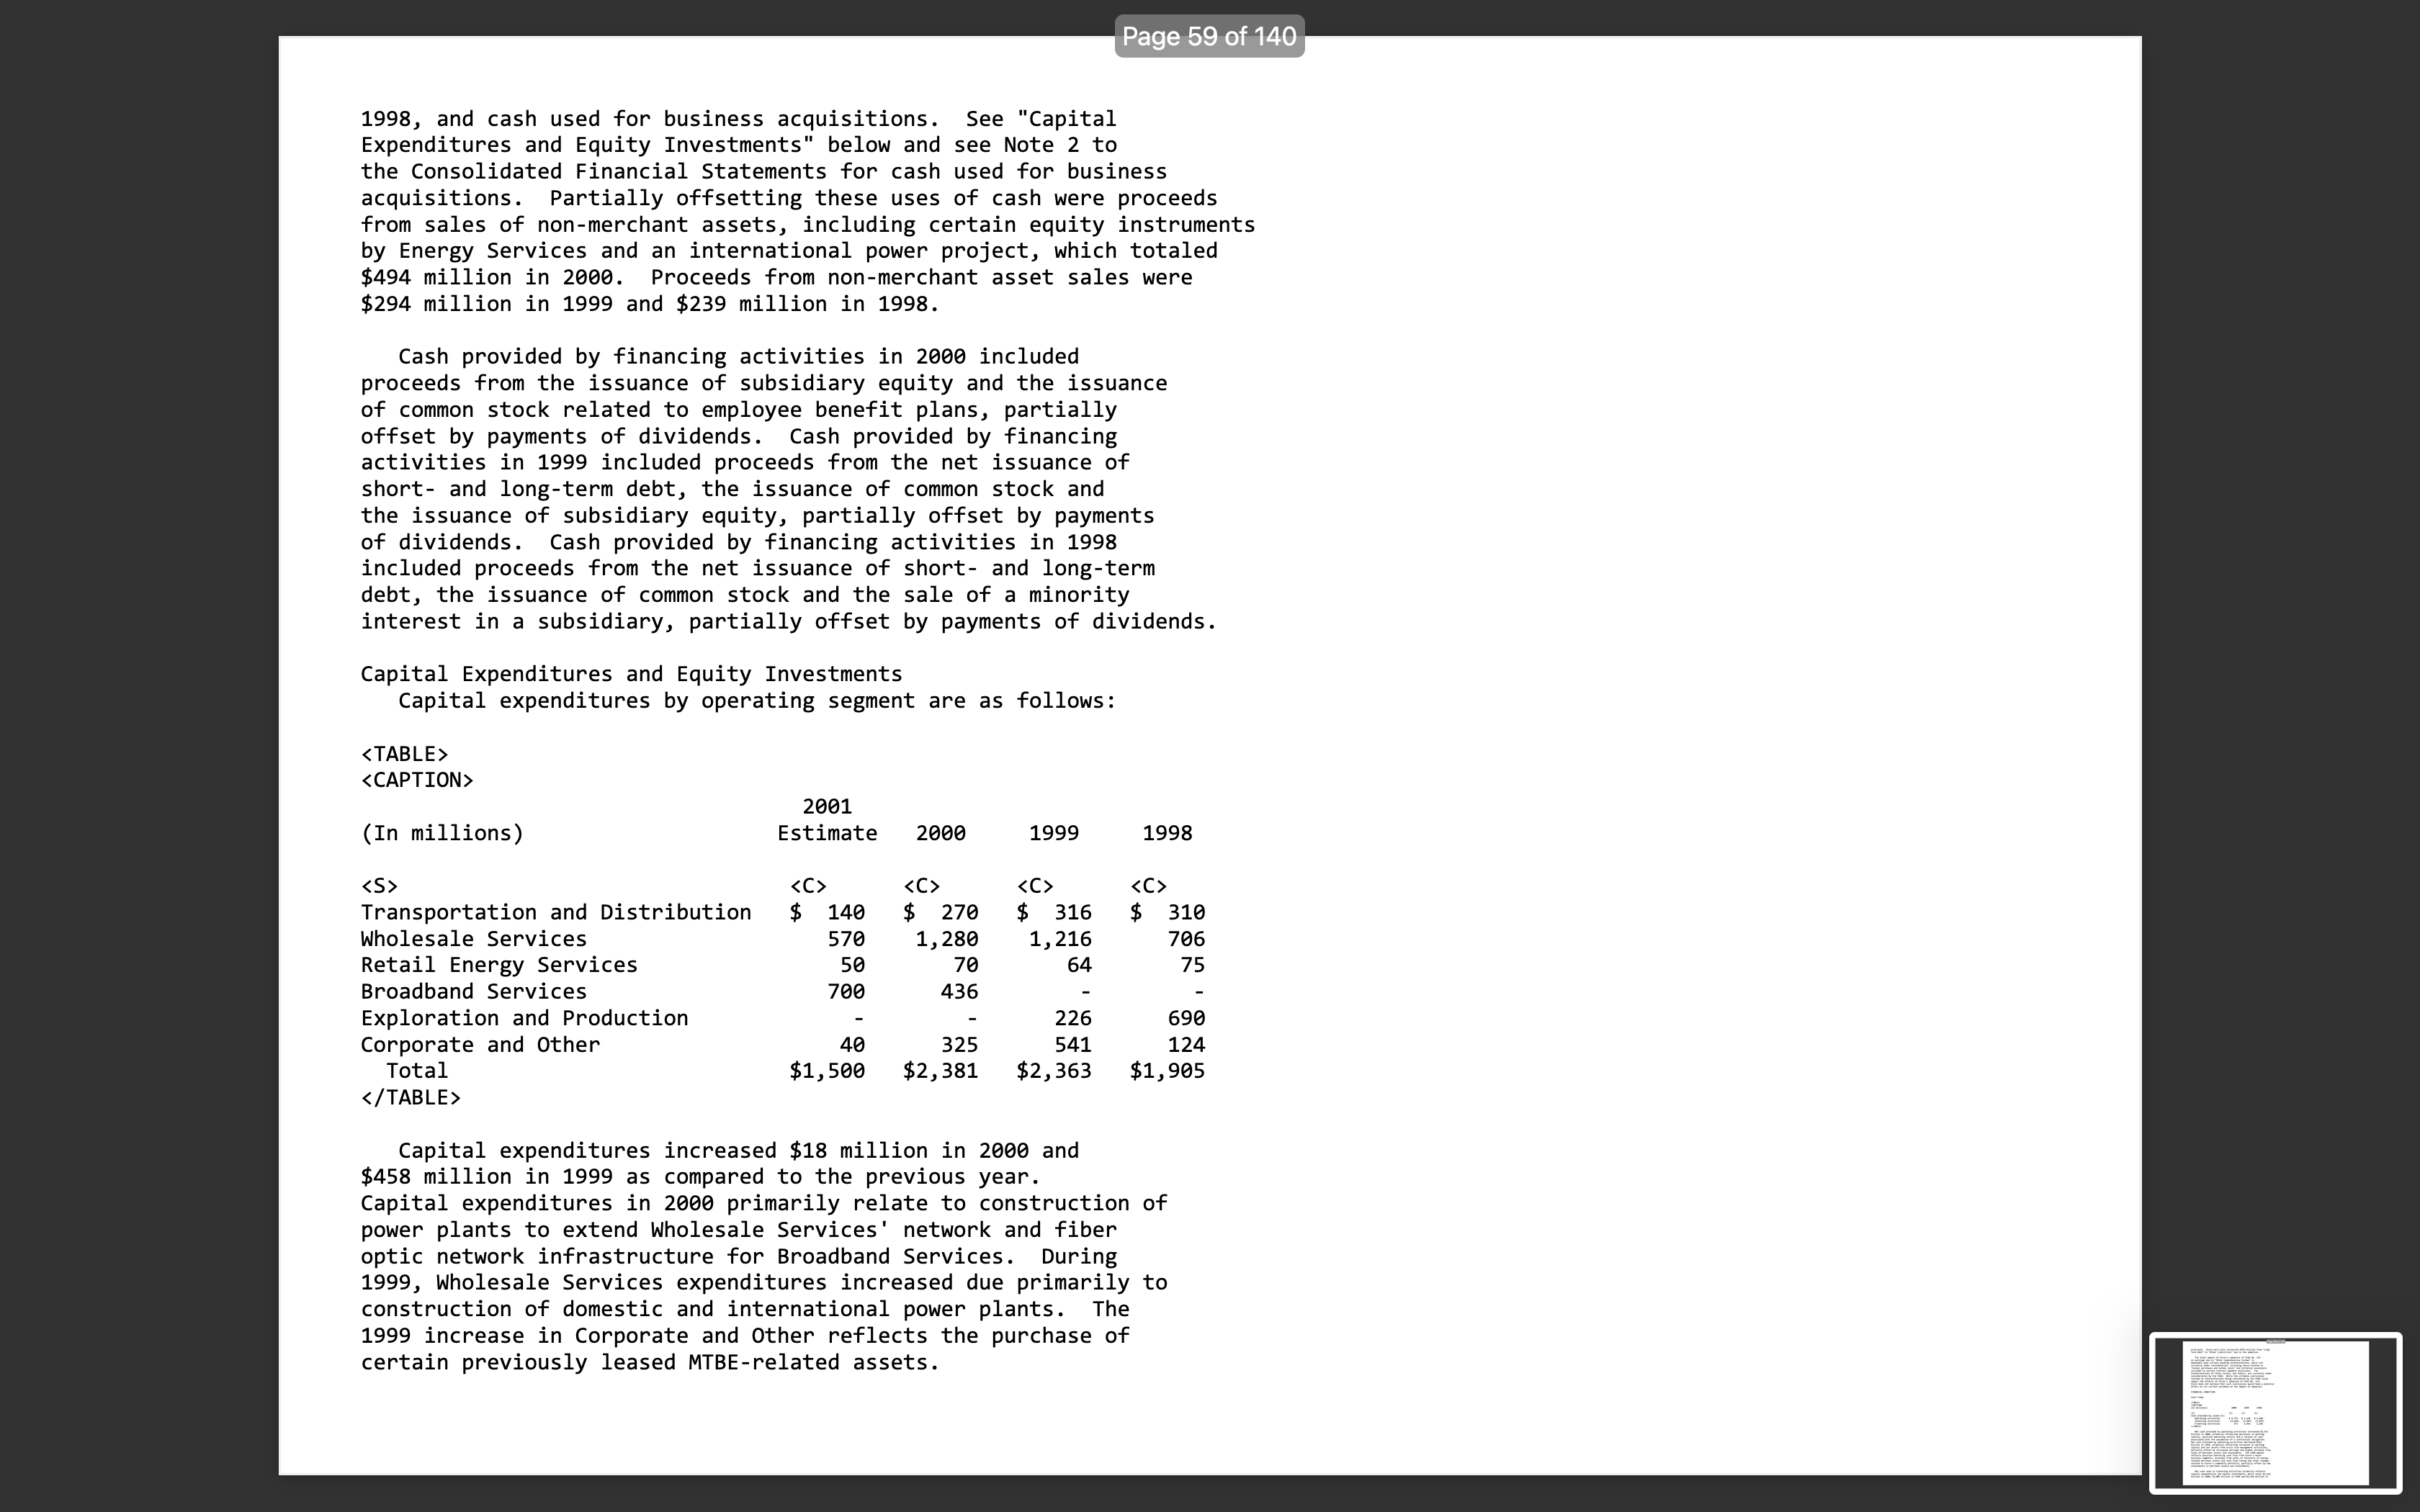
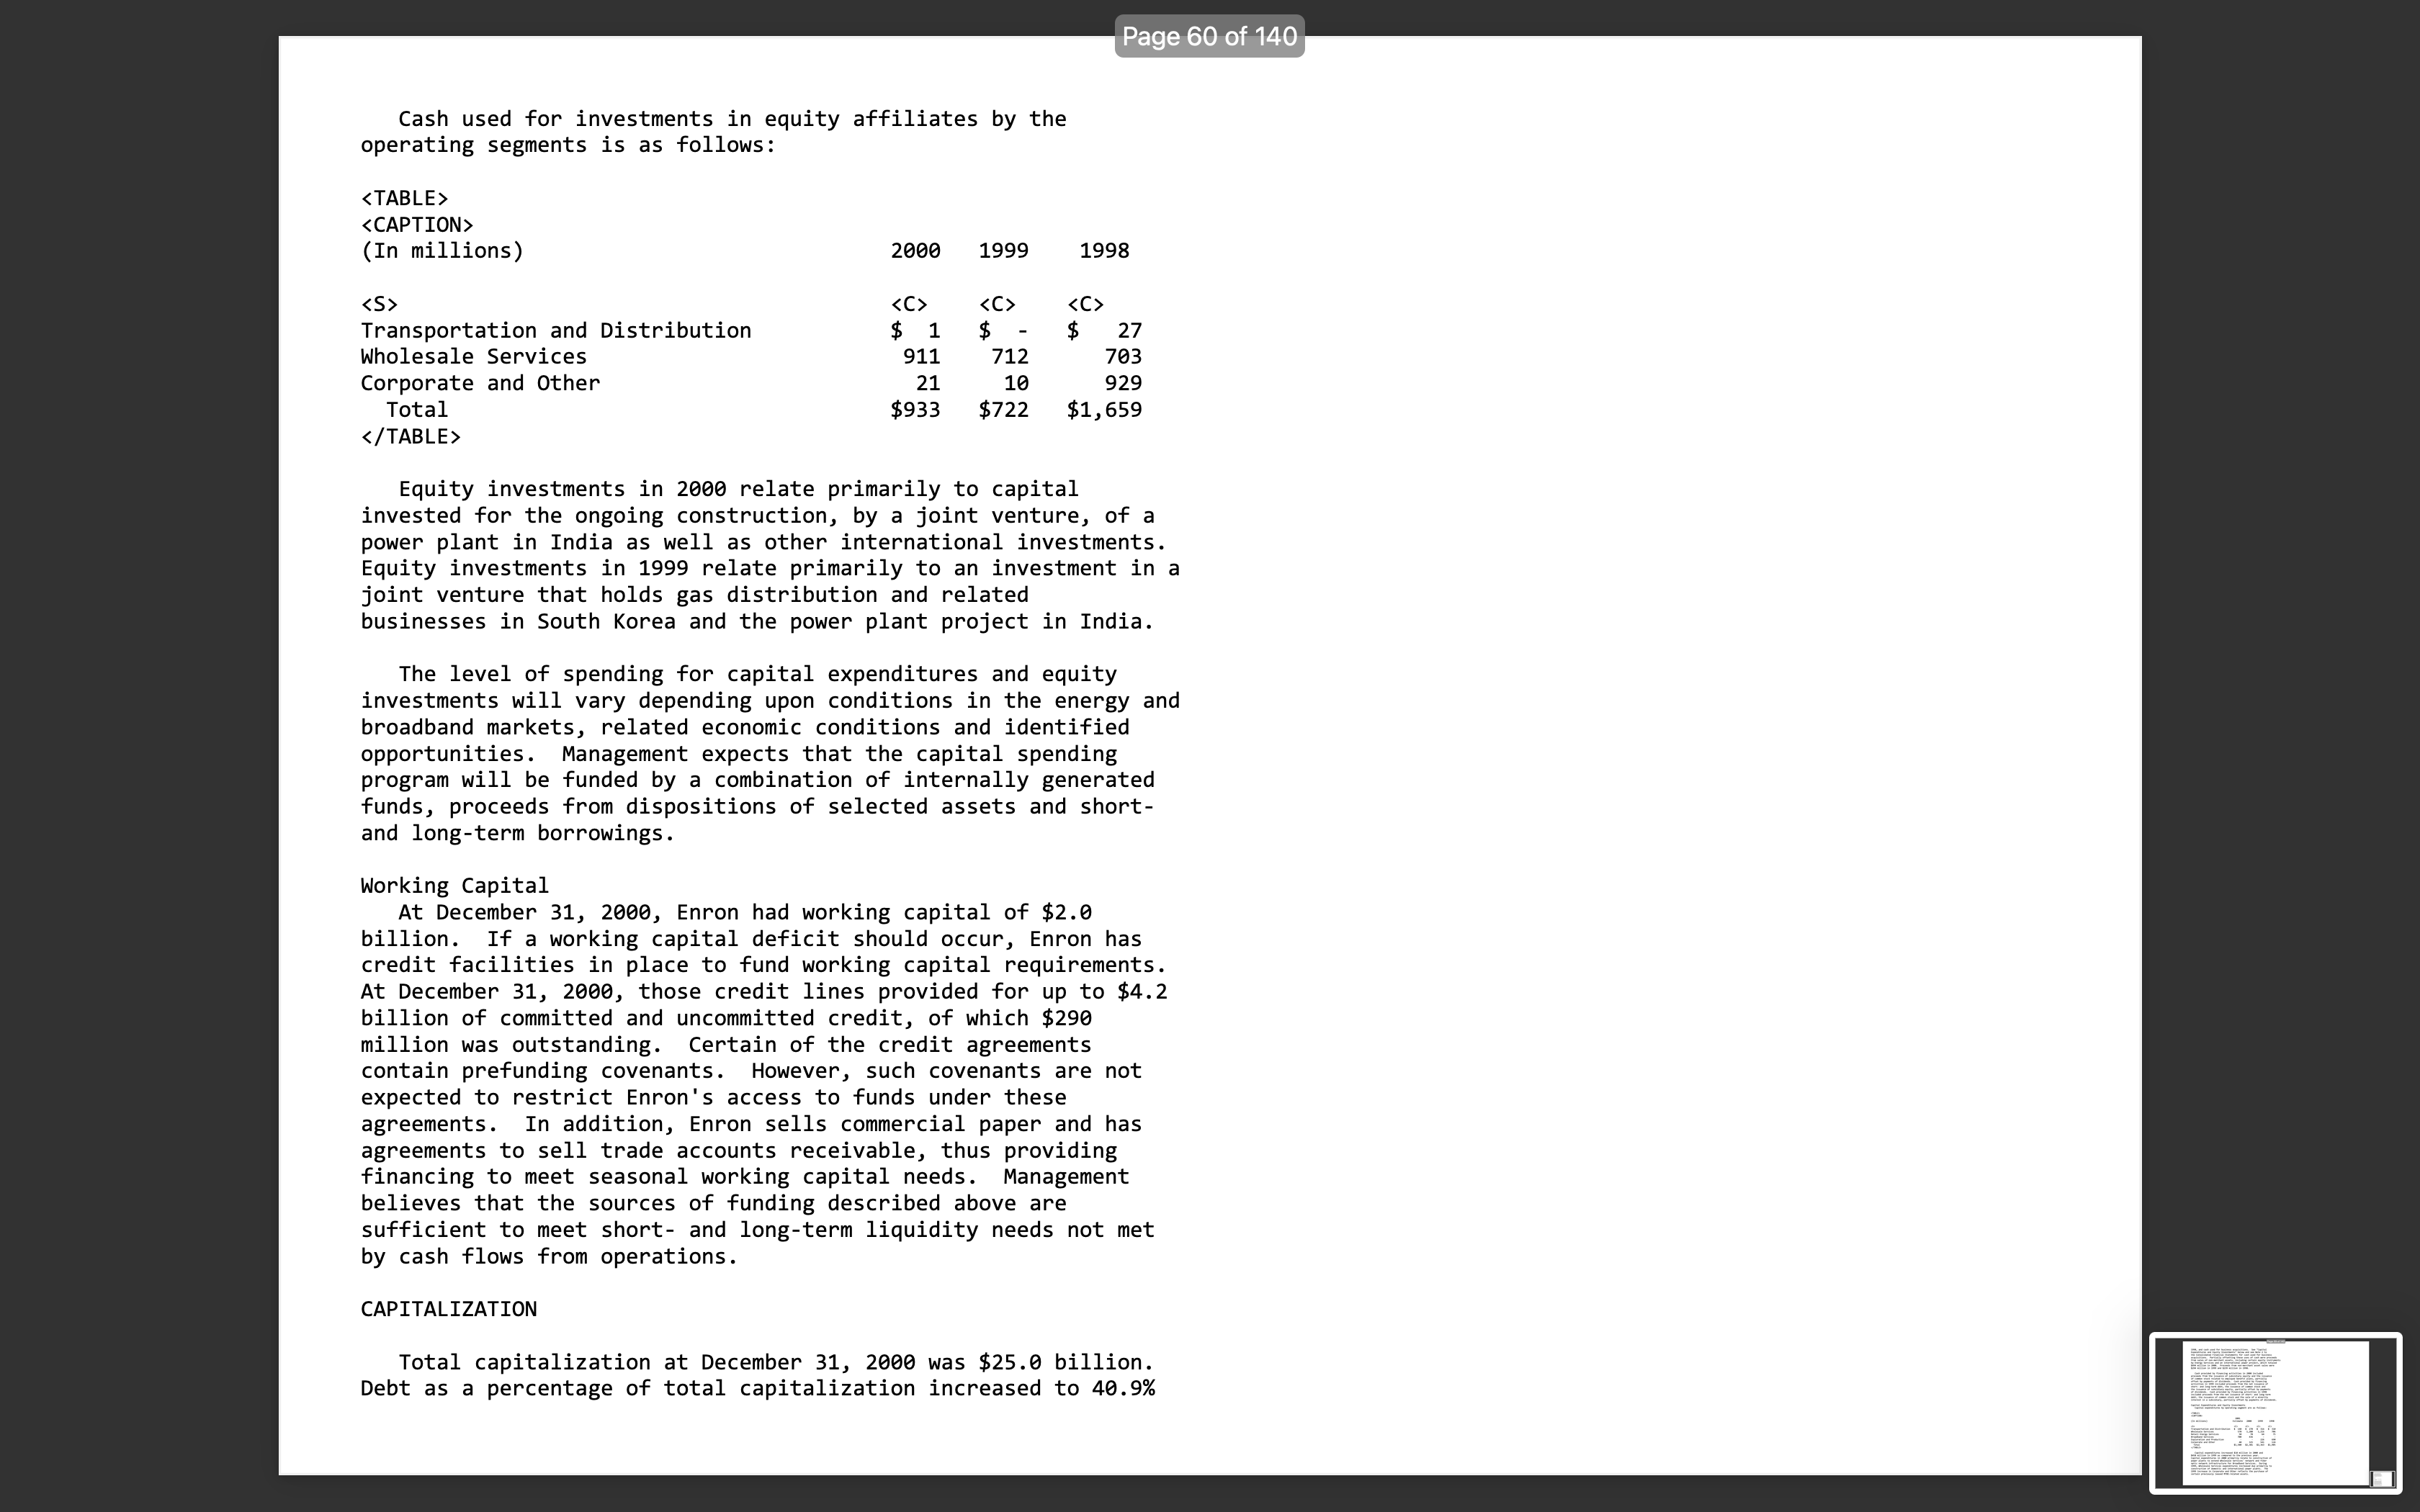
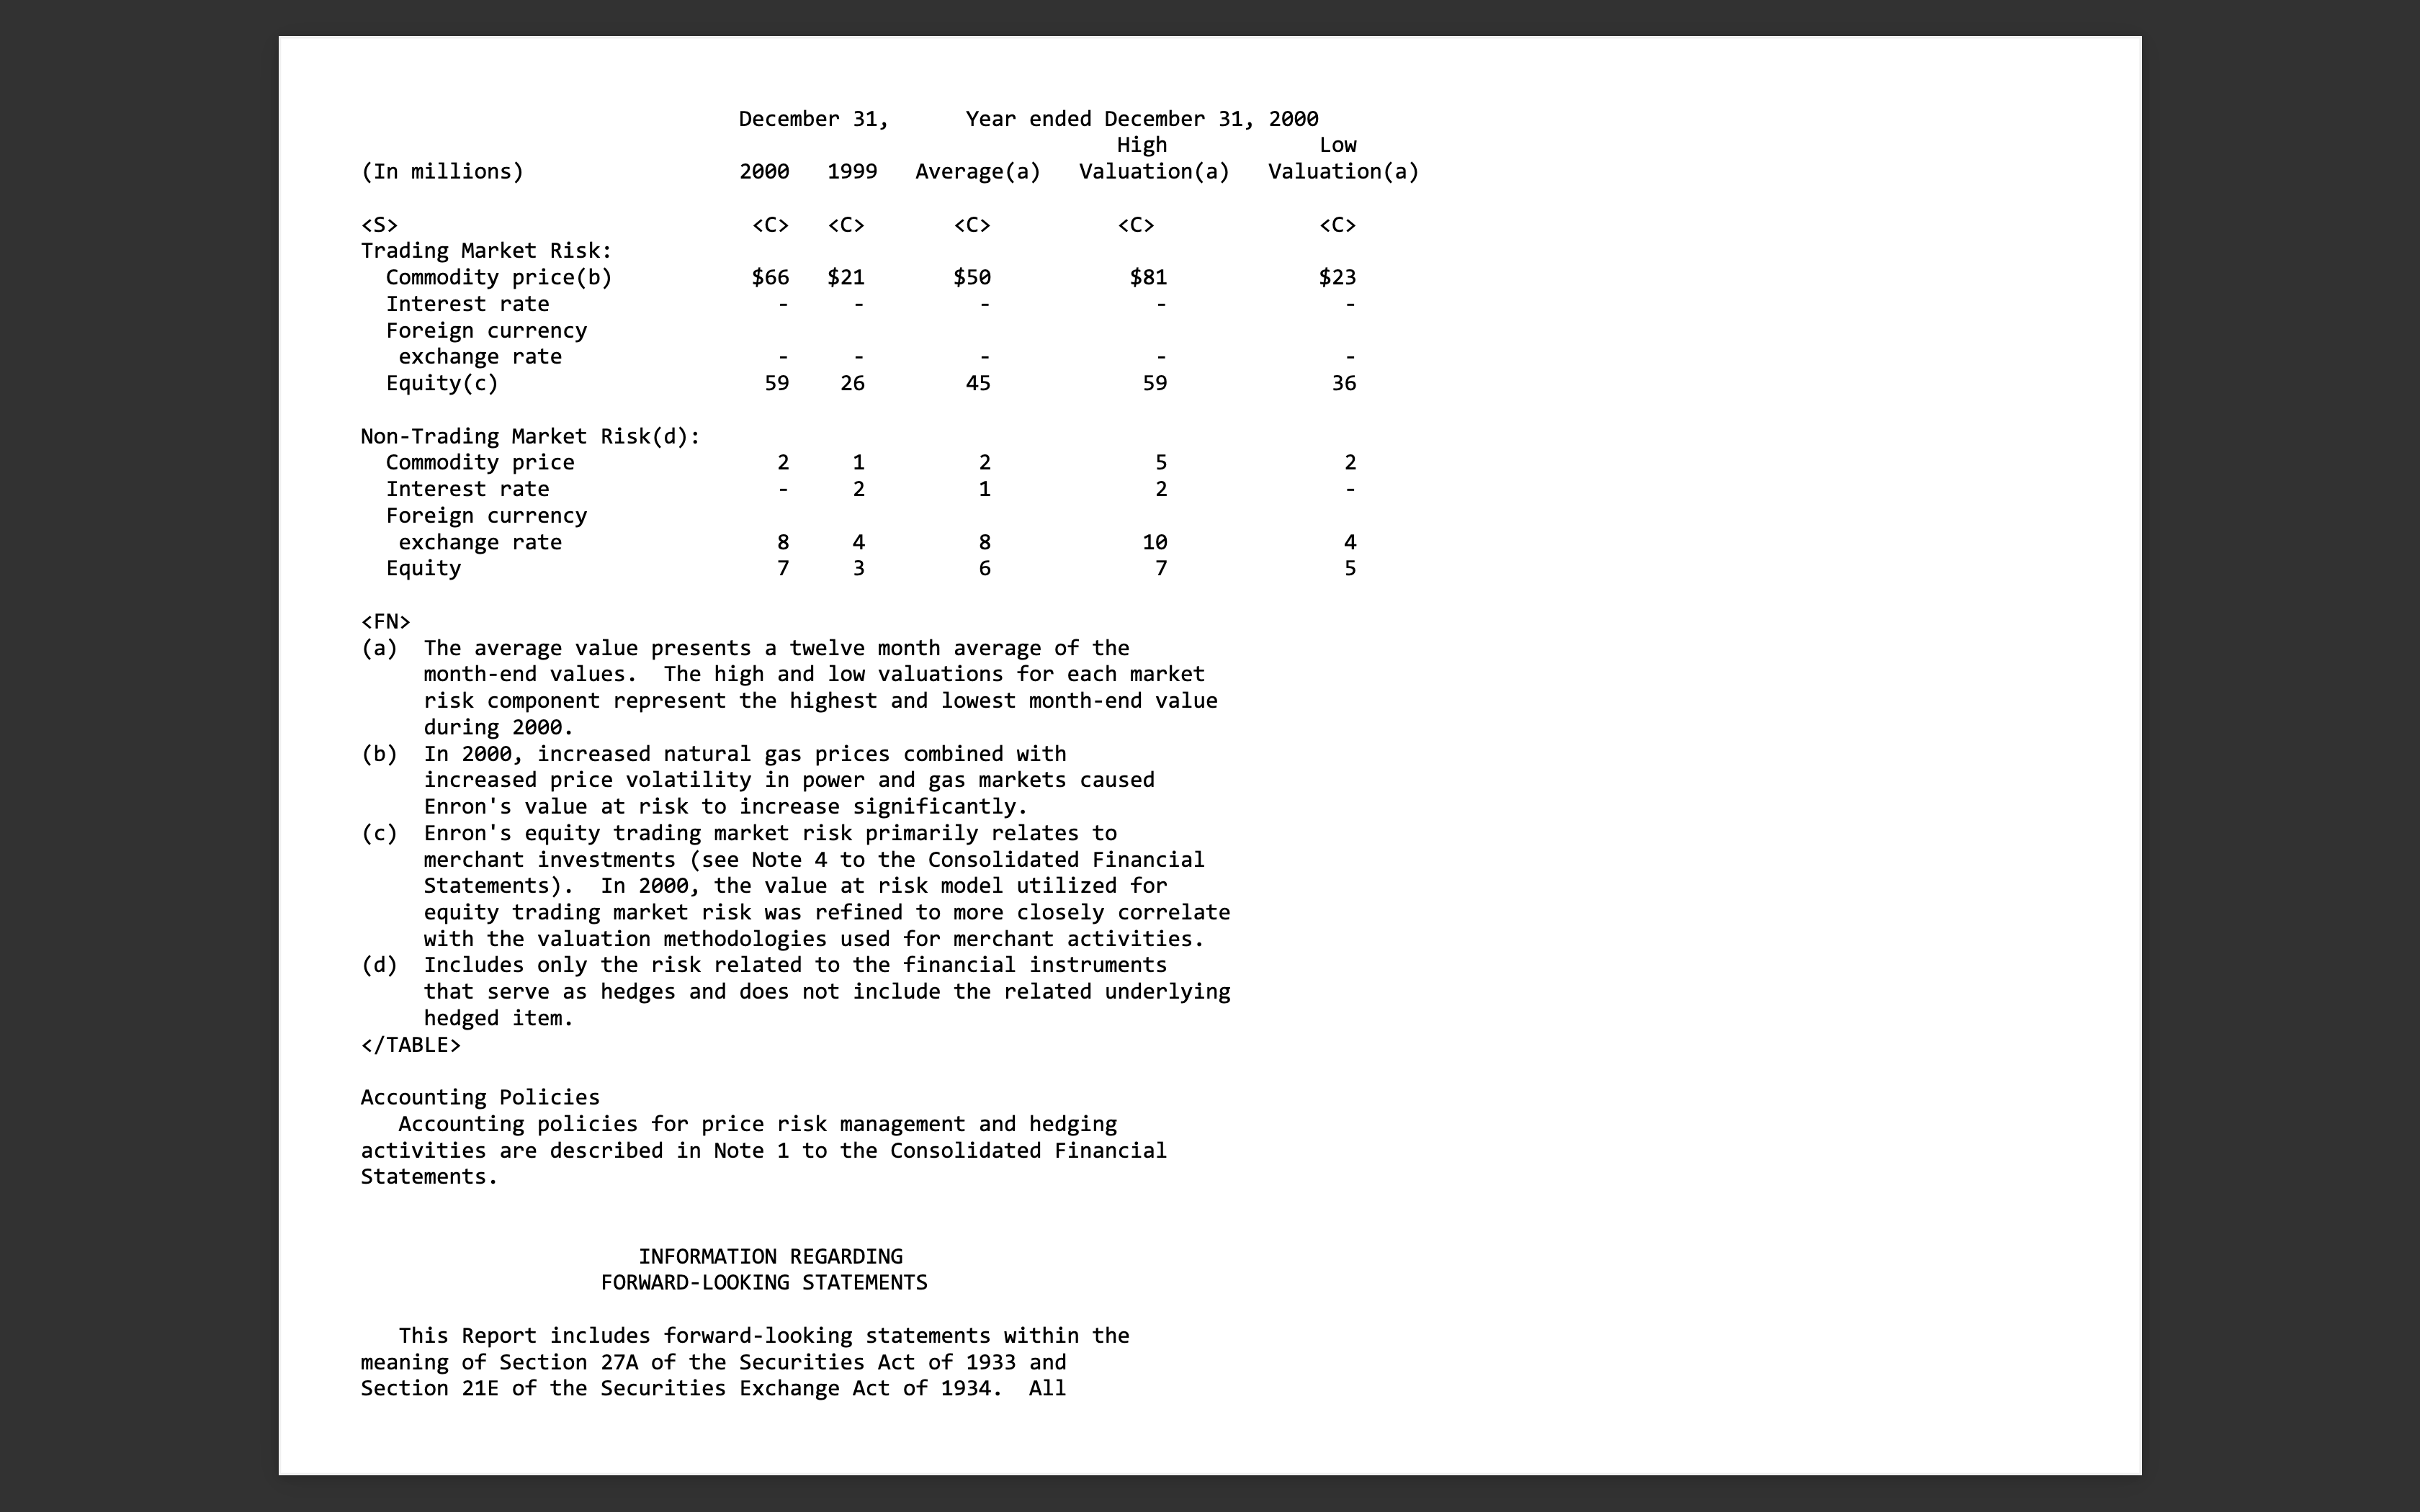
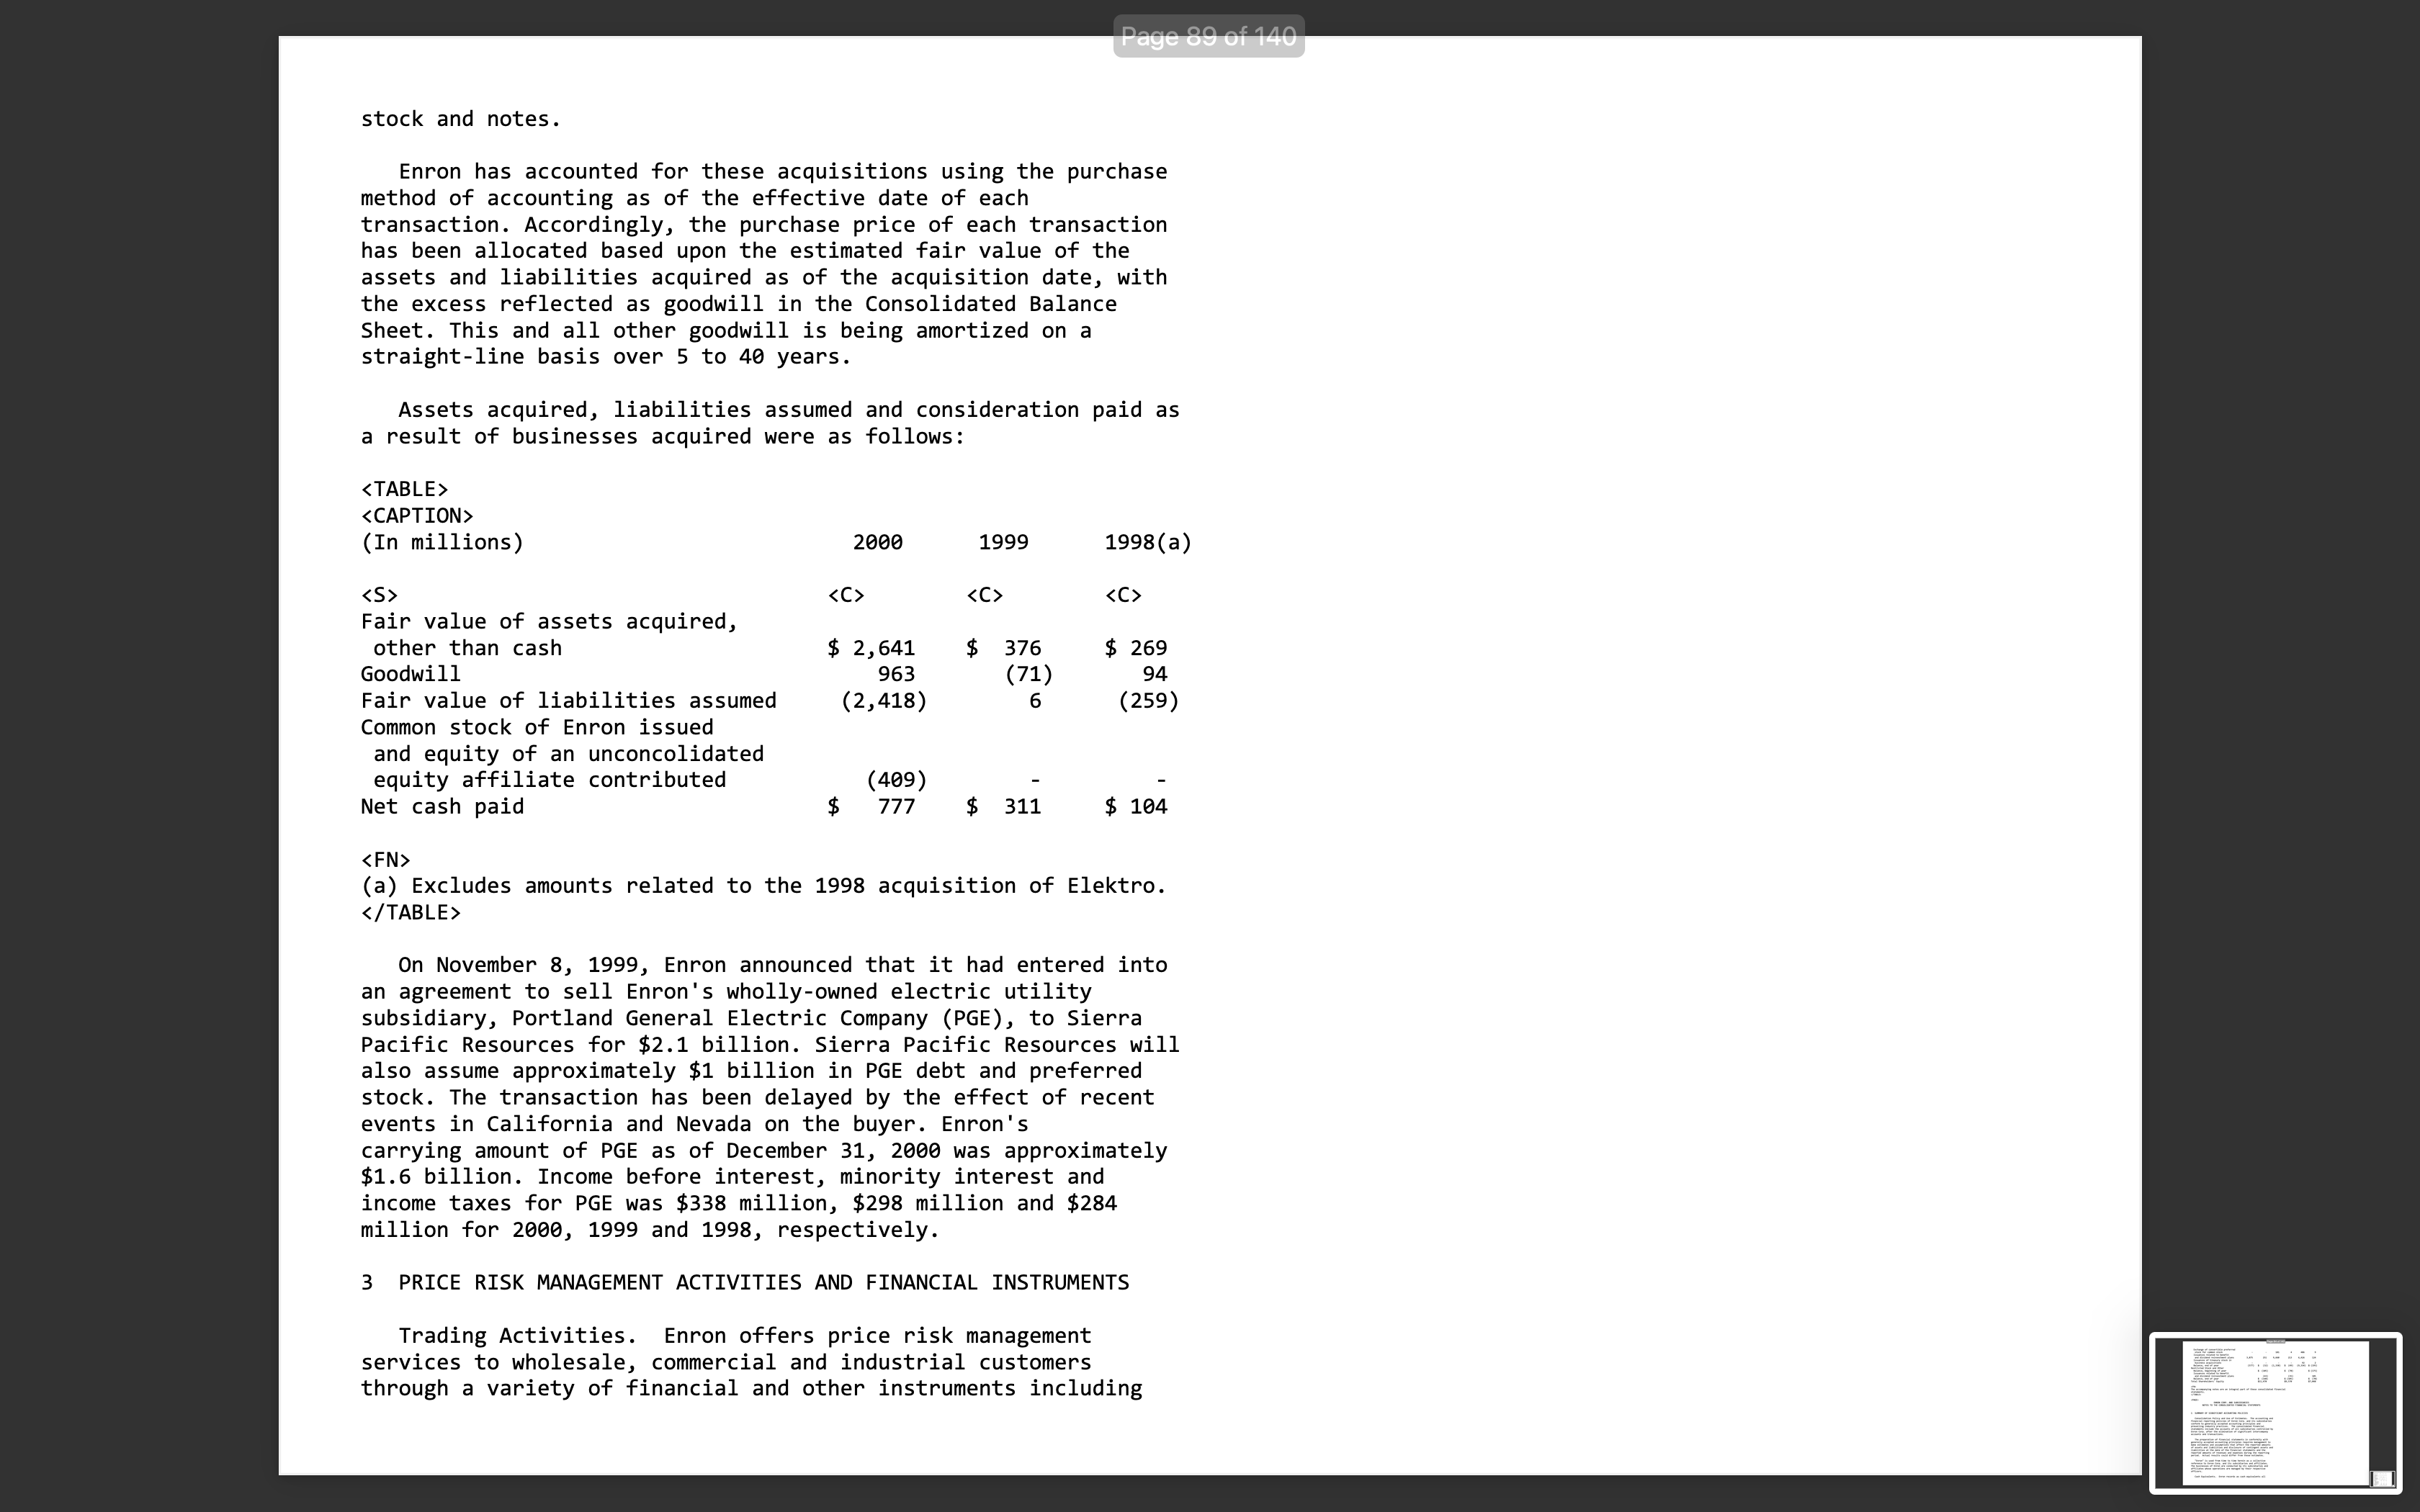
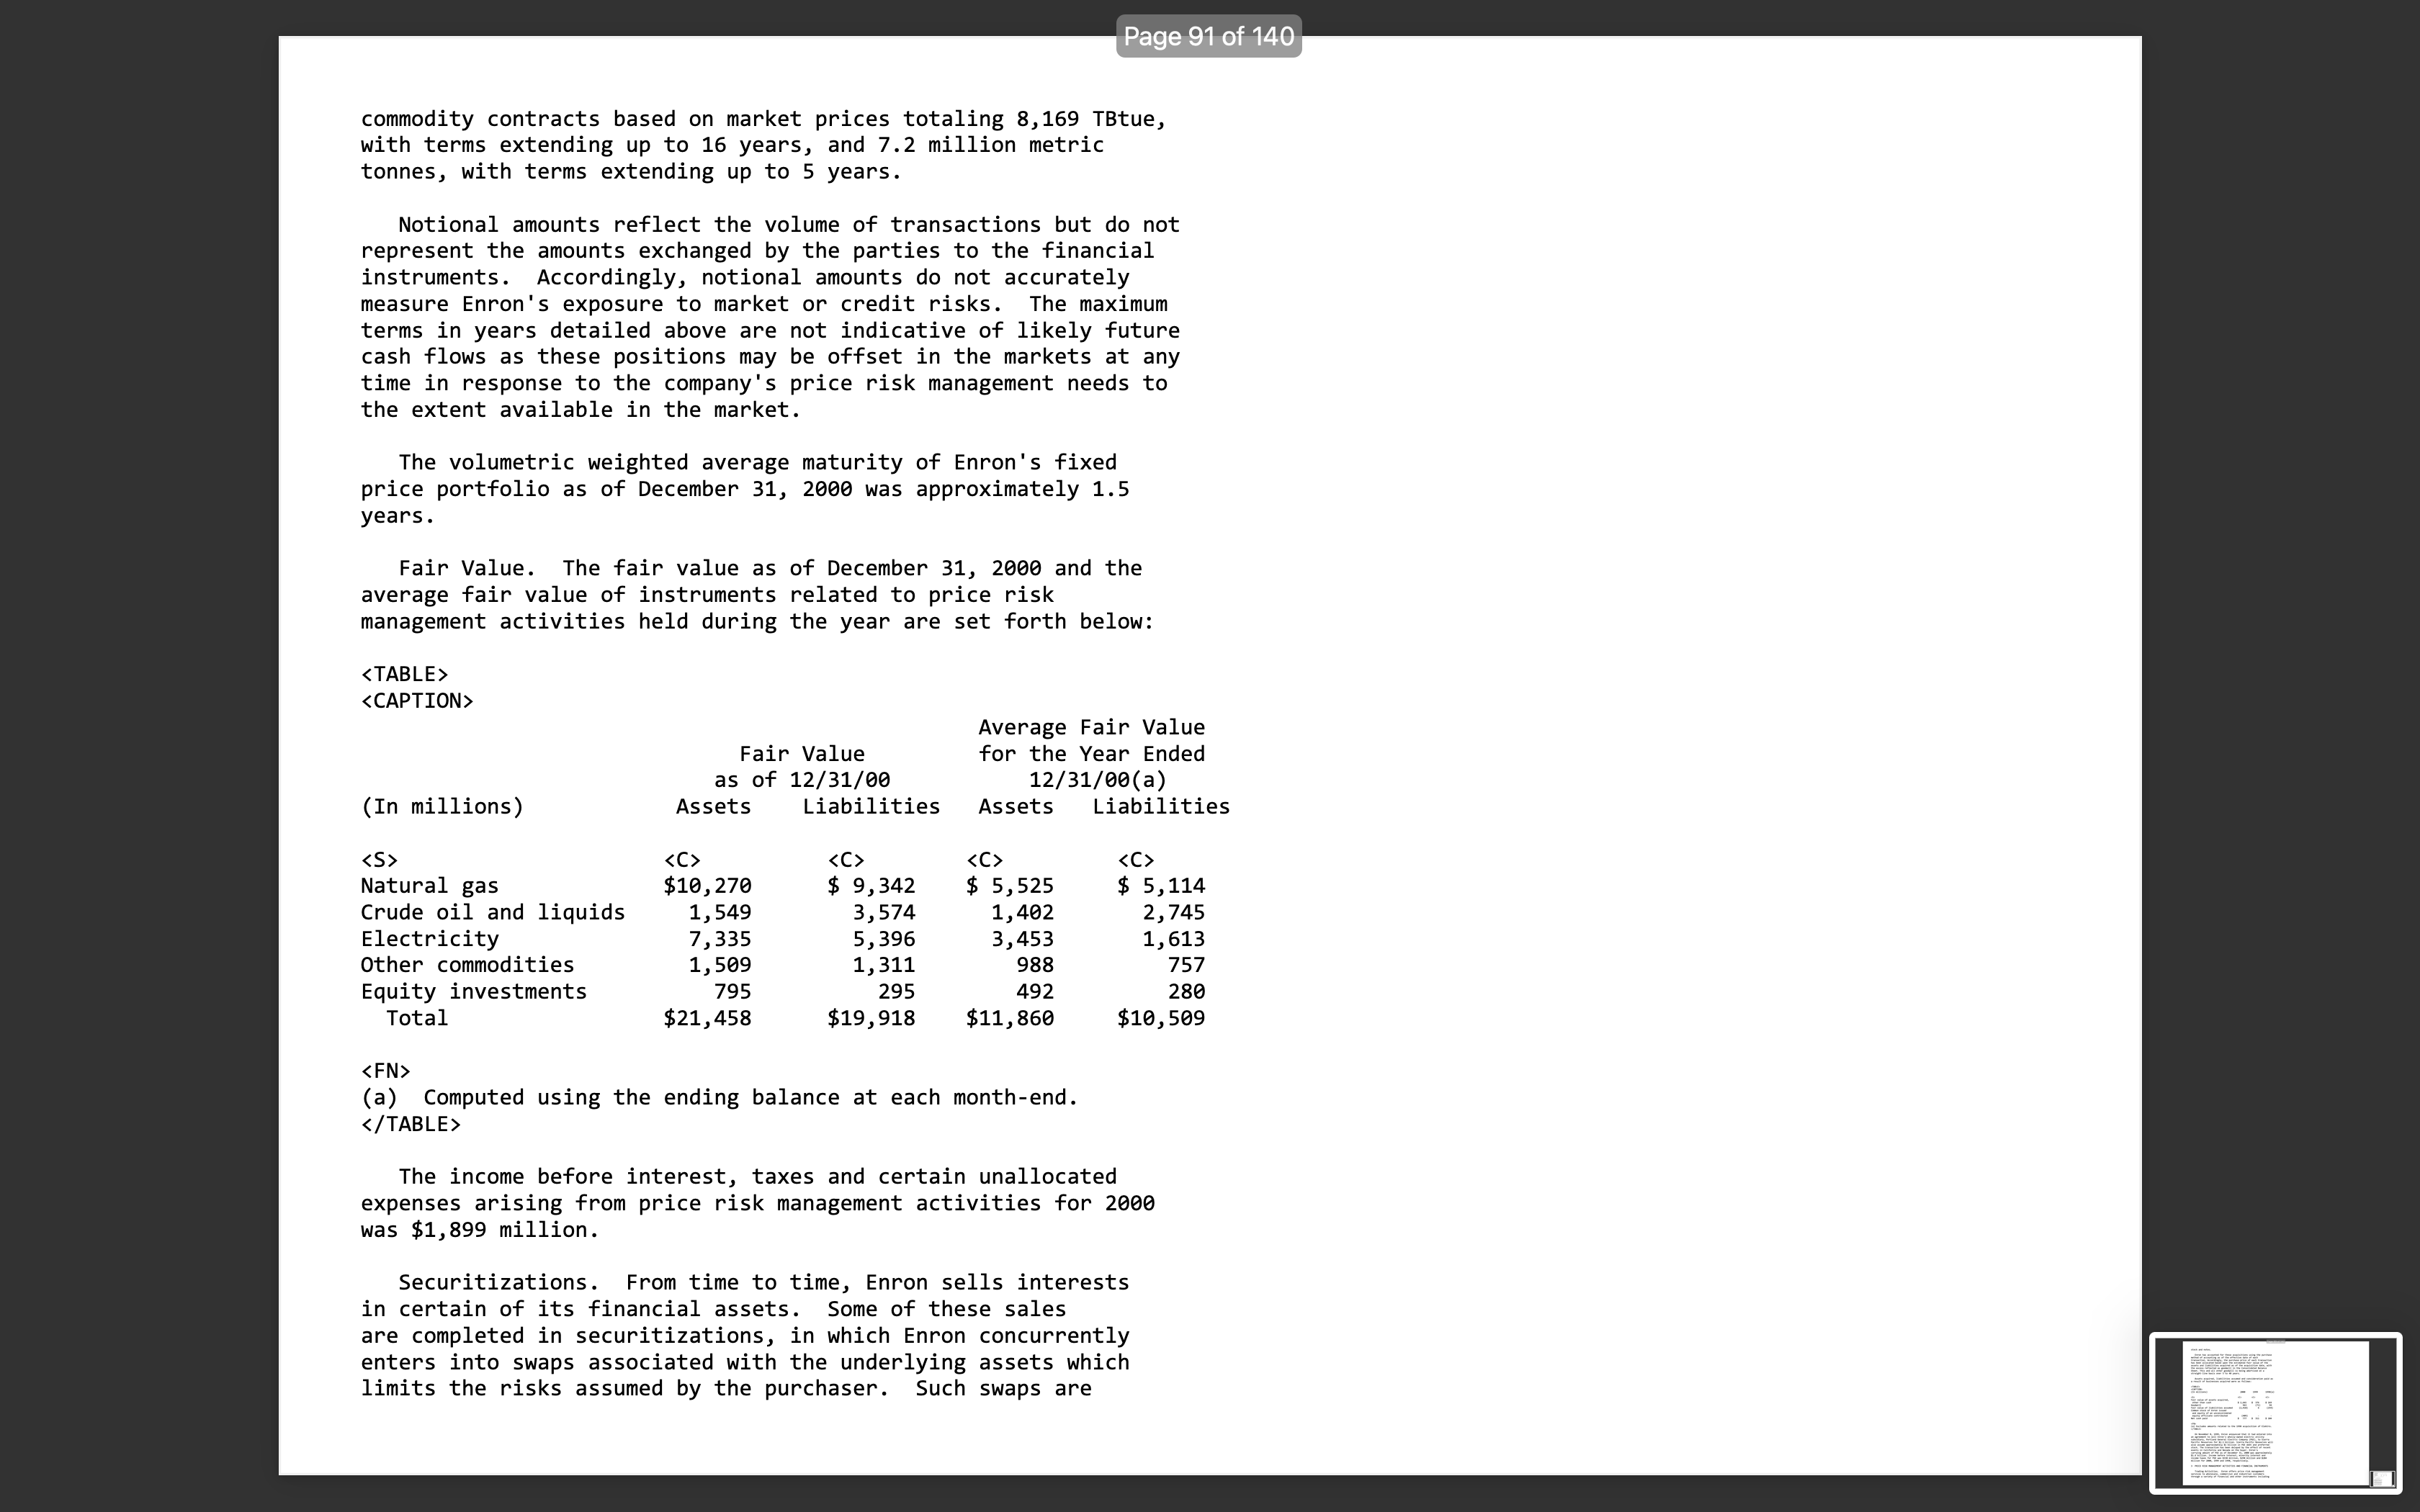
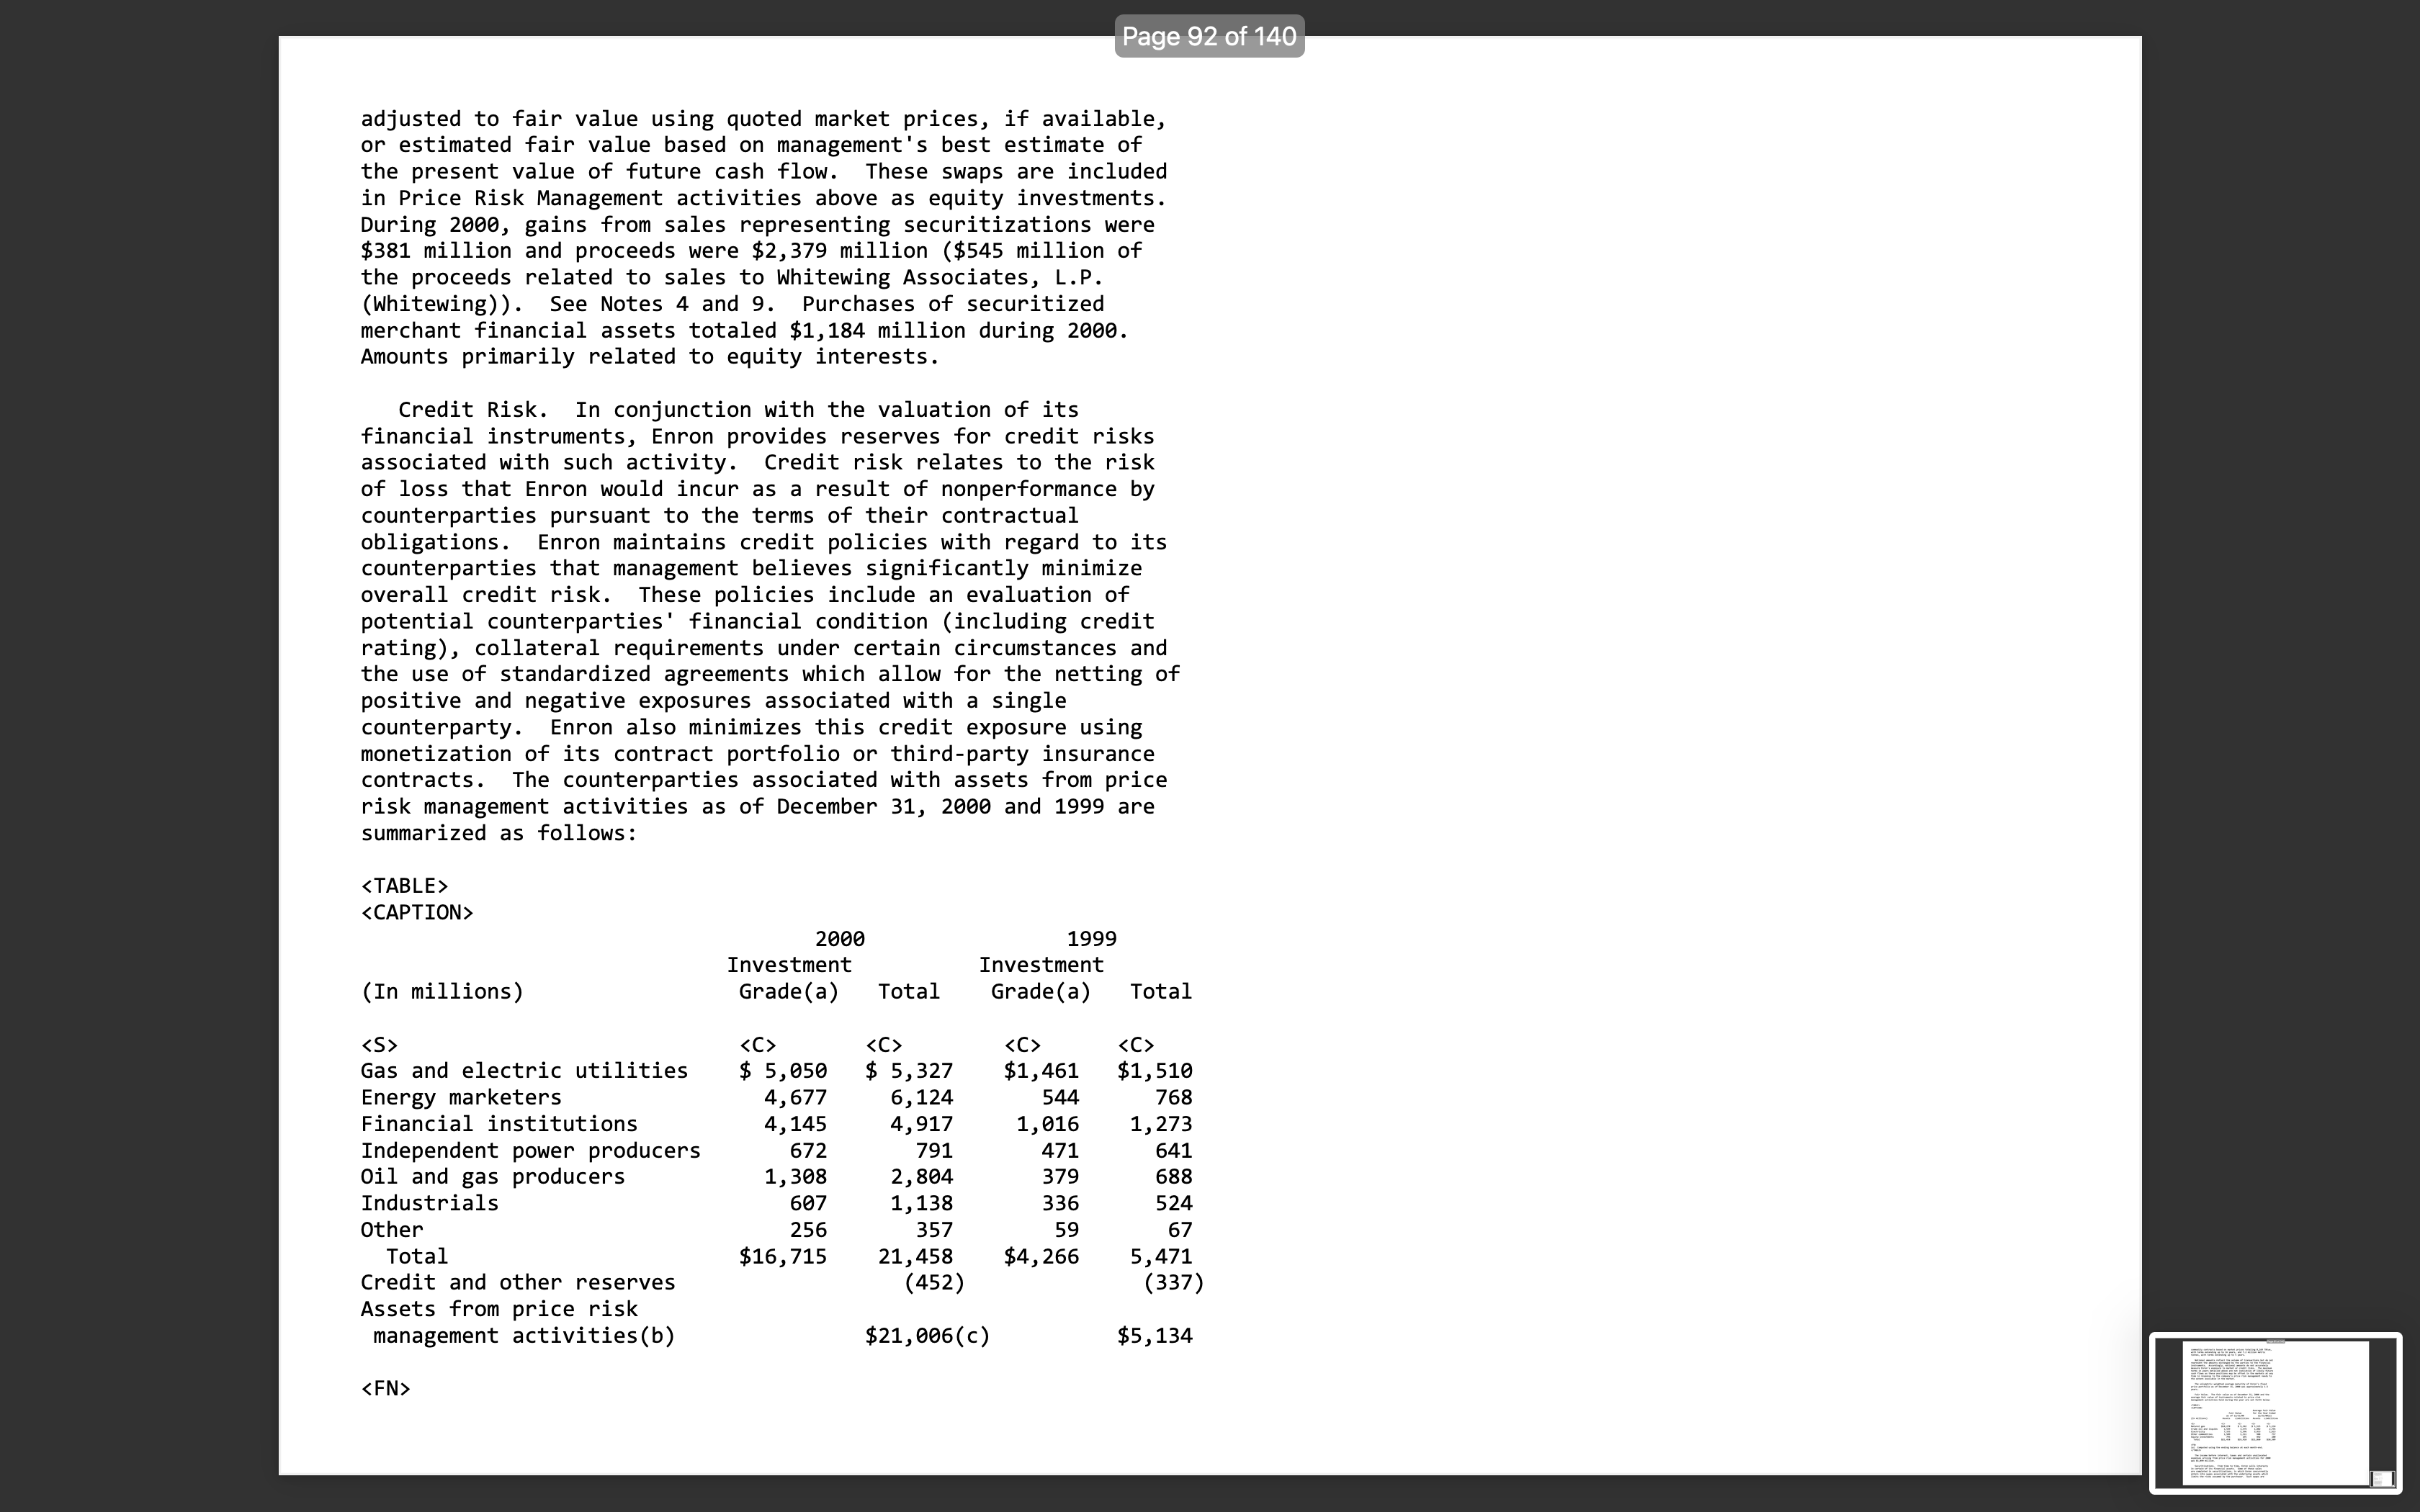
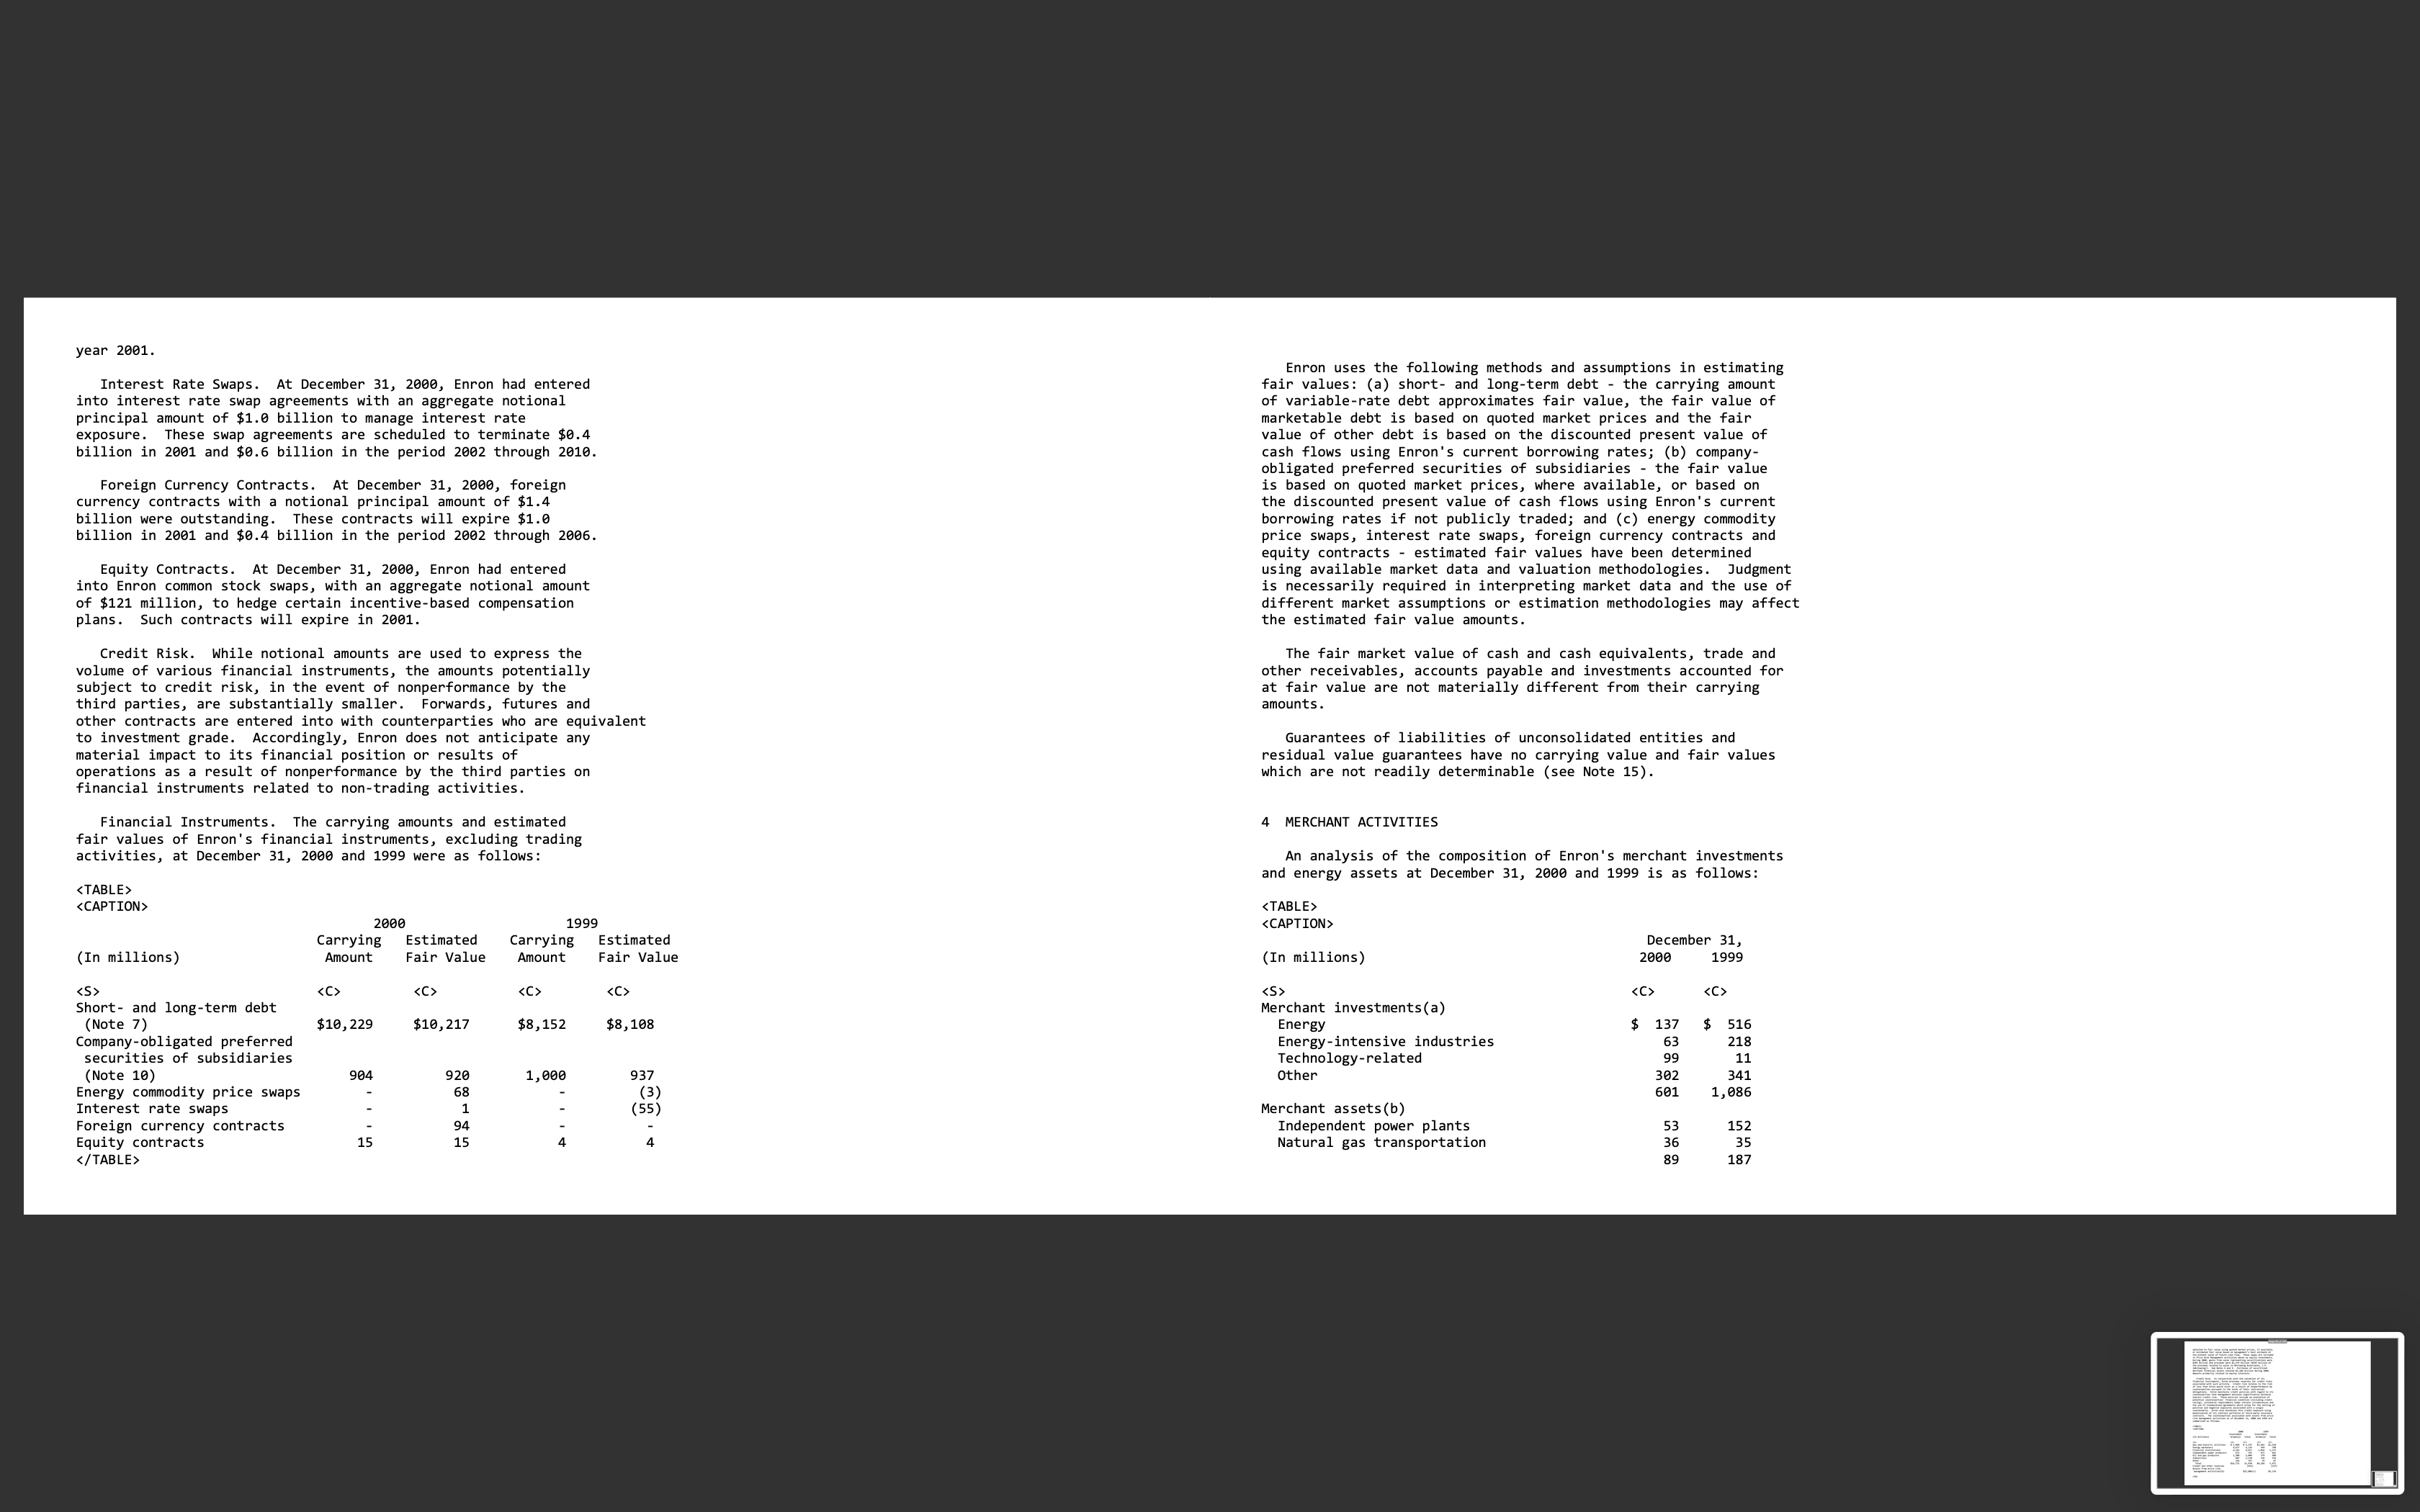
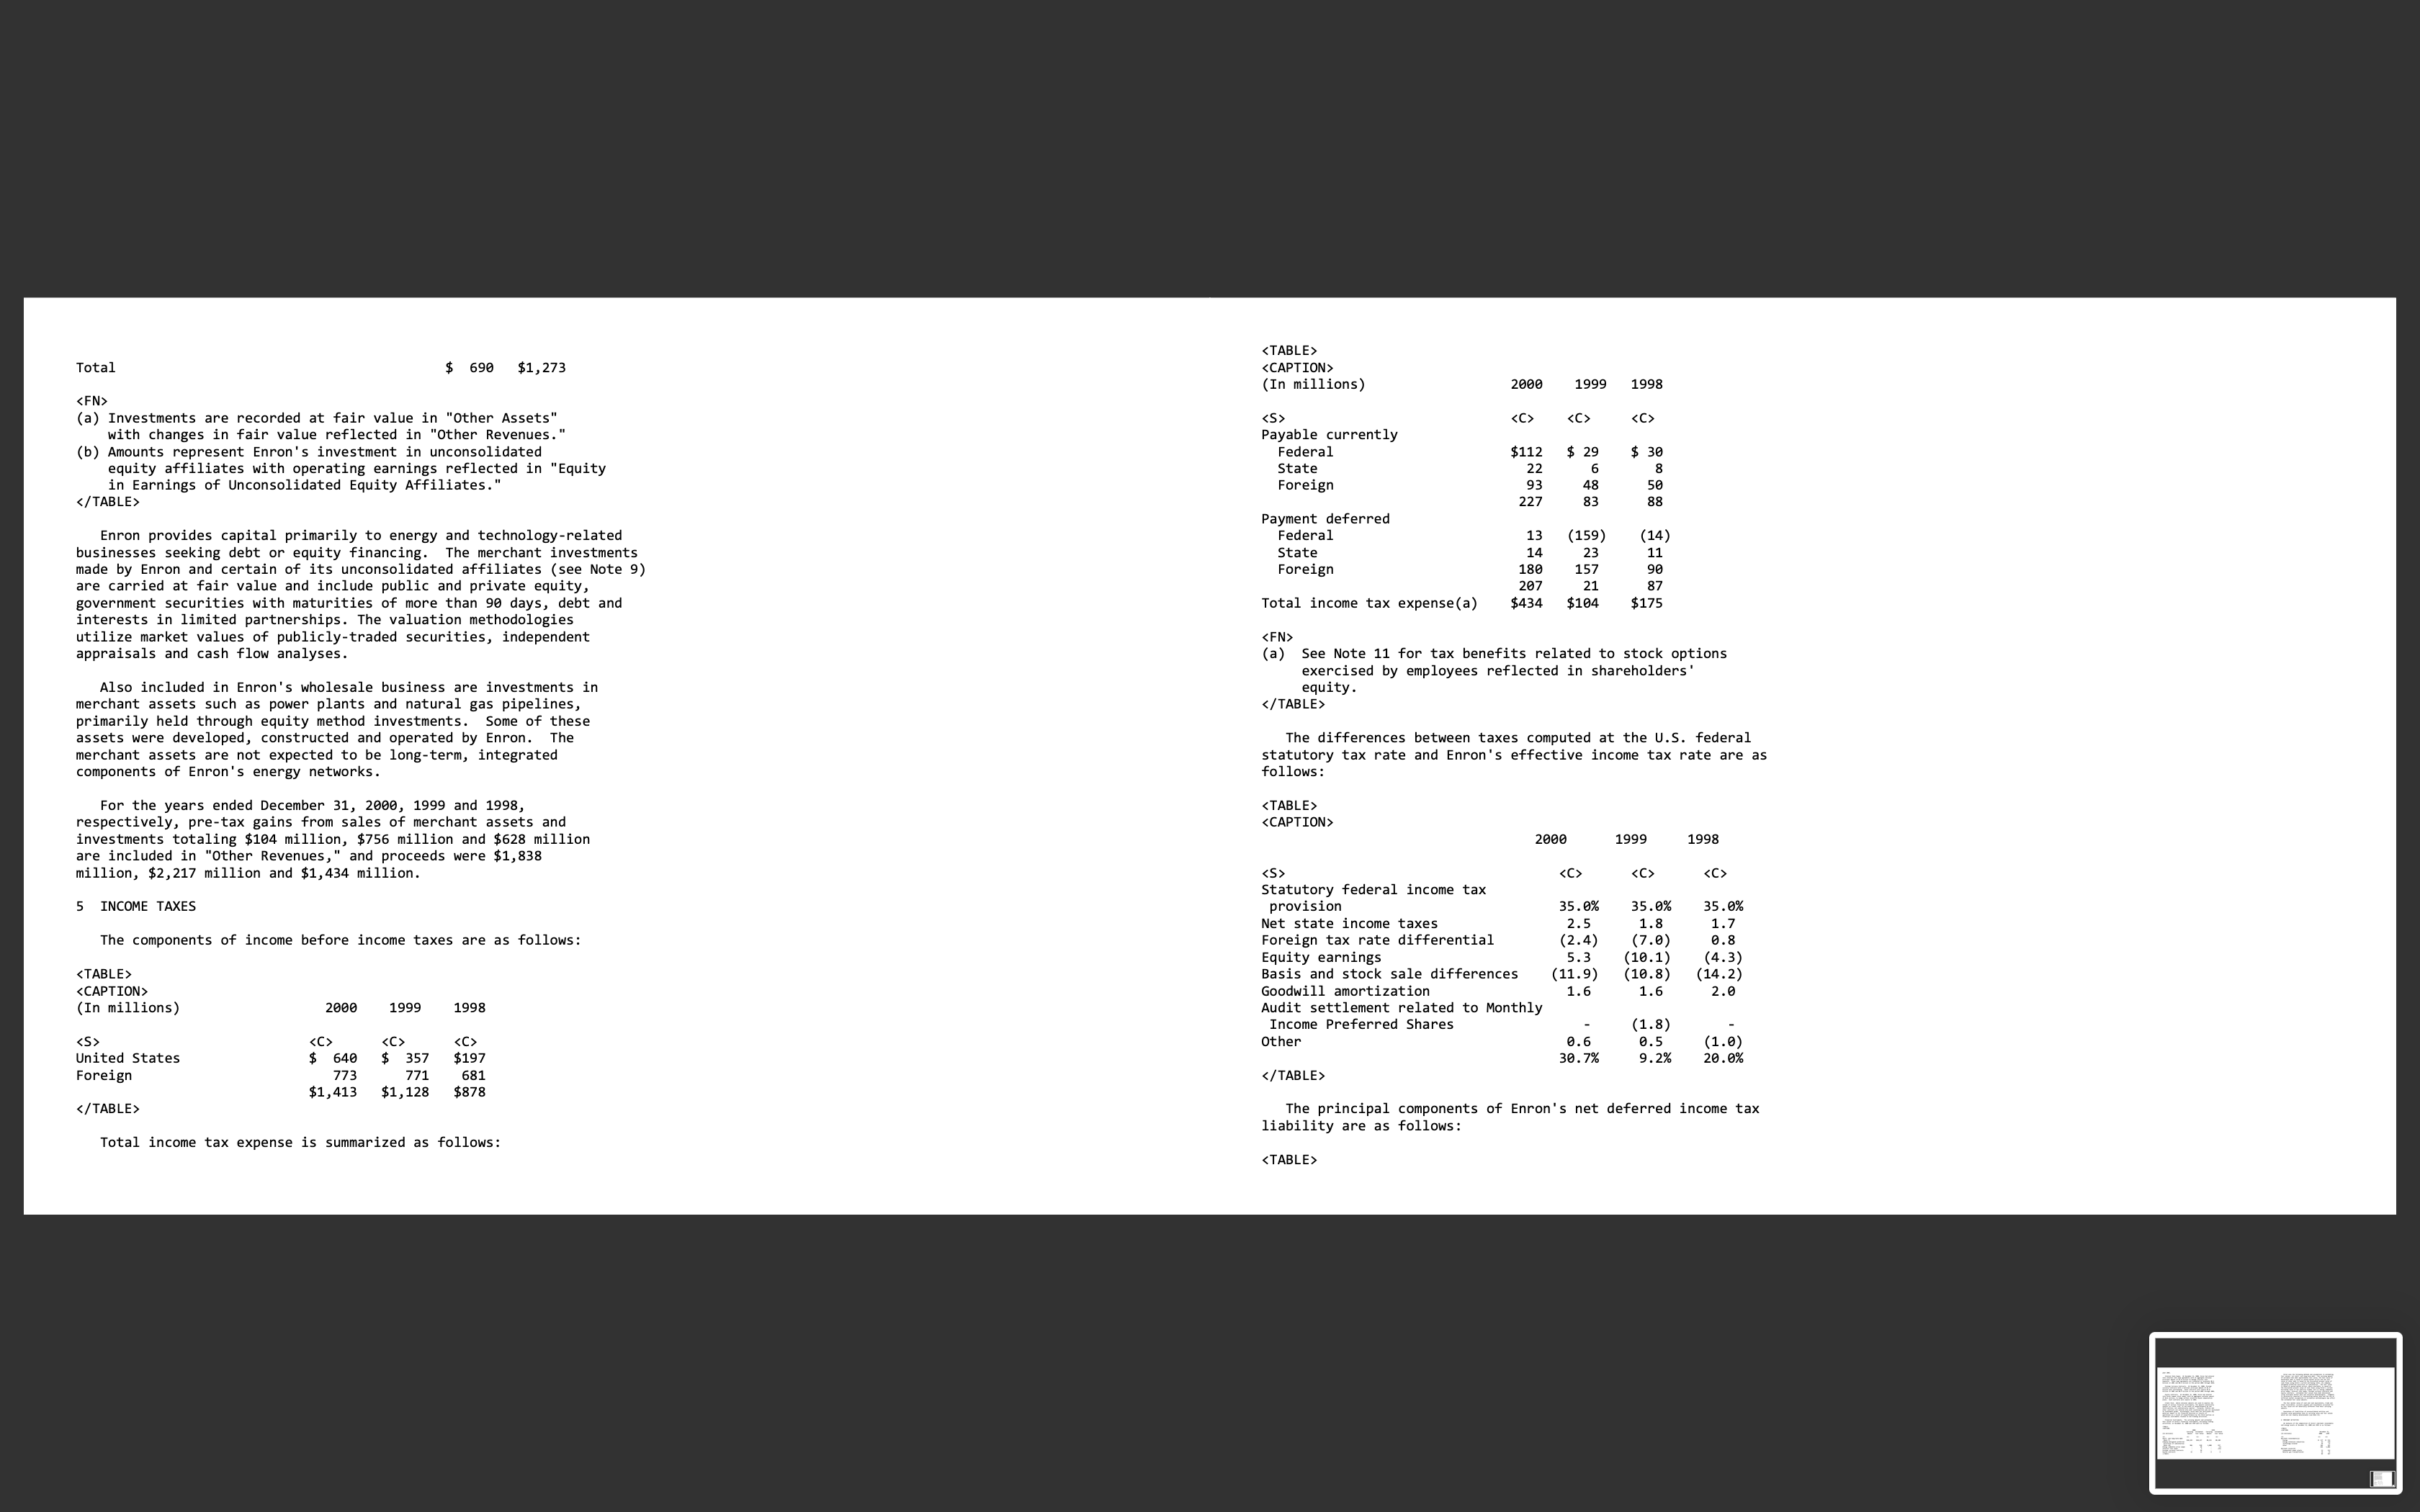
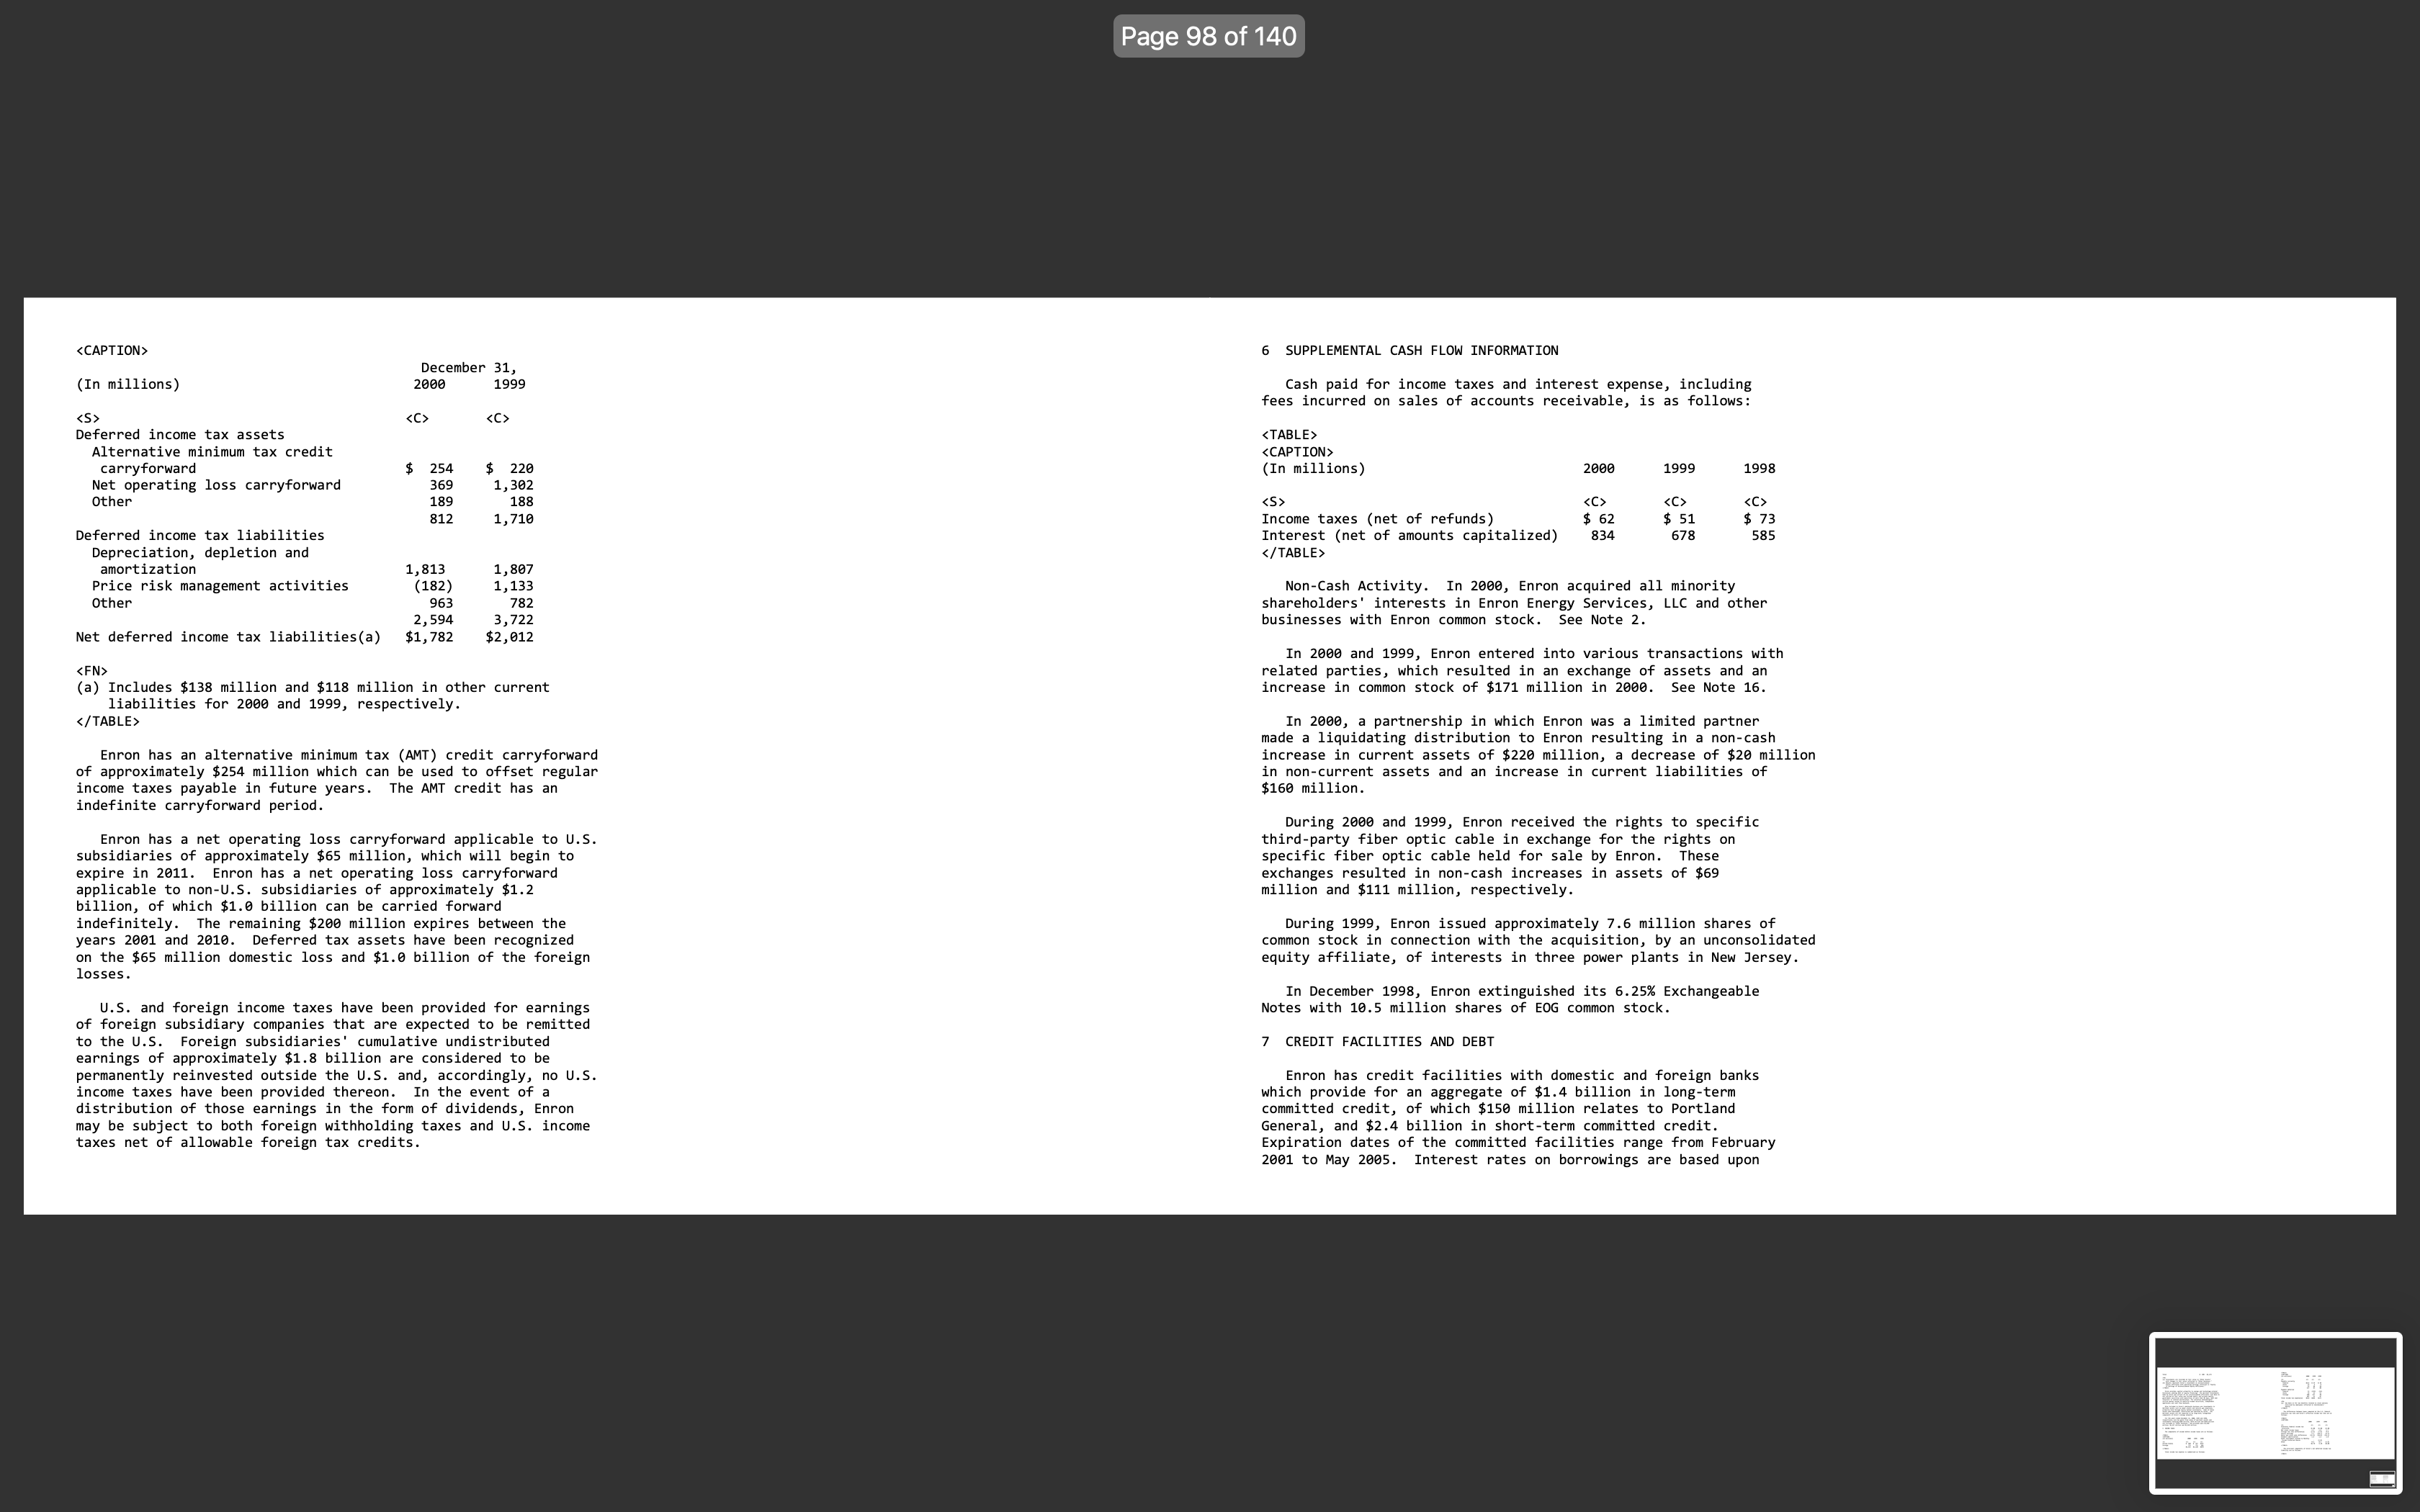
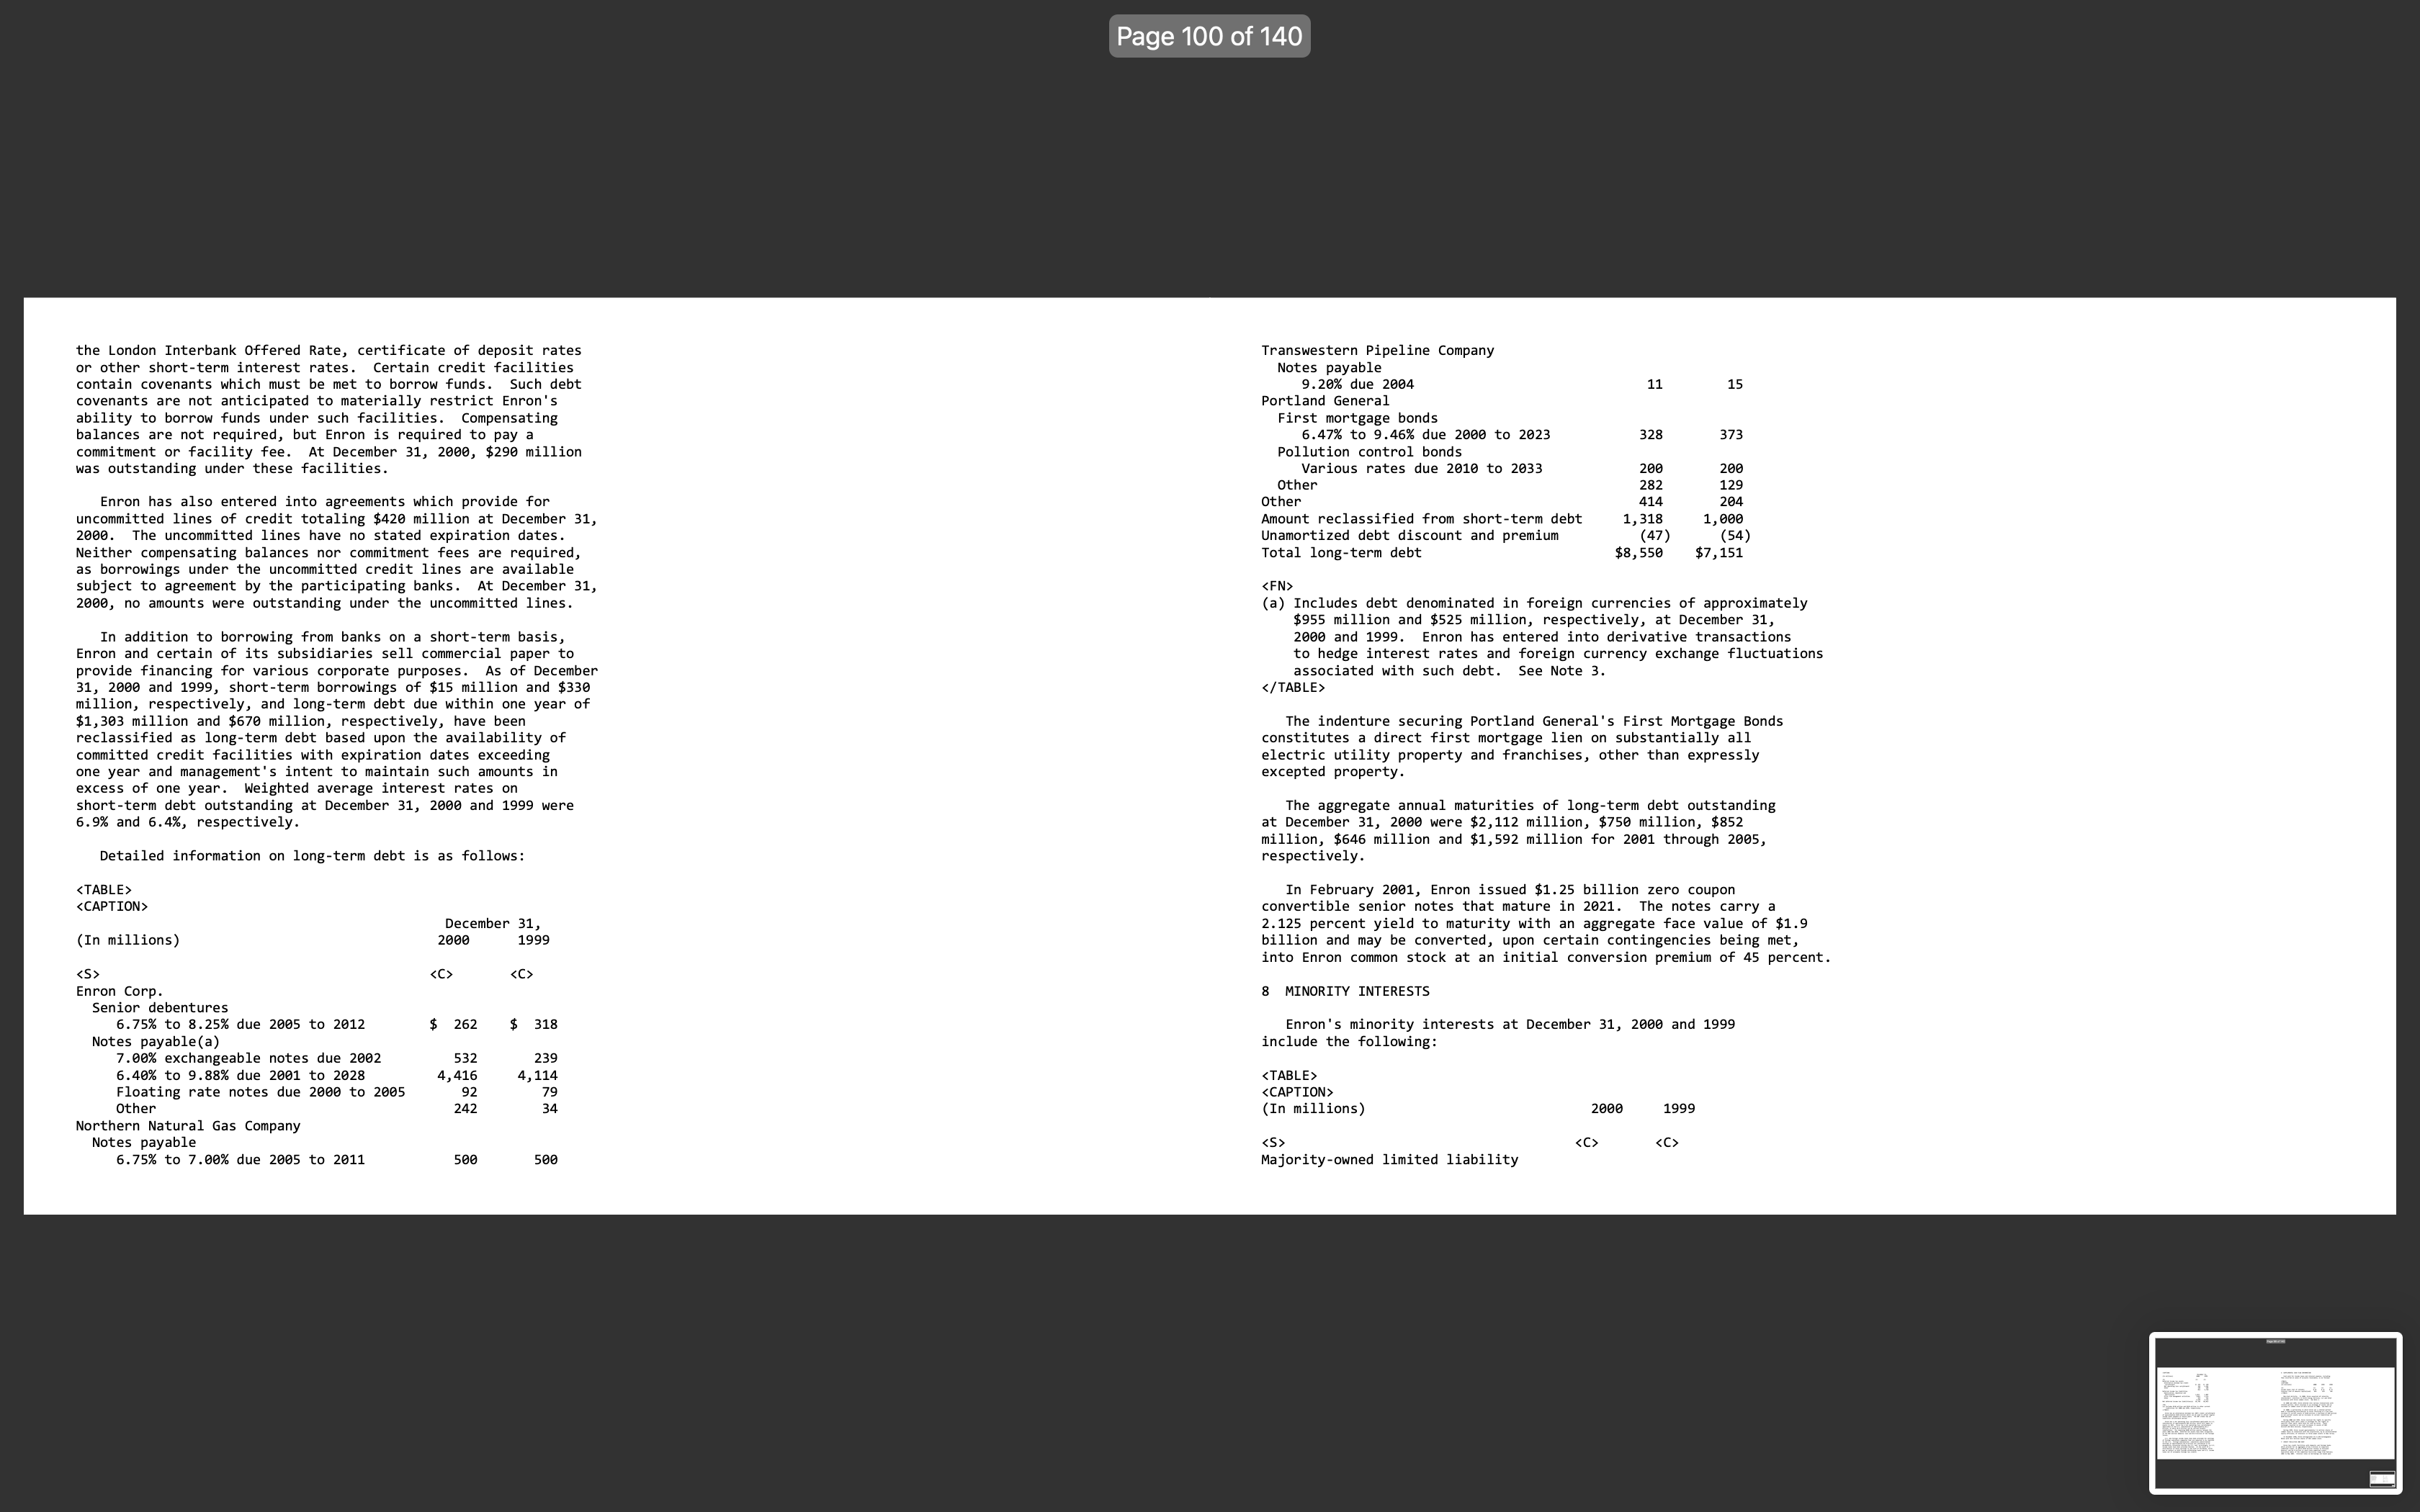
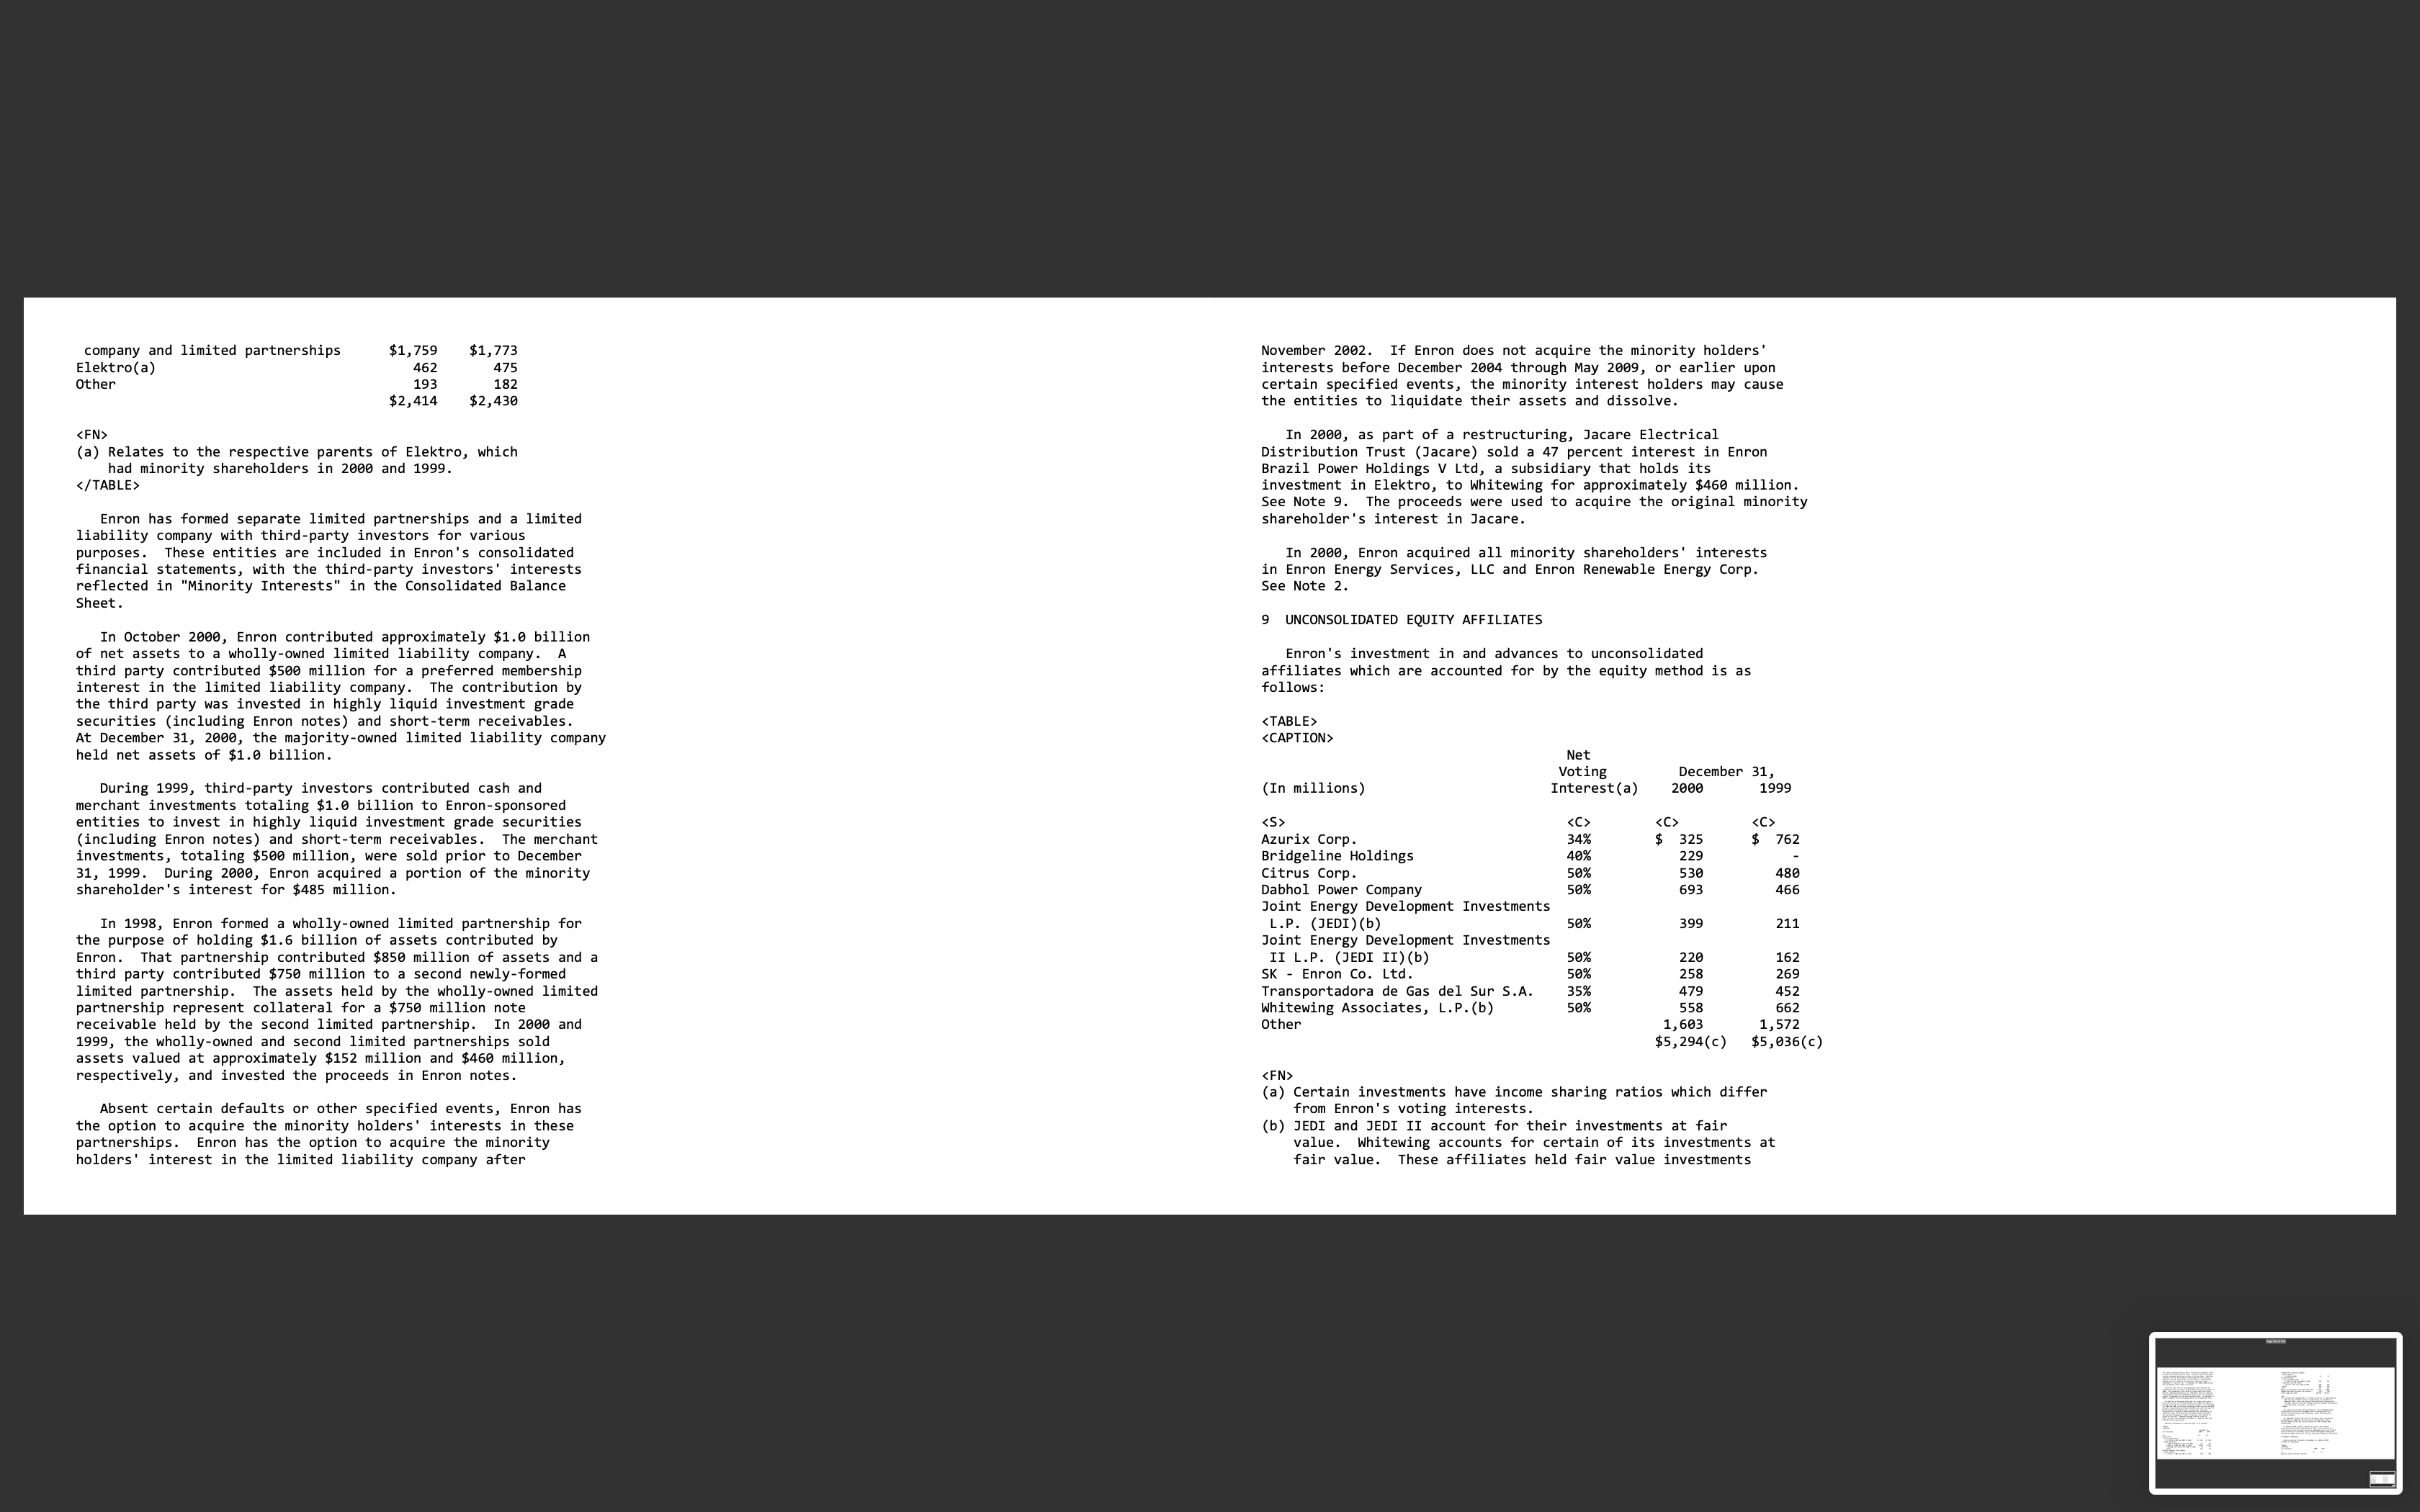
direct interaction. Wholesale Services markets, transports and provides energy commodities as reflected in the following table (including intercompany amounts): TABLE (BBtue/d) 196,148 99,337 75,266 FN (a) Billion British thermal units equivalent per day. (b) Includes third-party transactions by Enron Energy Services. (c) Represents electricity volumes marketed, converted to BBtue/d. /TABLE During 2000, Wholesale Services strengthened its position in the deregulated North American gas markets and deregulating power markets. Enron also continued to expand its presence in Europe, particularly on the Continent where wholesale markets began deregulation in early 1999. New product offerings in coal, metals, steel and pulp and paper markets also added favorably to the results. Assets and Investments. Wholesale Services' businesses make investments in various energy and certain related claims, either taken individually or in the aggregate, will have a material impact on Enron's financial position or results of operations. Item 4. SUBMISSION OF MATTERS TO A VOTE OF SECURITY HOLDERS None. PAGE PART II Item 5. MARKET FOR THE REGISTRANT'S COMMON EQUITY AND RELATED SHAREHOLDER MATTERS Common Stock The following table indicates the high and low sales prices for the common stock of Enron as reported on the New York Stock Exchange (consolidated transactions reporting system), the principal market in which the securities are traded, and dividends paid per share for the calendar quarters indicated. The common stock is also listed for trading on the Chicago Stock Exchange and the Pacific Stock Exchange, as well as The London Stock Exchange and Frankfurt Stock Exchange. TABLE Cumulative Second Preferred Convertible Stock The following table indicates the high and low sales prices for the Cumulative Second Preferred Convertible Stock ("Second Preferred Stock") of Enron as reported on the New York Stock Exchange (consolidated transactions reporting system), the principal market in which the securities are traded, and dividends paid per share for the calendar quarters indicated. The Second Preferred Stock is also listed for trading on the Chicago Stock Exchange. TABLE At December 31, 2000, there were approximately 58,920 record holders of common stock and 160 record holders of Second Preferred Stock. Other information required by this item is set forth under Item 6 -- "Selected Financial Data (Unaudited) Common Stock Statistics" for the years 1996-2000. PAGE TABLE ITEM 6. SELECTED FINANCIAL DATA (UNAUDITED) (a) Share and per share amounts have been restated to reflect the two-for-one stock split effective August 13, 1999. / TABLE PAGE ITEM 7. MANAGEMENT'S DISCUSSION AND ANALYSIS OF FINANCIAL CONDITION AND RESULTS OF OPERATIONS The following review of the results of operations and financial condition of Enron Corp. and its subsidiaries and affiliates (Enron) should be read in conjunction with the Consolidated Financial Statements. RESULTS OF OPERATIONS Consolidated Net Income Enron's net income for 2000 was $979 million compared to $893 million in 1999 and $703 million in 1998. Items impacting comparability are discussed in the respective segment results. Net income before items impacting comparability was $1,266 million, $957 million and $698 million, respectively, in 2000 , 1999 and 1998. Enron's business is divided into five segments and Exploration and Production (Enron Oil \& Gas Company) through August 16, 1999 (see Note 2 to the Consolidated Financial Statements). Enron's operating segments include: Transportation and Distribution. Transportation and Distribution consists of Enron Transportation Services and Portland General. Transportation Services includes Enron's interstate natural gas pipelines, primarily Northern Natural Gas Company (Northern), Transwestern Pipeline Company (Transwestern), Enron's 50% interest in Florida Gas Transmission Company (Florida Gas) and Enron's interests in Northern Border Partners, L.P. and EOTT Energy Partners, L.P. (EOTT). Wholesale Services. Wholesale Services includes Enron's wholesale businesses around the world. Wholesale Services operates in developed markets such as North America and Europe, as well as developing or newly deregulating markets including South America, India and Japan. Retail Energy Services. Enron, through its subsidiary Enron Energy Services, LLC (Energy Services), is extending its energy expertise and capabilities to end-use retail customers in the industrial and commercial business sectors to manage their energy requirements and reduce their total energy costs. Broadband Services. Enron's broadband services business (Broadband Services) provides customers with a single source for broadband services, including bandwidth intermediation and the delivery of premium content. Corporate and Other. Corporate and Other includes Enron's investment in Azurix Corp. (Azurix), which provides water and wastewater services, results of Enron Renewable Energy Corp. (EREC), which develops and constructs wind-generated power projects, and the operations of Enron's methanol and MTBE plants as well as overall corporate activities of Enron. FN (a) Tax affected at 35%, except where a specific tax rate applied. /TABLE Diluted earnings per share of common stock were as follows: TABLE FN (a) Restated to reflect the two-for-one stock split effective August 13, 1999. / TABLE Income Before Interest, Minority Interests and Income Taxes The following table presents income before interest, minority interests and income taxes (IBIT) for each of Enron's operating segments (see Note 20 to the Consolidated Financial Statements): TABLE Transportation and Distribution Transportation Services. The following table summarizes total volumes transported by each of Enron's interstate natural gas pipelines. FN (a) Billion British thermal units per day. Amounts reflect 100% of each entity's throughput volumes. Florida Gas and Northern Border Pipeline are unconsolidated equity affiliates. /TABLE Significant components of IBIT are as follows: TABLE CAPTION ITn mil1innel Dana 10001000 Net Revenues Revenues, net of cost of sales, of Transportation Services increased $24 million (4\%) during 2000 and declined $14 million (2\%) during 1999 as compared to 1998. In 2000, Transportation Services' interstate pipelines produced strong financial results. The volumes transported by Transwestern increased 13 percent in 2000 as compared to 1999. Northern's 2000 gross margin was comparable to 1999 despite an 8 percent decline in volumes transported. Net revenues in 2000 were favorably impacted by transportation revenues from Transwestern's Gallup, New Mexico expansion and by sales from Northern's gas storage inventory. The decrease in net revenue in 1999 compared to 1998 was primarily due to the expiration, in October 1998, of certain transition cost recovery surcharges, partially offset by a Northern sale of gas storage inventory in 1999. Operating Expenses Operating expenses, including depreciation and amortization, of Transportation Services increased $17 million (5\%) during 2000 primarily as a result of higher overhead costs related to information technology and employee benefits. Operating expenses decreased $16 million (5\%) during 1999 primarily as a result of the expiration of certain transition cost recovery surcharges which had been recovered through revenues. Equity Earnings Equity in earnings of unconsolidated equity affiliates increased \$25 million and \$6 million in 2000 and 1999, respectively. The increase in equity earnings in 2000 as compared to 1999 primarily relates to Enron's investment in Florida Gas. The increase in earnings in 1999 as compared to 1998 was primarily a result of higher earnings from Northern Border Pipeline and EOTT. Other, Net Other, net decreased $21 million in 2000 as compared to 1999 after increasing $21 million in 1999 as compared to 1998. Included in 2000 were gains related to an energy commodity contract and the sale of compressor-related equipment, while the 1999 amount included interest income earned in connection with the financing of an acquisition by EOTT. The 1998 amount included gains from the sale of an interest in an equity investment, substantially offset by charges related to litigation. Portland General. Portland General realized IBIT as follows: Revenues, net of purchased power and fuel costs, increased $55 million in 2000 as compared to 1999 . The increase is primarily the result of a significant increase in the price of power sold and an increase in wholesale sales, partially offset by higher purchased power and fuel costs. Operating expenses increased primarily due to increased plant maintenance costs related to periodic overhauls. Depreciation and amortization increased in 2000 primarily as a result of increased regulatory amortization. other, net in 2000 included the impact of an Oregon Public Utility Commission (OPUC) order allowing certain deregulation costs to be deferred and recovered through rate cases, the settlement of litigation related to the Trojan nuclear power generating facility and gains on the sale of certain generation-related assets. Revenues, net of purchased power and fuel costs, decreased $5 million in 1999 as compared to 1998. Revenues increased primarily as a result of an increase in the number of customers served by Portland General. Higher purchased power and fuel costs, which increased 42 percent in 1999, offset the increase in revenues. Other income, net increased $31 million in 1999 as compared to 1998 primarily as a result of a gain recognized on the sale of certain assets. In 1999, Enron entered into an agreement to sell Portland General Electric Company to Sierra Pacific Resources. See Note 2 to the Consolidated Financial Statements. Statistics for Portland General are as follows: FN (a) Thousand megawatt-hours. (b) Mills (1/10 cent) per kilowatt-hour. /TABLE Outlook Enron Transportation Services is expected to provide stable earnings and cash flows during 2001. The four major natural gas pipelines have strong competitive positions in their respective markets as a result of efficient operating practices, competitive rates and favorable market conditions. Enron Transportation Services expects to continue to pursue demand-driven expansion opportunities. Florida Gas expects to complete an expansion that will increase throughput by 198 million cubic feet per day (MMcf/d) by mid-2001. Florida Gas has received preliminary approval from the Federal Energy Regulatory Commission for an expansion of 428MMcf/d, expected to be completed by early 2003, and is also pursuing an expansion of 150MMcf/d that is expected to be completed in mid-2003. Transwestern completed an expansion of 140MMcf/d in May 2000 and is pursuing an expansion of 50MMcf/d that is expected to be completed in 2001 and an additional expansion of up to 150MMcf/d that is expected to be completed in 2002. Northern Border Partners is evaluating the development of a 325 mile pipeline with a range of capacity from 375MMcf/d to 500MMcf/d to connect natural gas production in Wyoming to the Northern Border Pipeline in Montana. In 2001, Portland General anticipates purchased power and fuel costs to remain at historically high levels. Portland General has submitted a request with the OPUC to recover the anticipated cost increase through a rate adjustment. Wholesale Services Enron builds its wholesale businesses through the creation of networks involving selective asset ownership, contractual access to third-party assets and market-making activities. Each market in which Wholesale Services operates utilizes these components in a slightly different manner and is at a different stage of development. This network strategy has enabled wholesale Services to establish a leading position in its markets. Wholesale Services' activities are categorized into two business lines: (a) Commodity Sales and Services and (b) Assets and Investments. Activities may be integrated into a bundled product offering for Enron's customers. Wholesale Services manages its portfolio of contracts and assets in order to maximize value, minimize the associated risks and provide overall liquidity. In doing so, Wholesale Services uses portfolio and risk management disciplines, including offsetting or hedging transactions, to manage exposures to market price movements (commodities, interest rates, foreign currencies and equities). Additionally, Wholesale Services manages its liquidity and exposure to third-party credit risk through monetization of its contract portfolio or third-party insurance contracts. Wholesale Services also sells interests in certain investments and other assets to improve liquidity and overall return, the timing of which is dependent on market conditions and management's expectations of the investment's value. The following table reflects IBIT for each business line: TABLE The following discussion analyzes the contributions to IBIT for each business line. Commodity Sales and Services. Wholesale Services provides reliable commodity delivery and predictable pricing to its customers through forwards and other contracts. This marketmaking activity includes the purchase, sale, marketing and delivery of natural gas, electricity, liquids and other commodities, as well as the management of Wholesale Services' own portfolio of contracts. Contracts associated with this activity are accounted for using the mark-to-market method of accounting. See Note 1 to the Consolidated Financial Statements. Wholesale Services' market-making activity is facilitated through a network of capabilities including selective asset ownership. Accordingly, certain assets involved in the delivery of these services are included in this business (such as intrastate natural gas pipelines, gas storage facilities and certain electric generation assets). Wholesale Services markets, transports and provides energy commodities as reflected in the following table (including intercompany amounts): FN (a) Billion British thermal units equivalent per day. (b) Includes third-party transactions by Enron Energy Services. (c) Represents electricity volumes, converted to BBtue/d. /TABLE Earnings from commodity sales and services increased $1.0 billion (160\%) in 2000 as compared to 1999. Increased profits from North American gas and power marketing operations, European power marketing operations as well as the value of new businesses, such as pulp and paper, contributed to the earnings growth of Enron's commodity sales and services business. Continued market leadership in terms of volumes transacted, significant increases in natural gas prices and price volatility in both the gas and power markets were the key contributors to increased profits in the gas and power intermediation businesses. In late 1999, Wholesale Services launched an Internet-based Ecommerce system, Enrononline, which allows wholesale customers to view Enron's real time pricing and to complete commodity transactions with Enron as principal, with no direct interaction. In its first full year of operation, Enrononline positively impacted wholesale volumes, which increased 59 percent over 1999 levels. Earnings from commodity sales and services increased $217 a solid base of earnings. Enron's strengths, including its ability to identify and respond to customer needs, access to extensive physical assets and its integrated product offerings, are important drivers of the expected continued earnings growth. In addition, significant earnings are expected from Wholesale Services' commodity portfolio and investments, which are subject to market fluctuations. External factors, such as the amount of volatility in market prices, impact the earnings opportunity associated with Wholesale Services' business. Risk related to these activities is managed using naturally offsetting transactions and hedge transactions. The effectiveness of Enron's risk management activities can have a material impact on future earnings. See "Financial Risk Management" for a discussion of market risk related to Wholesale Services. Retail Energy Services Energy Services sells or manages the delivery of natural gas, electricity, liquids and other commodities to industrial and commercial customers located in North America and Europe. Energy Services also provides outsourcing solutions to customers for full energy management. This integrated product includes the management of commodity delivery, energy information and energy assets, and price risk management activities. The commodity portion of the contracts associated with this business are accounted for using the mark-to-market method of accounting. See Note 1 to the Consolidated Financial Statements. securities. Broadband Services uses risk management disciplines, including hedging transactions, to manage the impact of market price movements on its merchant investments. Broadband Services also sells interests in certain investments and other assets to improve liquidity and overall return, the timing of which is dependent on market conditions and management's expectations of the investment's value. The components of Broadband Services' businesses include the development and construction of the Enron Intelligent Network, sales of excess fiber and software, bandwidth intermediation and the delivery of content. Significant components of Broadband Services' results are as follows: TABLE CAPTION (Tn mi 11 inns) 2A Broadband Services recognized a loss before interest, minority interests and taxes of $60 million in 2000. Gross margin included earnings from sales of excess fiber capacity, a significant increase in the market value of Broadband Services' merchant investments and the monetization of a portion of Enron's broadband content delivery platform. Expenses incurred during the period include expenses related to building the business and depreciation and amortization. Outlook Broadband Services is extending Enron's proven business model to the communications industry. In 2001, Enron expects to further develop the Enron Intelligent Network, a global broadband network with broad connectivity potential to both buyers and sellers of bandwidth through Enron's pooling points. In addition, Enron expects to further deploy its proprietary Broadband Operating System across the Enron Intelligent Network, enabling Enron to manage bandwidth capacity independent of owning the underlying fiber. Broadband Services expects its intermediation transaction level to increase significantly in 2001 as more market participants connect to the pooling points and transact with Enron to manage their bandwidth needs. The availability of Enron's bandwidth intermediation products and prices on EnronOnline are expected to favorably impact the volume of transactions. In 2001, Broadband Services expects to continue to expand the commercial roll-out of its content service offerings including video-on-demand. Enron expects the volume of content delivered over its network to increase as more content delivery contracts are signed and as more distribution partner locations are connected. Corporate and other Significant components of Corporate and Other's IBIT are as follows : TRF Results for Corporate and Other in 2000 reflect operating losses from Enron's investment in Azurix (excluding the impairments discussed below) and increased information technology, employee compensation and corporate-wide expenses. Results for Corporate and Other in 1999 were impacted by higher corporate expenses, partially offset by increased earnings from EREC resulting from increased sales volumes from its German manufacturing subsidiary and from the completion and sale of certain domestic wind projects. Enron also recognized higher earnings related to Azurix. Results in 1998 were favorably impacted by increases in the market value of certain corporatemanaged financial instruments, partially offset by higher corporate expenses. Items impacting comparability in 2000 included a $326 million charge reflecting Enron's portion of impairments recorded by Azurix related to assets in Argentina. Items impacting comparability in 1999 included a pre-tax gain of $454 million on the exchange and sale of Enron's interest in EOG (see Note 2 to the Consolidated Financial Statements) and a $441 million pre-tax charge for the impairment of its MTBE assets (see Note 17 to the Consolidated Financial Statements). During 1998, Enron recognized a pre-tax gain of $22 million on the delivery of 10.5 million shares of EOG stock held by Enron as repayment of mandatorily exchangeable debt. Enron also recorded a $61 million charge to reflect losses on contracted MTBE production. Interest and Related Charges, Net Interest and related charges, net of interest capitalized which totaled $38 million, $54 million and $66 million for 2000 , 1999 and 1998, respectively, increased to $838 million in 2000 from $656 million in 1999 and $550 million in 1998. The increase in 2000 as compared to 1999 was primarily a result of increased long-term debt levels, increased average short-term borrowings, short-term debt assumed as a result of the acquisition of MG plc and higher interest rates in the U.S. The increase was partially offset by the replacement of debt related to a Brazilian subsidiary with lower interest rate debt. The increase in 1999 as compared to 1998 was primarily due to debt issuances and debt related to a Brazilian subsidiary, partially offset by a decrease in debt related to EOG following the sale and exchange of Enron's interests in August 1999. See Note 2 to the Consolidated Financial Statements. Minority Interests Minority interests include the following: TRIF FN (a) Relates to the respective parents of Elektro, which had minority shareholders in 2000 and 1999. See Note 8 to the Consolidated Financial Statements. /TABLE principle. Enron will also reclassify $532 million from "LongTerm Debt" to "Other Liabilities" due to the adoption. The total impact of Enron's adoption of SFAS No. 133 on earnings and on "Other Comprehensive Income" is dependent upon certain pending interpretations, which are currently under consideration, including those related to "normal purchases and normal sales" and inflation escalators included in certain contract payment provisions. The interpretations of these issues, and others, are currently under consideration by the FASB. While the ultimate conclusions reached on interpretations being considered by the FASB could impact the effects of Enron's adoption of SFAS No. 133, Enron does not believe that such conclusions would have a material effect on its current estimate of the impact of adoption. FINANCIAL CONDITION Cash Flows TABLE CPTTON Net cash provided by operating activities increased $3,551 million in 2000 , primarily reflecting decreases in working capital, positive operating results and a receipt of cash associated with the assumption of a contractual obligation. Net cash provided by operating activities decreased $412 million in 1999, primarily reflecting increases in working capital and net assets from price risk management activities, partially offset by increased earnings and higher proceeds from sales of merchant assets and investments. The 1998 amount reflects positive operating cash flow from Enron's major business segments, proceeds from sales of interests in energyrelated merchant assets and cash from timing and other changes related to Enron's commodity portfolio, partially offset by new investments in merchant assets and investments. Net cash used in investing activities primarily reflects capital expenditures and equity investments, which total $3,314 million in 2000, $3,085 million in 1999 and $3,564 million in 1998, and cash used for business acquisitions. See "Capital Expenditures and Equity Investments" below and see Note 2 to the Consolidated Financial Statements for cash used for business acquisitions. Partially offsetting these uses of cash were proceeds from sales of non-merchant assets, including certain equity instruments by Energy Services and an international power project, which totaled $494 million in 2000. Proceeds from non-merchant asset sales were $294 million in 1999 and \$239 million in 1998. Cash provided by financing activities in 2000 included proceeds from the issuance of subsidiary equity and the issuance of common stock related to employee benefit plans, partially offset by payments of dividends. Cash provided by financing activities in 1999 included proceeds from the net issuance of short- and long-term debt, the issuance of common stock and the issuance of subsidiary equity, partially offset by payments of dividends. Cash provided by financing activities in 1998 included proceeds from the net issuance of short- and long-term debt, the issuance of common stock and the sale of a minority interest in a subsidiary, partially offset by payments of dividends. Capital Expenditures and Equity Investments Capital expenditures by operating segment are as follows: TRIF Capital expenditures increased $18 million in 2000 and $458 million in 1999 as compared to the previous year. Capital expenditures in 2000 primarily relate to construction of power plants to extend Wholesale Services' network and fiber optic network infrastructure for Broadband Services. During 1999, Wholesale Services expenditures increased due primarily to construction of domestic and international power plants. The 1999 increase in Corporate and Other reflects the purchase of certain previously leased MTBE-related assets. Cash used for investments in equity affiliates by the operating segments is as follows: TABLE Equity investments in 2000 relate primarily to capital invested for the ongoing construction, by a joint venture, of a power plant in India as well as other international investments. Equity investments in 1999 relate primarily to an investment in a joint venture that holds gas distribution and related businesses in South Korea and the power plant project in India. The level of spending for capital expenditures and equity investments will vary depending upon conditions in the energy and broadband markets, related economic conditions and identified opportunities. Management expects that the capital spending program will be funded by a combination of internally generated funds, proceeds from dispositions of selected assets and shortand long-term borrowings. Working Capital At December 31, 2000, Enron had working capital of $2.0 billion. If a working capital deficit should occur, Enron has credit facilities in place to fund working capital requirements. At December 31, 2000, those credit lines provided for up to $4.2 billion of committed and uncommitted credit, of which $290 million was outstanding. Certain of the credit agreements contain prefunding covenants. However, such covenants are not expected to restrict Enron's access to funds under these agreements. In addition, Enron sells commercial paper and has agreements to sell trade accounts receivable, thus providing financing to meet seasonal working capital needs. Management believes that the sources of funding described above are sufficient to meet short- and long-term liquidity needs not met by cash flows from operations. CAPITALIZATION Total capitalization at December 31,2000 was $25.0 billion. Debt as a percentage of total capitalization increased to 40.9% FN (a) The average value presents a twelve month average of the month-end values. The high and low valuations for each market risk component represent the highest and lowest month-end value during 2000. (b) In 2000, increased natural gas prices combined with increased price volatility in power and gas markets caused Enron's value at risk to increase significantly. (c) Enron's equity trading market risk primarily relates to merchant investments (see Note 4 to the Consolidated Financial Statements). In 2000, the value at risk model utilized for equity trading market risk was refined to more closely correlate with the valuation methodologies used for merchant activities. (d) Includes only the risk related to the financial instruments that serve as hedges and does not include the related underlying hedged item. /TABLE Accounting Policies Accounting policies for price risk management and hedging activities are described in Note 1 to the Consolidated Financial Statements . INFORMATION REGARDING FORWARD-LOOKING STATEMENTS This Report includes forward-looking statements within the meaning of Section 27A of the Securities Act of 1933 and Section 21E of the Securities Exchange Act of 1934. All generally accepted in the United States. As discussed in Note 18 to the consolidated financial statements, Enron Corp. and subsidiaries changed its method of accounting for costs of start-up activities and its method of accounting for certain contracts involved in energy trading and risk management activities in the first quarter of 1999. Arthur Andersen LLP Houston, Texas February 23, 2001 PAGE TABLE ENRON CORP. AND SUBSIDIARIES CONSOLIDATED INCOME STATEMENT FN The accompanying notes are an integral part of these consolidated financial statements. TABLE PAGE TABLE ENRON CORP. AND SUBSIDIARIES CONSOLIDATED STATEMENT OF COMPREHENSIVE INCOME FN The accompanying notes are an integral part of these consolidated financial statements. / TABLE PAGE TABLE ENRON CORP. AND SUBSIDIARIES CONSOLIDATED BALANCE SHEET FN The accompanying notes are an integral part of these consolidated financial statements. / TABLE PAGE TABLE ENRON CORP. AND SUBSIDIARIES CONSOLIDATED BALANCE SHEET FN The accompanying notes are an integral part of these consolidated financial statements. TABLE PAGE TABLE ENRON CORP. AND SUBSIDIARIES CONSOLIDATED STATEMENT OF CASH FLOWS FN The accompanying notes are an integral part of these consolidated financial statements . / TABLE PAGE > TABLE ENRON CORP. AND SUBSIDIARIES CONSOLIDATED STATEMENT OF CHANGES IN SHAREHOLDERS' EQUITY FN The accompanying notes are an integral part of these consolidated financial statements. /TABLE PAGE ENRON CORP. AND SUBSIDIARIES NOTES TO THE CONSOLIDATED FINANCIAL STATEMENTS 1 SUMMARY OF SIGNIFICANT ACCOUNTING POLICIES Consolidation Policy and Use of Estimates. The accounting and financial reporting policies of Enron Corp. and its subsidiaries conform to generally accepted accounting principles and prevailing industry practices. The consolidated financial statements include the accounts of all subsidiaries controlled by Enron Corp. after the elimination of significant intercompany accounts and transactions. The preparation of financial statements in conformity with generally accepted accounting principles requires management to make estimates and assumptions that affect the reported amounts of assets and liabilities and disclosure of contingent assets and liabilities at the date of the financial statements and the reported amounts of revenues and expenses during the reporting period. Actual results could differ from those estimates. "Enron" is used from time to time herein as a collective reference to Enron Corp. and its subsidiaries and affiliates. The businesses of Enron are conducted by its subsidiaries and affiliates whose operations are managed by their respective officers. Cash Equivalents. Enron records as cash equivalents all stock and notes. Enron has accounted for these acquisitions using the purchase method of accounting as of the effective date of each transaction. Accordingly, the purchase price of each transaction has been allocated based upon the estimated fair value of the assets and liabilities acquired as of the acquisition date, with the excess reflected as goodwill in the Consolidated Balance Sheet. This and all other goodwill is being amortized on a straight-line basis over 5 to 40 years. Assets acquired, liabilities assumed and consideration paid as a result of businesses acquired were as follows: TABLE FN (a) Excludes amounts related to the 1998 acquisition of Elektro. /TABLE On November 8, 1999, Enron announced that it had entered into an agreement to sell Enron's wholly-owned electric utility subsidiary, Portland General Electric Company (PGE), to Sierra Pacific Resources for $2.1 billion. Sierra Pacific Resources will also assume approximately $1 billion in PGE debt and preferred stock. The transaction has been delayed by the effect of recent events in California and Nevada on the buyer. Enron's carrying amount of PGE as of December 31, 2000 was approximately $1.6 billion. Income before interest, minority interest and income taxes for PGE was $338 million, $298 million and $284 million for 2000, 1999 and 1998, respectively. 3 PRICE RISK MANAGEMENT ACTIVITIES AND FINANCIAL INSTRUMENTS Trading Activities. Enron offers price risk management services to wholesale, commercial and industrial customers through a variety of financial and other instruments including commodity contracts based on market prices totaling 8,169 TBtue, with terms extending up to 16 years, and 7.2 million metric tonnes, with terms extending up to 5 years. Notional amounts reflect the volume of transactions but do not represent the amounts exchanged by the parties to the financial instruments. Accordingly, notional amounts do not accurately measure Enron's exposure to market or credit risks. The maximum terms in years detailed above are not indicative of likely future cash flows as these positions may be offset in the markets at any time in response to the company's price risk management needs to the extent available in the market. The volumetric weighted average maturity of Enron's fixed price portfolio as of December 31, 2000 was approximately 1.5 years. Fair Value. The fair value as of December 31, 2000 and the average fair value of instruments related to price risk management activities held during the year are set forth below: TABLE APTION FN (a) Computed using the ending balance at each month-end. / TABLE The income before interest, taxes and certain unallocated expenses arising from price risk management activities for 2000 was $1,899 million. Securitizations. From time to time, Enron sells interests in certain of its financial assets. Some of these sales are completed in securitizations, in which Enron concurrently enters into swaps associated with the underlying assets which limits the risks assumed by the purchaser. Such swaps are adjusted to fair value using quoted market prices, if available, or estimated fair value based on management's best estimate of the present value of future cash flow. These swaps are included in Price Risk Management activities above as equity investments. During 2000, gains from sales representing securitizations were $381 million and proceeds were $2,379 million (\$545 million of the proceeds related to sales to Whitewing Associates, L.P. (Whitewing)). See Notes 4 and 9. Purchases of securitized merchant financial assets totaled \$1,184 million during 2000. Amounts primarily related to equity interests. Credit Risk. In conjunction with the valuation of its financial instruments, Enron provides reserves for credit risks associated with such activity. Credit risk relates to the risk of loss that Enron would incur as a result of nonperformance by counterparties pursuant to the terms of their contractual obligations. Enron maintains credit policies with regard to its counterparties that management believes significantly minimize overall credit risk. These policies include an evaluation of potential counterparties' financial condition (including credit rating), collateral requirements under certain circumstances and the use of standardized agreements which allow for the netting of positive and negative exposures associated with a single counterparty. Enron also minimizes this credit exposure using monetization of its contract portfolio or third-party insurance contracts. The counterparties associated with assets from price risk management activities as of December 31, 2000 and 1999 are summarized as follows: Total $690$1,273 FN (a) Investments are recorded at fair value in "Other Assets" with changes in fair value reflected in "Other Revenues." (b) Amounts represent Enron's investment in unconsolidated equity affiliates with operating earnings reflected in "Equity in Earnings of Unconsolidated Equity Affiliates." / TABLE Enron provides capital primarily to energy and technology-related businesses seeking debt or equity financing. The merchant investments made by Enron and certain of its unconsolidated affiliates (see Note 9) are carried at fair value and include public and private equity, government securities with maturities of more than 90 days, debt and interests in limited partnerships. The valuation methodologies utilize market values of publicly-traded securities, independent appraisals and cash flow analyses. Also included in Enron's wholesale business are investments in merchant assets such as power plants and natural gas pipelines, primarily held through equity method investments. Some of these assets were developed, constructed and operated by Enron. The merchant assets are not expected to be long-term, integrated components of Enron's energy networks. For the years ended December 31, 2000, 1999 and 1998, respectively, pre-tax gains from sales of merchant assets and investments totaling $104 million, $756 million and $628 million are included in "Other Revenues," and proceeds were $1,838 million, \$2,217 million and \$1,434 million. 5 INCOME TAXES The components of income before income taxes are as follows: FN (a) See Note 11 for tax benefits related to stock options exercised by employees reflected in shareholders' equity / TABLE The differences between taxes computed at the U.S. federal statutory tax rate and Enron's effective income tax rate are as follows : TABLE CAPTION> The principal components of Enron's net deferred income tax liability are as follows: TABLE 6 SUPPLEMENTAL CASH FLOW INFORMATION Cash paid for income taxes and interest expense, including fees incurred on sales of accounts receivable, is as follows: TABLE FN (a) Includes $138 million and $118 million in other current liabilities for 2000 and 1999 , respectively. TABLE Enron has an alternative minimum tax (AMT) credit carryforward of approximately $254 million which can be used to offset regular income taxes payable in future years. The AMT credit has an indefinite carryforward period. Enron has a net operating loss carryforward applicable to U.S. subsidiaries of approximately $65 million, which will begin to expire in 2011. Enron has a net operating loss carryforward applicable to non-U.S. subsidiaries of approximately $1.2 billion, of which $1.0 billion can be carried forward indefinitely. The remaining $200 million expires between the years 2001 and 2010. Deferred tax assets have been recognized on the $65million domestic loss and $1.0 billion of the foreign losses. U.S. and foreign income taxes have been provided for earnings of foreign subsidiary companies that are expected to be remitted to the U.S. Foreign subsidiaries' cumulative undistributed earnings of approximately $1.8 billion are considered to be permanently reinvested outside the U.S. and, accordingly, no U.S. income taxes have been provided thereon. In the event of a distribution of those earnings in the form of dividends, Enron may be subject to both foreign withholding taxes and U.S. income taxes net of allowable foreign tax credits. Non-Cash Activity. In 2000, Enron acquired all minority shareholders' interests in Enron Energy Services, LLC and other businesses with Enron common stock. See Note 2 . In 2000 and 1999, Enron entered into various transactions with related parties, which resulted in an exchange of assets and an increase in common stock of $171 million in 2000. See Note 16. In 2000, a partnership in which Enron was a limited partner made a liquidating distribution to Enron resulting in a non-cash increase in current assets of $220 million, a decrease of $20 million in non-current assets and an increase in current liabilities of $160 million. During 2000 and 1999, Enron received the rights to specific third-party fiber optic cable in exchange for the rights on specific fiber optic cable held for sale by Enron. These exchanges resulted in non-cash increases in assets of $69 million and $111 million, respectively. During 1999, Enron issued approximately 7.6 million shares of common stock in connection with the acquisition, by an unconsolidated equity affiliate, of interests in three power plants in New Jersey. In December 1998, Enron extinguished its 6.25\% Exchangeable Notes with 10.5 million shares of EOG common stock. 7 CREDIT FACILITIES AND DEBT Enron has credit facilities with domestic and foreign banks which provide for an aggregate of $1.4 billion in long-term committed credit, of which $150 million relates to Portland General, and $2.4 billion in short-term committed credit. Expiration dates of the committed facilities range from February 2001 to May 2005. Interest rates on borrowings are based upon the London Interbank offered Rate, certificate of deposit rates or other short-term interest rates. Certain credit facilities contain covenants which must be met to borrow funds. Such debt covenants are not anticipated to materially restrict Enron's ability to borrow funds under such facilities. Compensating balances are not required, but Enron is required to pay a commitment or facility fee. At December 31, 2000, \$290 million was outstanding under these facilities. Enron has also entered into agreements which provide for uncommitted lines of credit totaling $420 million at December 31, 2000. The uncommitted lines have no stated expiration dates. Neither compensating balances nor commitment fees are required, as borrowings under the uncommitted credit lines are available subject to agreement by the participating banks. At December 31, 2000, no amounts were outstanding under the uncommitted lines. In addition to borrowing from banks on a short-term basis, Enron and certain of its subsidiaries sell commercial paper to provide financing for various corporate purposes. As of December 31,2000 and 1999, short-term borrowings of $15 million and $330 million, respectively, and long-term debt due within one year of $1,303 million and $670 million, respectively, have been reclassified as long-term debt based upon the availability of committed credit facilities with expiration dates exceeding one year and management's intent to maintain such amounts in excess of one year. Weighted average interest rates on short-term debt outstanding at December 31, 2000 and 1999 were 6.9% and 6.4%, respectively. Detailed information on long-term debt is as follows: FN (a) Includes debt denominated in foreign currencies of approximately $955 million and $525 million, respectively, at December 31, 2000 and 1999. Enron has entered into derivative transactions to hedge interest rates and foreign currency exchange fluctuations associated with such debt. See Note 3. / TABLE The indenture securing Portland General's First Mortgage Bonds constitutes a direct first mortgage lien on substantially all electric utility property and franchises, other than expressly excepted property. The aggregate annual maturities of long-term debt outstanding at December 31,2000 were $2,112 million, $750 million, $852 million, $646 million and $1,592 million for 2001 through 2005 , respectively. In February 2001, Enron issued $1.25 billion zero coupon convertible senior notes that mature in 2021 . The notes carry a 2.125 percent yield to maturity with an aggregate face value of $1.9 billion and may be converted, upon certain contingencies being met, into Enron common stock at an initial conversion premium of 45 percent. 8 MINORITY INTERESTS Enron's minority interests at December 31, 2000 and 1999 include the following: TABLE> CAPTION> (In millions) S> 2000 1999 Majority-owned limited liability C totaling $1,823 million and $1,128 million, respectively, at December 31,2000 and 1999. (c) At December 31, 2000 and 1999, the unamortized excess of Enron's investment in unconsolidated affiliates was $182 million and $179 million, respectively, which is being amortized over the expected lives of the investments. /TABLE Enron's equity in earnings (losses) of unconsolidated equity affiliates is as follows: FN (a) Includes $410million and $327million receivable from Enron and $302 million and $84 million payable to Enron at December 31,2000 and 1999, respectively. /TABLE TABLE TARILV FN (a) During the fourth quarter of 2000, Azurix Corp. (Azurix) impaired the carrying value of its Argentine assets, resulting in a charge of approximately $470 million. Enron's portion of the charge was $326 million. / TABLE Summarized combined financial information of Enron's unconsolidated affiliates is presented below: TABLE FN (a) Enron recognized revenues from transactions with unconsolidated equity affiliates of $510 million in 2000, $674 million in 1999 and $563 million in 1998. / TABLE In 2000 and 1999, Enron sold approximately $632 million and $192 million, respectively, of merchant investments and other assets to Whitewing. Enron recognized no gains or losses in connection with these transactions. Additionally, in 2000, ECT Merchant Investments Corp., a wholly-owned Enron subsidiary, contributed two pools of merchant investments to a limited partnership that is a subsidiary of Enron. Subsequent to the contributions, the partnership issued partnership interests representing 100% of the beneficial, economic interests in the two asset pools, and such interests were sold for a total of $545 million to a limited liability company that is a subsidiary of Whitewing. See Note 3. These entities are separate legal entities from Enron and have separate assets and liabilities. In 2000 and 1999, the Related Party, as described in Note 16, contributed $33 million and $15 million, respectively, of equity to Whitewing. In 2000, Whitewing contributed $7.1 million to a partnership formed by Enron, Whitewing and a third party. Subsequently, Enron sold a portion of its interest in the partnership through a securitization. See Note 3. In 2000, The New Power Company sold warrants convertible into common stock of The New Power Company for $50 million to the Related Party (described in Note 16). 7.39\% Preferred Stock (150 shares)(a)(c) Enron Capital Resources, L.P. 9\% Cumulative Preferred Securities, Series A (3,000,000 preferred securities)(a) Other FN (a) Redeemable under certain circumstances after specified dates. (b) Initial rate is 6.74% increasing to 7.79%. (c) Mandatorily redeemable in 2006 . / TABLE 11 COMMON STOCK Earnings Per Share. The computation of basic and diluted earnings per share is as follows: TABLE ICADTTANI 15 15 100,000 25 FN (a) The Series A Preferred Stock and the Series B Preferred Stock were not included in the calculation of diluted earnings per share because conversion of these shares would be antidilutive. / TABLE Derivative Instruments. At December 31, 2000, Enron had derivative instruments (excluding amounts disclosed in Note 10) on 54.8 million shares of Enron common stock, of which approximately 12 million shares are with JEDI and 22.5 million shares are with related parties (see Note 16), at an average price of $67.92 per share on which Enron was a fixed price payor. Shares potentially deliverable to counterparties under the contracts are assumed to be outstanding in calculating diluted earnings per share unless they are antidilutive. At December 31, 2000 , there were outstanding non-employee options to purchase 6.4 million shares of Enron common stock at an exercise price of $19.59 per share. Stock Option Plans. Enron applies Accounting Principles Board (APB) Opinion 25 and related interpretations in accounting for ; For measurement purposes, 6% and 10% annual rates of increase in the per capita cost of covered health care benefits were assumed for the period 2000 to 2001 for the Enron and Portland General postretirement plans, respectively. The rates were assumed to decrease to 5% by 2002 and 2010 for the Enron and Portland General postretirement plans, respectively. Assumed health care cost trend rates have a significant effect on the amounts reported for the health care plans. A one-percentage point change in assumed health care cost trend rates would have the following effects: TABLE FN (a) Represents one-time nonrecurring events including the exchange and sale of EOG (see Note 2) and certain employees ceasing participation in the Portland General Plan as a result of union negotiations (b) Includes plan assets of the ESOP of $116million and $121 million at December 31,2000 and 1999, respectively. (c) Long-term rate of return on assets is assumed to be 10.5% for the Enron Plan, 9.0\% for the Portland General Plan and 9.5% for the EFS Plan. (d) Long-term rate of return on assets is assumed to be 7.5% for the Enron assets and 9.5% for the Portland General assets. (e) Rate of compensation increase is assumed to be 4.0% for the Enron Plan, 4.0% to 9.5% for the Portland General Plan and 5.0% for the EFS Plan. /TABLE Included in the above amounts are the unfunded obligations for the supplemental executive retirement plans. At both December 31 , 2000 and 1999, the projected benefit obligation for these unfunded plans was $56 million and the fair value of assets was \$1 million. The measurement date of the Enron Plan and the ESOP is September 30 , and the measurement date of the Portland General Plan, the EFS Plan and the postretirement benefit plans is December 31. The funded status as of the valuation date of the Enron Plan, the Portland General Plan, the ESOP and the postretirement benefit plans reconciles with the amount detailed above which is included in "Other Assets" on the Consolidated Balance sheet. electric utility operations' net regulatory assets wer $450 million and $494 million at December 31,2000 and 1999 , respectively. Based on rates in place at December 31, 2000, ENRON CORP. AND SUBSIDIARIES SCHEDULE II - VALUATION AND QUALIFYING ACCOUNTS FOR THE YEARS ENDED DECEMBER 31, 2000, 1999 AND 1998 FN (a) Unaffiliated revenues include sales to unconsolidated equity affiliates. (b) Intersegment sales are made at prices comparable to those received from unaffiliated customers and in some instances are affected by regulatory considerations. (c) Reflects results through August 16, 1999. See Note 2. (d) Includes consolidating eliminations. PAGE REPORT OF INDEPENDENT PUBLIC ACCOUNTANTS ON FINANCIAL STATEMENT SCHEDULE To the Shareholders and Board of Directors of Enron Corp.: We have audited in accordance with generally accepted auditing standards, the consolidated financial statements of Enron Corp. and subsidiaries included in this Form 10-K and have issued our report thereon dated February 23, 2001. Our audit was made for the purpose of forming an opinion on the basic financial statements taken as a whole. The schedule listed in Item 14(a)2 is the responsibility of the company's management and is presented for purposes of complying with the Securities and Exchange Commission's rules and is not part of the basic financial statements. This schedule has been subjected to the auditing procedures applied in the audit of the basic financial statements and, in our opinion, fairly states in all material respects the financial data required to be set forth therein in relation to the basic financial statements taken as a whole. Arthur Andersen LLP Houston, Texas February 23, 2001 Sriv (a) Primarily consists of allowance for doubtful accounts and reserve for insurance claims and losses. / TABLE direct interaction. Wholesale Services markets, transports and provides energy commodities as reflected in the following table (including intercompany amounts): TABLE (BBtue/d) 196,148 99,337 75,266 FN (a) Billion British thermal units equivalent per day. (b) Includes third-party transactions by Enron Energy Services. (c) Represents electricity volumes marketed, converted to BBtue/d. /TABLE During 2000, Wholesale Services strengthened its position in the deregulated North American gas markets and deregulating power markets. Enron also continued to expand its presence in Europe, particularly on the Continent where wholesale markets began deregulation in early 1999. New product offerings in coal, metals, steel and pulp and paper markets also added favorably to the results. Assets and Investments. Wholesale Services' businesses make investments in various energy and certain related claims, either taken individually or in the aggregate, will have a material impact on Enron's financial position or results of operations. Item 4. SUBMISSION OF MATTERS TO A VOTE OF SECURITY HOLDERS None. PAGE PART II Item 5. MARKET FOR THE REGISTRANT'S COMMON EQUITY AND RELATED SHAREHOLDER MATTERS Common Stock The following table indicates the high and low sales prices for the common stock of Enron as reported on the New York Stock Exchange (consolidated transactions reporting system), the principal market in which the securities are traded, and dividends paid per share for the calendar quarters indicated. The common stock is also listed for trading on the Chicago Stock Exchange and the Pacific Stock Exchange, as well as The London Stock Exchange and Frankfurt Stock Exchange. TABLE Cumulative Second Preferred Convertible Stock The following table indicates the high and low sales prices for the Cumulative Second Preferred Convertible Stock ("Second Preferred Stock") of Enron as reported on the New York Stock Exchange (consolidated transactions reporting system), the principal market in which the securities are traded, and dividends paid per share for the calendar quarters indicated. The Second Preferred Stock is also listed for trading on the Chicago Stock Exchange. TABLE At December 31, 2000, there were approximately 58,920 record holders of common stock and 160 record holders of Second Preferred Stock. Other information required by this item is set forth under Item 6 -- "Selected Financial Data (Unaudited) Common Stock Statistics" for the years 1996-2000. PAGE TABLE ITEM 6. SELECTED FINANCIAL DATA (UNAUDITED) (a) Share and per share amounts have been restated to reflect the two-for-one stock split effective August 13, 1999. / TABLE PAGE ITEM 7. MANAGEMENT'S DISCUSSION AND ANALYSIS OF FINANCIAL CONDITION AND RESULTS OF OPERATIONS The following review of the results of operations and financial condition of Enron Corp. and its subsidiaries and affiliates (Enron) should be read in conjunction with the Consolidated Financial Statements. RESULTS OF OPERATIONS Consolidated Net Income Enron's net income for 2000 was $979 million compared to $893 million in 1999 and $703 million in 1998. Items impacting comparability are discussed in the respective segment results. Net income before items impacting comparability was $1,266 million, $957 million and $698 million, respectively, in 2000 , 1999 and 1998. Enron's business is divided into five segments and Exploration and Production (Enron Oil \& Gas Company) through August 16, 1999 (see Note 2 to the Consolidated Financial Statements). Enron's operating segments include: Transportation and Distribution. Transportation and Distribution consists of Enron Transportation Services and Portland General. Transportation Services includes Enron's interstate natural gas pipelines, primarily Northern Natural Gas Company (Northern), Transwestern Pipeline Company (Transwestern), Enron's 50% interest in Florida Gas Transmission Company (Florida Gas) and Enron's interests in Northern Border Partners, L.P. and EOTT Energy Partners, L.P. (EOTT). Wholesale Services. Wholesale Services includes Enron's wholesale businesses around the world. Wholesale Services operates in developed markets such as North America and Europe, as well as developing or newly deregulating markets including South America, India and Japan. Retail Energy Services. Enron, through its subsidiary Enron Energy Services, LLC (Energy Services), is extending its energy expertise and capabilities to end-use retail customers in the industrial and commercial business sectors to manage their energy requirements and reduce their total energy costs. Broadband Services. Enron's broadband services business (Broadband Services) provides customers with a single source for broadband services, including bandwidth intermediation and the delivery of premium content. Corporate and Other. Corporate and Other includes Enron's investment in Azurix Corp. (Azurix), which provides water and wastewater services, results of Enron Renewable Energy Corp. (EREC), which develops and constructs wind-generated power projects, and the operations of Enron's methanol and MTBE plants as well as overall corporate activities of Enron. FN (a) Tax affected at 35%, except where a specific tax rate applied. /TABLE Diluted earnings per share of common stock were as follows: TABLE FN (a) Restated to reflect the two-for-one stock split effective August 13, 1999. / TABLE Income Before Interest, Minority Interests and Income Taxes The following table presents income before interest, minority interests and income taxes (IBIT) for each of Enron's operating segments (see Note 20 to the Consolidated Financial Statements): TABLE Transportation and Distribution Transportation Services. The following table summarizes total volumes transported by each of Enron's interstate natural gas pipelines. FN (a) Billion British thermal units per day. Amounts reflect 100% of each entity's throughput volumes. Florida Gas and Northern Border Pipeline are unconsolidated equity affiliates. /TABLE Significant components of IBIT are as follows: TABLE CAPTION ITn mil1innel Dana 10001000 Net Revenues Revenues, net of cost of sales, of Transportation Services increased $24 million (4\%) during 2000 and declined $14 million (2\%) during 1999 as compared to 1998. In 2000, Transportation Services' interstate pipelines produced strong financial results. The volumes transported by Transwestern increased 13 percent in 2000 as compared to 1999. Northern's 2000 gross margin was comparable to 1999 despStep by Step Solution
There are 3 Steps involved in it
Step: 1

Get Instant Access to Expert-Tailored Solutions
See step-by-step solutions with expert insights and AI powered tools for academic success
Step: 2

Step: 3

Ace Your Homework with AI
Get the answers you need in no time with our AI-driven, step-by-step assistance
Get Started


