Question
Region Counting: Write a program to binarize a gray-level image based on the assumption that the image has a bimodal histogram. You are to implement
Region Counting:
Write a program to binarize a gray-level image based on the assumption that the image has a bimodal histogram. You are to implement the Otsu's thresholding method to estimate the optimal threshold required to binarize the image. Compute Intra-class variance using various thresholds and choose the one that minimizes this value. Your code should report both the binarized image and the optimal threshold value. Also assume that foreground objects are darker than background objects in the input gray-level image.
- Starter code available in directory region_analysis/
- region_analysis/binary_image.py:
- compute_histogram: write your code to compute the histogram in this function, If you return a list it will automatically save the graph in output folder
- find_otsu_threshold: Write your code to compute the optimal threshold using Otsu's method.
- binarize: write your code to threshold the input image to create a binary image here. This function should return a binary image which will automatically be saved in output folder. For visualization one can use intensity value of 255 instead of 0 in the binay image and and 0 instead of 1 in binay images. That way the objects appear black over white background
class BinaryImage: def __init__(self): pass
def compute_histogram(self, image): """Computes the histogram of the input image takes as input: image: a grey scale image returns a histogram as a list"""
hist = [0]*256
return hist
def find_otsu_threshold(self, hist): """analyses a histogram to find the otsu's threshold assuming that the input histogram is bimodal. takes as input hist: a histogram returns: an optimal threshold value (otsu's threshold)"""
threshold = 0
return threshold
def binarize(self, image): """Comptues the binary image of the the input image based on histogram analysis and thresholding Make calls to the compute_histogram and find_otsu_threshold methods as needed. take as input image: an grey scale image returns: a binary image"""
bin_img = image.copy()
return bin_img
Do not use any in-built functions from opencv and numpy. In general, you can use function from math library. Functions allowed for this part are: np.array(), np.matrix(), np.zeros(), np.ones(), cv2.imread(), cv2.namedWindow(), cv2.waitKey().
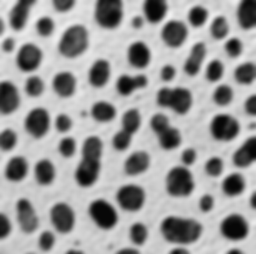
- image is provided for testing: cells.png

Step by Step Solution
There are 3 Steps involved in it
Step: 1

Get Instant Access to Expert-Tailored Solutions
See step-by-step solutions with expert insights and AI powered tools for academic success
Step: 2

Step: 3

Ace Your Homework with AI
Get the answers you need in no time with our AI-driven, step-by-step assistance
Get Started


