Regress excess Exxon returns on the excess SPDR S&P 500 Index ETF returns. What is Exxons alpha? Enter your answer rounded to two decimal places. Do not enter % in the answer box. For example, if your answer is 0.12345 or 12.345% then enter as 12.35 in the answer box.
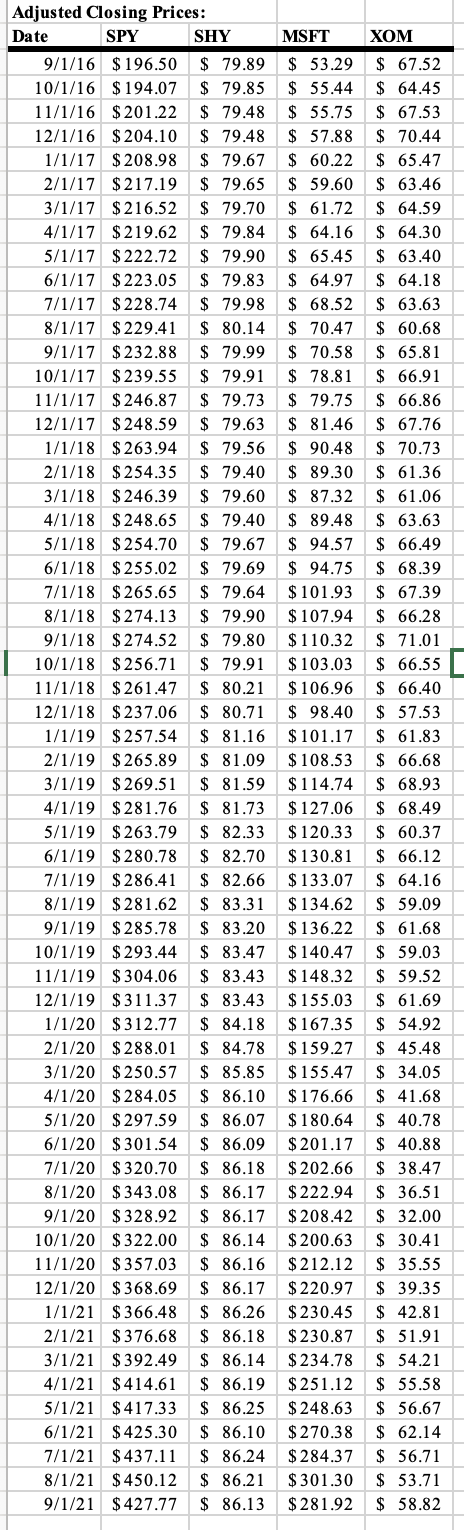
MSFT XOM Adjusted Closing Prices: Date SPY SHY 9/1/16 $196.50 $ 79.89 10/1/16 $194.07 $ 79.85 11/1/16 $201.22 $ 79.48 12/1/16 $204.10 $ 79.48 1/1/17 $ 208.98 $ 79.67 2/1/17 $ 217.19 $ 79.65 3/1/17 $216.52 $ 79.70 4/1/17 $219.62 $ 79.84 5/1/17 $ 222.72 $ 79.90 6/1/17 $223.05 $ 79.83 7/1/17 $228.74 $ 79.98 8/1/17 $ 229.41 $ 80.14 9/1/17 $232.88 $ 79.99 10/1/17 $ 239.55 $ 79.91 11/1/17 $ 246.87 $ 79.73 12/1/17 $ 248.59 $ 79.63 1/1/18 $263.94 $ 79.56 2/1/18 $254.35 $ 79.40 3/1/18 $ 246.39 $ 79.60 4/1/18 $ 248.65 $ 79.40 5/1/18 $254.70 $ 79.67 6/1/18 $255.02 $ 79.69 7/1/18 $265.65 $ 79.64 8/1/18 $274.13 $ 79.90 9/1/18 $ 274.52 $ 79.80 10/1/18 $256.71 $ 79.91 11/1/18 $261.47 $ 80.21 12/1/18 $ 237.06 $ 80.71 1/1/19 $257.54 $ 81.16 2/1/19 $265.89 $ 81.09 3/1/19 $ 269.51 $ 81.59 4/1/19 $281.76 $ 81.73 5/1/19 $ 263.79 $ 82.33 6/1/19 $280.78 $ 82.70 7/1/19 $286.41 $ 82.66 8/1/19 $281.62 $ 83.31 9/1/19 $285.78 $ 83.20 10/1/19 $293.44 $ 83.47 11/1/19 $ 304.06 $ 83.43 12/1/19 $311.37 $ 83.43 1/1/20 $312.77 $ 84.18 2/1/20 $288.01 $ 84.78 3/1/20 $250.57 $ 85.85 4/1/20 $284.05 $ 86.10 5/1/20 $ 297.59 $ 86.07 6/1/20 $ 301.54 $ 86.09 7/1/20 $320.70 $ 86.18 8/1/20 $343.08 $ 86.17 9/1/20 $328.92 $ 86.17 10/1/20 $322.00 $ 86.14 11/1/20 $ 357.03 $ 86.16 12/1/20 $368.69 $ 86.17 1/1/21 $ 366.48 $ 86.26 2/1/21 $376.68 $ 86.18 3/1/21 $392.49 $ 86.14 4/1/21 $ 414.61 $ 86.19 5/1/21 $ 417.33 $ 86.25 6/1/21 $425.30 $ 86.10 7/1/21 $ 437.11 $ 86.24 8/1/21 $ 450.12 $ 86.21 9/1/21 $427.77 $ 86.13 $ 53.29 $ 55.44 $ 55.75 $ 57.88 $ 60.22 $ 59.60 $ 61.72 $ 64.16 $ 65.45 $ 64.97 $ 68.52 $ 70.47 $ 70.58 $ 78.81 $ 79.75 $ 81.46 $ 90.48 $ 89.30 $ 87.32 $ 89.48 $ 94.57 $ 94.75 $ 101.93 $107.94 $110.32 $ 103.03 $ 106.96 $ 98.40 $ 101.17 $ 108.53 $ 114.74 $ 127.06 $ 120.33 $ 130.81 $133.07 $ 134.62 $136.22 $140.47 $ 148.32 $155.03 $167.35 $159.27 $155.47 $ 176.66 $ 180.64 $201.17 $ 202.66 $ 222.94 $ 208.42 $200.63 $212.12 $ 220.97 $ 230.45 $ 230.87 $ 234.78 $ 251.12 $ 248.63 $ 270.38 $ 284.37 $ 301.30 $281.92 $ 67.52 $ 64.45 $ 67.53 $ 70.44 $ 65.47 $ 63.46 $ 64.59 $ 64.30 $ 63.40 $ 64.18 $ 63.63 $ 60.68 $ 65.81 $ 66.91 $ 66.86 $ 67.76 $ 70.73 $ 61.36 $ 61.06 $ 63.63 $ 66.49 $ 68.39 $ 67.39 $ 66.28 $ 71.01 $ 66.55 $ 66.40 $ 57.53 $ 61.83 $ 66.68 $ 68.93 $ 68.49 $ 60.37 $ 66.12 $ 64.16 $ 59.09 $ 61.68 $ 59.03 $ 59.52 $ 61.69 $ 54.92 $ 45.48 $ 34.05 $ 41.68 $ 40.78 $ 40.88 $ 38.47 $ 36.51 $ 32.00 $ 30.41 $ 35.55 $ 39.35 $ 42.81 $ 51.91 $ 54.21 $ 55.58 $ 56.67 $ 62.14 $ 56.71 $ 53.71 $ 58.82 MSFT XOM Adjusted Closing Prices: Date SPY SHY 9/1/16 $196.50 $ 79.89 10/1/16 $194.07 $ 79.85 11/1/16 $201.22 $ 79.48 12/1/16 $204.10 $ 79.48 1/1/17 $ 208.98 $ 79.67 2/1/17 $ 217.19 $ 79.65 3/1/17 $216.52 $ 79.70 4/1/17 $219.62 $ 79.84 5/1/17 $ 222.72 $ 79.90 6/1/17 $223.05 $ 79.83 7/1/17 $228.74 $ 79.98 8/1/17 $ 229.41 $ 80.14 9/1/17 $232.88 $ 79.99 10/1/17 $ 239.55 $ 79.91 11/1/17 $ 246.87 $ 79.73 12/1/17 $ 248.59 $ 79.63 1/1/18 $263.94 $ 79.56 2/1/18 $254.35 $ 79.40 3/1/18 $ 246.39 $ 79.60 4/1/18 $ 248.65 $ 79.40 5/1/18 $254.70 $ 79.67 6/1/18 $255.02 $ 79.69 7/1/18 $265.65 $ 79.64 8/1/18 $274.13 $ 79.90 9/1/18 $ 274.52 $ 79.80 10/1/18 $256.71 $ 79.91 11/1/18 $261.47 $ 80.21 12/1/18 $ 237.06 $ 80.71 1/1/19 $257.54 $ 81.16 2/1/19 $265.89 $ 81.09 3/1/19 $ 269.51 $ 81.59 4/1/19 $281.76 $ 81.73 5/1/19 $ 263.79 $ 82.33 6/1/19 $280.78 $ 82.70 7/1/19 $286.41 $ 82.66 8/1/19 $281.62 $ 83.31 9/1/19 $285.78 $ 83.20 10/1/19 $293.44 $ 83.47 11/1/19 $ 304.06 $ 83.43 12/1/19 $311.37 $ 83.43 1/1/20 $312.77 $ 84.18 2/1/20 $288.01 $ 84.78 3/1/20 $250.57 $ 85.85 4/1/20 $284.05 $ 86.10 5/1/20 $ 297.59 $ 86.07 6/1/20 $ 301.54 $ 86.09 7/1/20 $320.70 $ 86.18 8/1/20 $343.08 $ 86.17 9/1/20 $328.92 $ 86.17 10/1/20 $322.00 $ 86.14 11/1/20 $ 357.03 $ 86.16 12/1/20 $368.69 $ 86.17 1/1/21 $ 366.48 $ 86.26 2/1/21 $376.68 $ 86.18 3/1/21 $392.49 $ 86.14 4/1/21 $ 414.61 $ 86.19 5/1/21 $ 417.33 $ 86.25 6/1/21 $425.30 $ 86.10 7/1/21 $ 437.11 $ 86.24 8/1/21 $ 450.12 $ 86.21 9/1/21 $427.77 $ 86.13 $ 53.29 $ 55.44 $ 55.75 $ 57.88 $ 60.22 $ 59.60 $ 61.72 $ 64.16 $ 65.45 $ 64.97 $ 68.52 $ 70.47 $ 70.58 $ 78.81 $ 79.75 $ 81.46 $ 90.48 $ 89.30 $ 87.32 $ 89.48 $ 94.57 $ 94.75 $ 101.93 $107.94 $110.32 $ 103.03 $ 106.96 $ 98.40 $ 101.17 $ 108.53 $ 114.74 $ 127.06 $ 120.33 $ 130.81 $133.07 $ 134.62 $136.22 $140.47 $ 148.32 $155.03 $167.35 $159.27 $155.47 $ 176.66 $ 180.64 $201.17 $ 202.66 $ 222.94 $ 208.42 $200.63 $212.12 $ 220.97 $ 230.45 $ 230.87 $ 234.78 $ 251.12 $ 248.63 $ 270.38 $ 284.37 $ 301.30 $281.92 $ 67.52 $ 64.45 $ 67.53 $ 70.44 $ 65.47 $ 63.46 $ 64.59 $ 64.30 $ 63.40 $ 64.18 $ 63.63 $ 60.68 $ 65.81 $ 66.91 $ 66.86 $ 67.76 $ 70.73 $ 61.36 $ 61.06 $ 63.63 $ 66.49 $ 68.39 $ 67.39 $ 66.28 $ 71.01 $ 66.55 $ 66.40 $ 57.53 $ 61.83 $ 66.68 $ 68.93 $ 68.49 $ 60.37 $ 66.12 $ 64.16 $ 59.09 $ 61.68 $ 59.03 $ 59.52 $ 61.69 $ 54.92 $ 45.48 $ 34.05 $ 41.68 $ 40.78 $ 40.88 $ 38.47 $ 36.51 $ 32.00 $ 30.41 $ 35.55 $ 39.35 $ 42.81 $ 51.91 $ 54.21 $ 55.58 $ 56.67 $ 62.14 $ 56.71 $ 53.71 $ 58.82