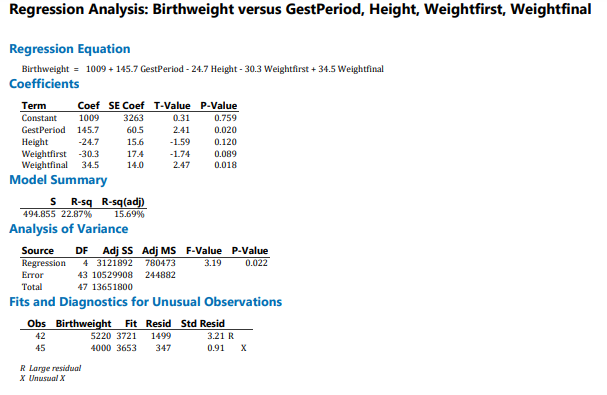
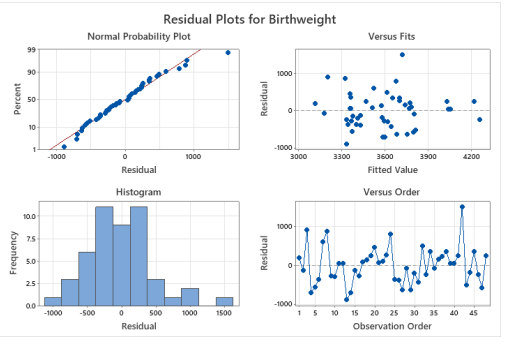
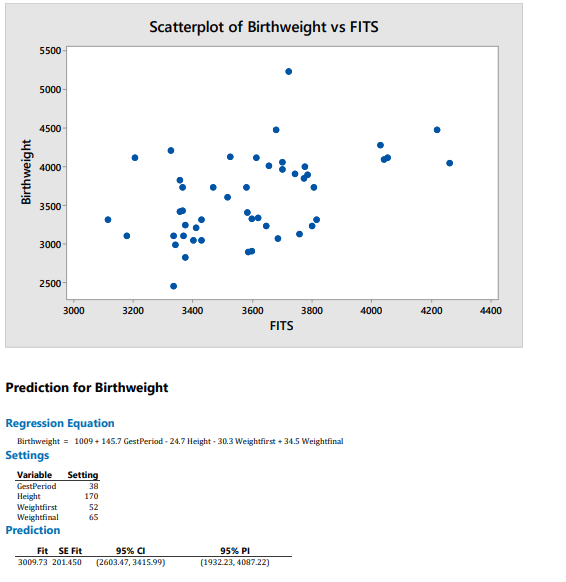
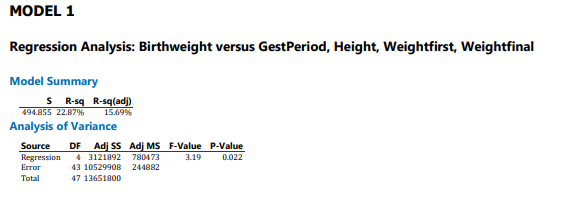
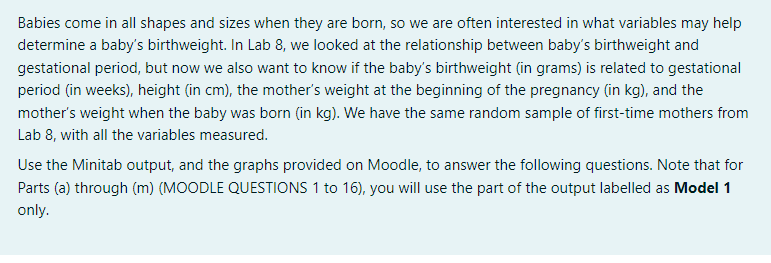
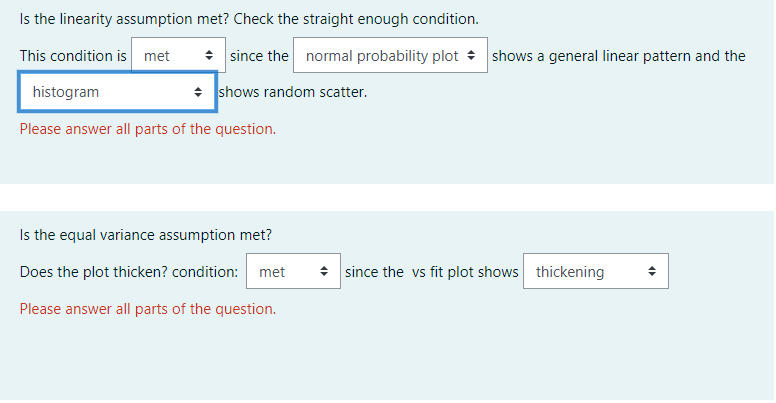
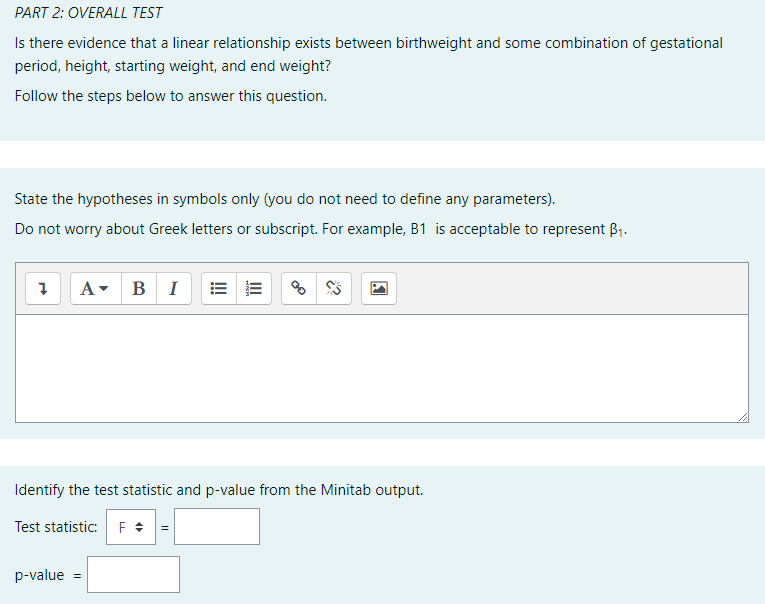
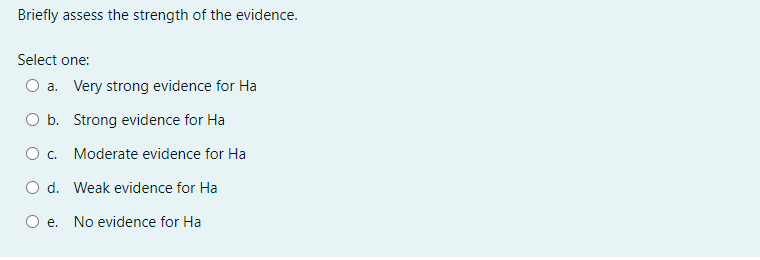
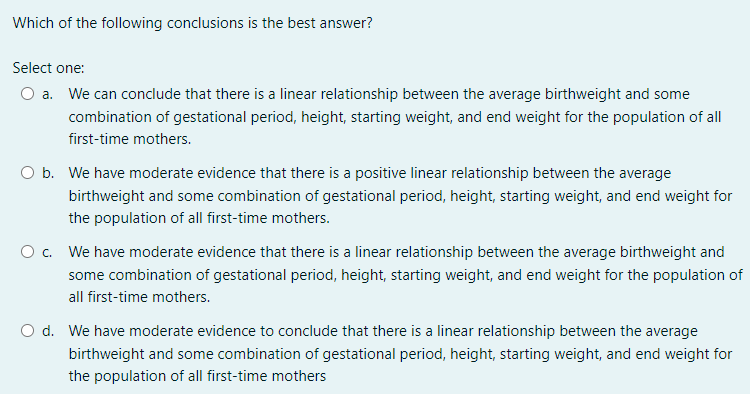
Regression Analysis: Birthweight versus GestPeriod, Height, Weightfirst, Weightfinal Regression Equation Birthweight = 1009 + 145.7 GestPeriod - 24.7 Height - 30.3 Weightfirst + 34.5 Weightfinal Coefficients Term Coef SE Coef T-Value P-Value Constant 1009 3263 0.31 0.759 Gest Period 145.7 60.5 2.41 0.020 Height -24.7 15.6 -1.59 0.120 Weightfirst -30.3 17/4 -1.74 0.089 Weightfinal 345 140 247 0.018 Model Summary S R-sq R-sq(adj) 494.855 22.87% 15.69% Analysis of Variance Source DF Adj SS Adj MS F-Value P-Value Regression 4 3121892 780473 3.19 0.022 Error 43 10529908 244882 Total 47 13651800 Fits and Diagnostics for Unusual Observations Obs Birthweight Fit Resid Std Resid 42 5220 3721 1499 3.21 R 45 4000 3653 347 0.91 X R Large residual X Unusual XResidual Plots for Birthweight Normal Probability Plot Versus Fits 99 90 1000 Residual Percent 50 10 10 00 -1000 1000 3000 OOEE 3:600 3900 4200 Residual Fitted Value Histogram Versus Order 10.0 1000 7.5 Residual Frequency 5.0 25 -1050 -1060 -500 500 1000 1500 1 10 15 20 25 20 35 40 45 Residual Observation Order\fMODEL 1 Regression Analysis: Birthweight versus GestPeriod, Height, Weightfirst, Weightfinal Model Summary 5 R-sq R-sqlad]) 494.855 22.87% 15.69% Analysis of Variance Source DF Adj $5 Adj MS F-Value P-Value Regression 3121892 ELIOBL 3.19 0.022 Error 43 10529908 244882 Total 47 13651800Elabies come in all shapes and sizes when they are born, so we are often interested in what variables may help determine a baby's birthweight. In Lab 8, we looked at the relationship between baby's birthweight and gestational pedod, but now we also want to know if the baby's birthweight {in grams] is related to gestational period {in weeks}, height [in cm}, the mother's weight at the beginning of the pregnancy {in kg]. and the mother's weight when the baby was born {in kg}. We have the same random sample of rsttime mothers from Lab 8, with all the variables measured. Use the lvlinitab outputr and the graphs provided on Moodle, to answer the following questions. Note that for Parts {a} through [m] [MDDDLE QUESTIONS 1 to 16}, you will use the part of the output labelled as Model 1 only. PART 1: ASSUMPTIONS Are the assumptions and conditions for a multiple regression model satisfied? For the independence assumption, explain in context. For the remaining assumptions, clearly refer to the appropriate graph(s). Independence Assumption: randomization condition 1 A v B SIs the linearity assumption met? Check the straight enough condition. since the normal probability plot shows a general linear pattern and the shows random scatter. This condition is 0 histogram Please answer all parts of the question. Is the equal varianoe assumption met? A Does the plot thicken? condition: met 1" since the us t plot shows thickening 0 Please answer all parts of the question. Is the Normal Population assumption met? Check both the Nearly;r Normal condition and the l[Clutlier condition. PART 2: OVERALL TEST Is there evidence that a linear relationship exists between birthweight and some combination of gestational period, height, starting weight, and end weight? Follow the steps below to answer this question. State the hypotheses in symbols only (you do not need to define any parameters). Do not worry about Greek letters or subscript. For example, B1 is acceptable to represent B1. 1 A B E PA Identify the test statistic and p-value from the Minitab output. Test statistic: F + p-value =Briefly assess the strength of the evidence. Select one: O a. Very strong evidence for Ha O b. Strong evidence for Ha O c. Moderate evidence for Ha O d. Weak evidence for Ha O e. No evidence for HaWhich of the following conclusions is the best answer? Select one: O a. We can conclude that there is a linear relationship between the average birthweight and some combination of gestational period, height, starting weight, and end weight for the population of all first-time mothers. O b. We have moderate evidence that there is a positive linear relationship between the average birthweight and some combination of gestational period, height, starting weight, and end weight for the population of all first-time mothers. O c. We have moderate evidence that there is a linear relationship between the average birthweight and some combination of gestational period, height, starting weight, and end weight for the population of all first-time mothers. O d. We have moderate evidence to conclude that there is a linear relationship between the average birthweight and some combination of gestational period, height, starting weight, and end weight for the population of all first-time mothers
Step by Step Solution
There are 3 Steps involved in it
Step: 1
Get Instant Access to Expert-Tailored Solutions
See step-by-step solutions with expert insights and AI powered tools for academic success
Step: 2
Step: 3
Ace Your Homework with AI
Get the answers you need in no time with our AI-driven, step-by-step assistance