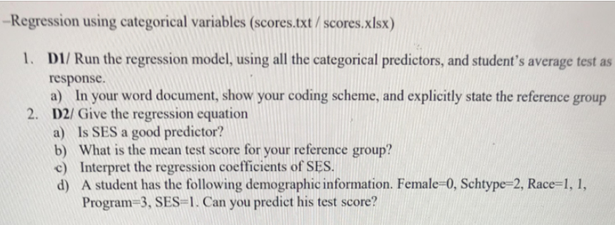
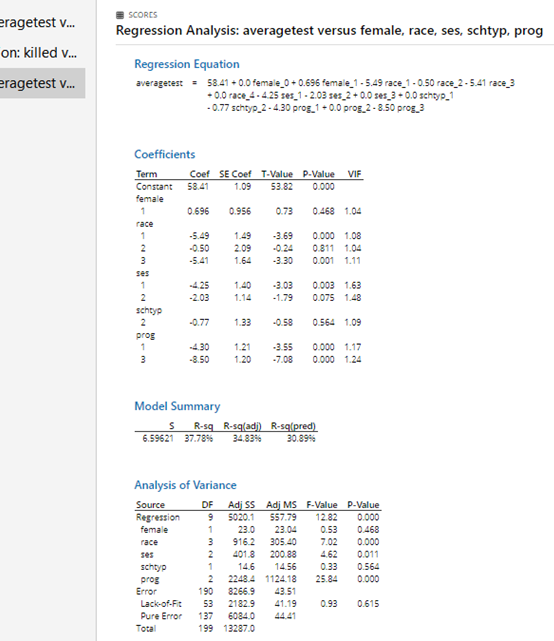
-Regression using categorical variables (scores.txt/scores.xlsx) 1. D1/ Run the regression model, using all the categorical predictors, and student's average test as response. a) In your word document, show your coding scheme, and explicitly state the reference group 2. D2/ Give the regression equation a) Is SES a good predictor? b) What is the mean test score for your reference group? c) Interpret the regression coefficients of SES. d) A student has the following demographic information. Female-0, Schtype=2, Race=1, 1, Program-3, SES=1. Can you predict his test score? SCORES eragetest ... on: killed ... eragetest ... Regression Analysis: averagetest versus female, race, ses, schtyp, prog Regression Equation averagetest = 53.41 +0.0 female_0+ 0.696 female_1-5.49 race_1 -0.50 race_2-5.41 race_3 +0.0 race_4.4.25 ses_1-2.03 ses_2 +0.0 ses_3.0.0 schys_1 - 0.77 schtyp_2-4.30 prog_1 +0.0 prog_2-8.50 prog_3 Coefficients VIF Coef SE Coef T-Value P-value 58.41 1.09 53.82 0.000 0.696 0.956 0.73 0.468 1.04 -3.69 -5.49 -0.50 -5.41 1.49 2.09 1.64 0.000 1.08 0.811 1.04 0.001 1.11 -3.30 Term Constant female 1 race 1 2 3 ses 1 2 schtyp 2 prog 1 3 -4.25 -2.03 1.40 1.14 -3.03 -1.79 0.003 1.63 0.075 1.48 -0.77 1.33 -0.58 0.564 1.09 430 1.21 1.20 3.55 -7.08 0.000 1.17 0.000 1.24 -8.50 Model Summary s R-sq R-sq(adj) R-sq[pred) 6.59621 37.78% 34.834 30.39% Analysis of Variance Source DF Adj ss Adj MS F-Value P-value Regression 9 S020.1 557.79 12.82 0.000 female 1 23.0 23.04 0.53 0.468 race 916.2 305.40 7.02 0.000 ses 2 401.8 200.88 0.011 schty 1 14,6 14.56 0.33 0.564 prog 2 2248.4 1124.18 25.84 0.000 Error 190 8266.9 43.51 Lack-of-Ft 53 21829 41.19 0.93 0.615 Pure Error 137 60840 44.41 Total 199 13287.0 -Regression using categorical variables (scores.txt/scores.xlsx) 1. D1/ Run the regression model, using all the categorical predictors, and student's average test as response. a) In your word document, show your coding scheme, and explicitly state the reference group 2. D2/ Give the regression equation a) Is SES a good predictor? b) What is the mean test score for your reference group? c) Interpret the regression coefficients of SES. d) A student has the following demographic information. Female-0, Schtype=2, Race=1, 1, Program-3, SES=1. Can you predict his test score? SCORES eragetest ... on: killed ... eragetest ... Regression Analysis: averagetest versus female, race, ses, schtyp, prog Regression Equation averagetest = 53.41 +0.0 female_0+ 0.696 female_1-5.49 race_1 -0.50 race_2-5.41 race_3 +0.0 race_4.4.25 ses_1-2.03 ses_2 +0.0 ses_3.0.0 schys_1 - 0.77 schtyp_2-4.30 prog_1 +0.0 prog_2-8.50 prog_3 Coefficients VIF Coef SE Coef T-Value P-value 58.41 1.09 53.82 0.000 0.696 0.956 0.73 0.468 1.04 -3.69 -5.49 -0.50 -5.41 1.49 2.09 1.64 0.000 1.08 0.811 1.04 0.001 1.11 -3.30 Term Constant female 1 race 1 2 3 ses 1 2 schtyp 2 prog 1 3 -4.25 -2.03 1.40 1.14 -3.03 -1.79 0.003 1.63 0.075 1.48 -0.77 1.33 -0.58 0.564 1.09 430 1.21 1.20 3.55 -7.08 0.000 1.17 0.000 1.24 -8.50 Model Summary s R-sq R-sq(adj) R-sq[pred) 6.59621 37.78% 34.834 30.39% Analysis of Variance Source DF Adj ss Adj MS F-Value P-value Regression 9 S020.1 557.79 12.82 0.000 female 1 23.0 23.04 0.53 0.468 race 916.2 305.40 7.02 0.000 ses 2 401.8 200.88 0.011 schty 1 14,6 14.56 0.33 0.564 prog 2 2248.4 1124.18 25.84 0.000 Error 190 8266.9 43.51 Lack-of-Ft 53 21829 41.19 0.93 0.615 Pure Error 137 60840 44.41 Total 199 13287.0