

Answered step by step
Verified Expert Solution
Question
1 Approved Answer
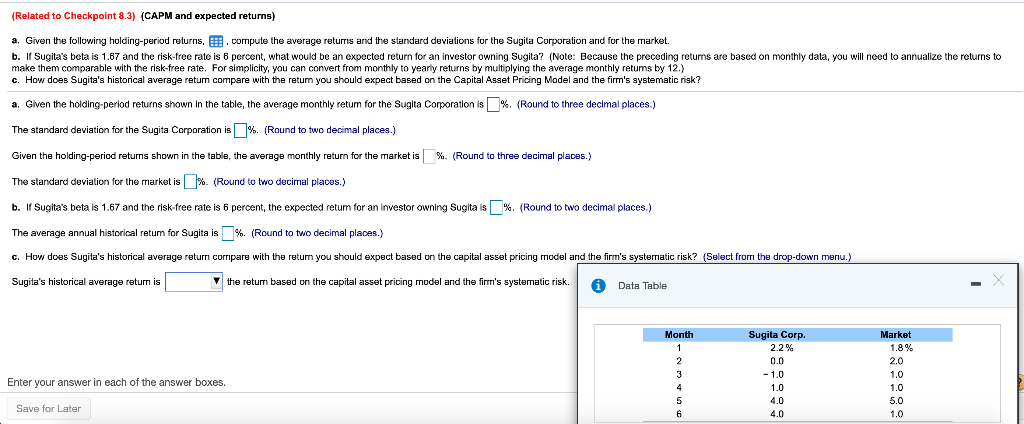
(Related to Checkpoint 8.3) (CAPM and expected returns) a. Given the following holding-period returns, compute the average returris and the standard deviations for the Sugita
Step by Step Solution
There are 3 Steps involved in it
Step: 1

Get Instant Access to Expert-Tailored Solutions
See step-by-step solutions with expert insights and AI powered tools for academic success
Step: 2

Step: 3
Ace Your Homework with AI
Get the answers you need in no time with our AI-driven, step-by-step assistance
Get Started
Sustainable Value Creation An Inevitable Challenge To Business And Society
Authors: Teun Wolters
1st Edition
3031353501, 978-3031353505