

Answered step by step
Verified Expert Solution
Question
1 Approved Answer
Relationship between tax revenues, deadweight loss, and elasticity Complete the following table with the tax revenve collected and dendweight loss caused by each of the
Relationship between tax revenues, deadweight loss, and elasticity 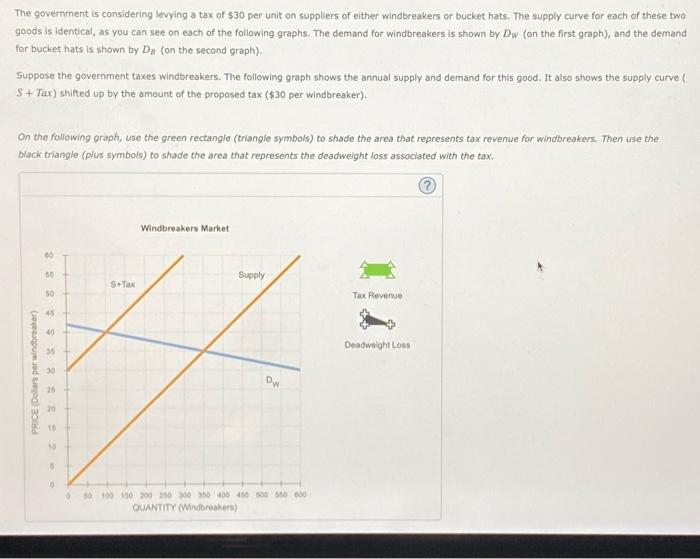
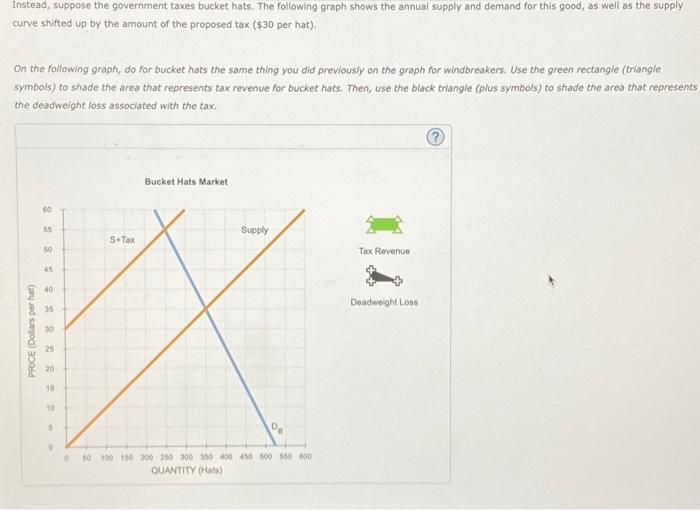
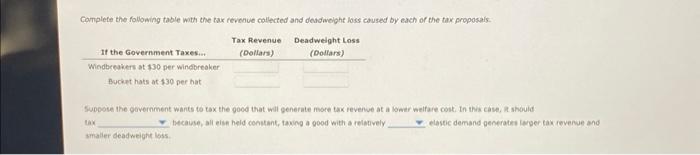
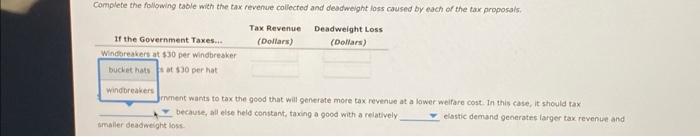
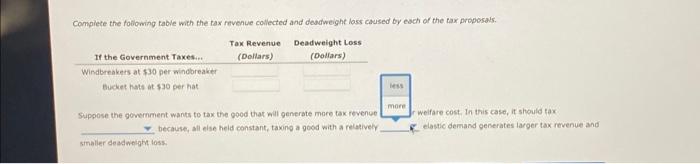
Complete the following table with the tax revenve collected and dendweight loss caused by each of the tax proposals. Supose the government wants to tax the good that wal generate more tax revenwe at a lower weifare cost. In this case, at should tax because, all eish held constant, taxing a good with a relatively elastic demand generates ievoer tav revenue and smalier deadweloht loss. Complete the following table with the tax revenue collected and deadweight loss caused by esch of the tax proposals. Suppose the gowemment wants to tax the good that will generate more tax revence because, all else held constant, taxing a good with a relatively weifare cost, in this case, it should tax. elastic demand generates larger tax revenue and sinaller dead weight loss. Innent wants to tax the good that will generate more tox revence at a lower weifare cost. In this case, it shoula tax because, all else held constant, taxing a good with a relatively imaller deadwelght ioss. elostic demand generntre farger tax revehue and The government is considering levying a tax of $30 per unit on suppliers of either windbreakers or bucket hats. The supply curve for each of these two goods is identical, as you can see on each of the following graphs. The demand for windbreakers is shown by DW (on the first graph), and the demand for bucket hats is shown by DB (on the second graph). Suppose the government taxes windbreakers. The following graph shows the annual supply and demand for this good. It also shows the supply curve \& S+Tax) shifted up by the amount of the proposed tax ( $30 per windbreaker). On the following graph, use the green rectangle (triangle symbols) to shade the area that represents tax revenue for windbreakers. Then use the black triangle (plus symbols) to shade the area that represents the deadweight loss associated with the tax. Instead, suppose the government taxes bucket hats. The following graph shows the annual supply and demand for this good, as well as the supply curve shifted up by the amount of the proposed tax ( $30 per hat). On the following graph, do for bucket hats the same thing you did previously on the graph for windbreakers. Use the green rectangle (triangle symbols) to shade the area that represents tax revenue for bucket hats. Then, use the black triangle (plus symbols) to shade the area that represent the deadweight loss associated with the tax Step by Step Solution
There are 3 Steps involved in it
Step: 1

Get Instant Access to Expert-Tailored Solutions
See step-by-step solutions with expert insights and AI powered tools for academic success
Step: 2

Step: 3
Ace Your Homework with AI
Get the answers you need in no time with our AI-driven, step-by-step assistance
Get Started
Forensics Audits And Dreaming
Authors: Helgard Petrus - Coetser
1st Edition
1664260250, 978-1664260252