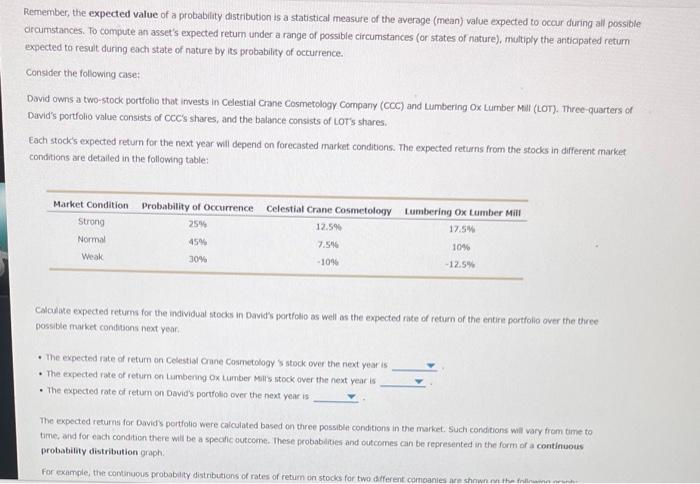
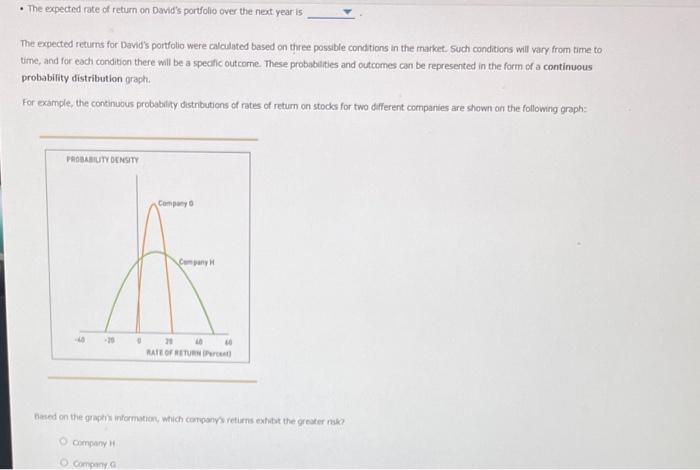
Remember, the expected value of a probability distribution is a statistical measure of the averoge (mean) value expected to occur during all possible orcumstances. To compute an asset's expected retum under a range of possible circumstances (or states of nature), multiply the antiopated return expected to result during each state of nature by its probability of octurrence. Conslder the following case: David owns a two-stock portfolio that invests in Celestial Crane Cosmetology Company (CoC) and Lumbering Ox Lumber Mill (LOT). Three-quarters of Divid's portfolio value consists of ccC's shares, and the balance consists of Lot's shares. Each stock's expected return for the next year will depend on forecasted market conditions. The expected returns from the stocks in different market conditions are detailed in the following table: Calailie expected returns for the individual stocks in Davids portfolio as well as the expected rate of return of the entire partfollo over the three possible market condivons next year. - The expected rate of return on Colestial Crane Cosmetology ss stock over the next year is - The expected rate of retum on Lumbenng ox tumber Mills stock over the next year is - The expected rate of retum on David's pertfolio over the next year is The expected returns for Davids portfolio were caiculated based on three possible conditions in the market. Such conditions will vary firm time to time, and for each condition there will be a specilc outcome. These probabdices and cutcomes can be represented in the form of a continuous probability distribution graph: For example, the continuous probsbility distributions of rates of retum on stocks for two alferent combanies are shnwn mu the follhuma - The expected rate of return on David's portfolio over the next year is The expected returns for David's portfolio were caladated based on three possible condtions in the market. Such conditions will vary from time to time, and for each condition there will be a spectic outcorne. These probablities and outcomes can be represented in the form of a continuous probability distribution graph. For example, the condinuous probability distributions of rates of return on stocks for two diferent companles are shown on the following graph: batied on the graphy) information, which company? retirns exhibt the greater nako