Answered step by step
Verified Expert Solution
Question
1 Approved Answer
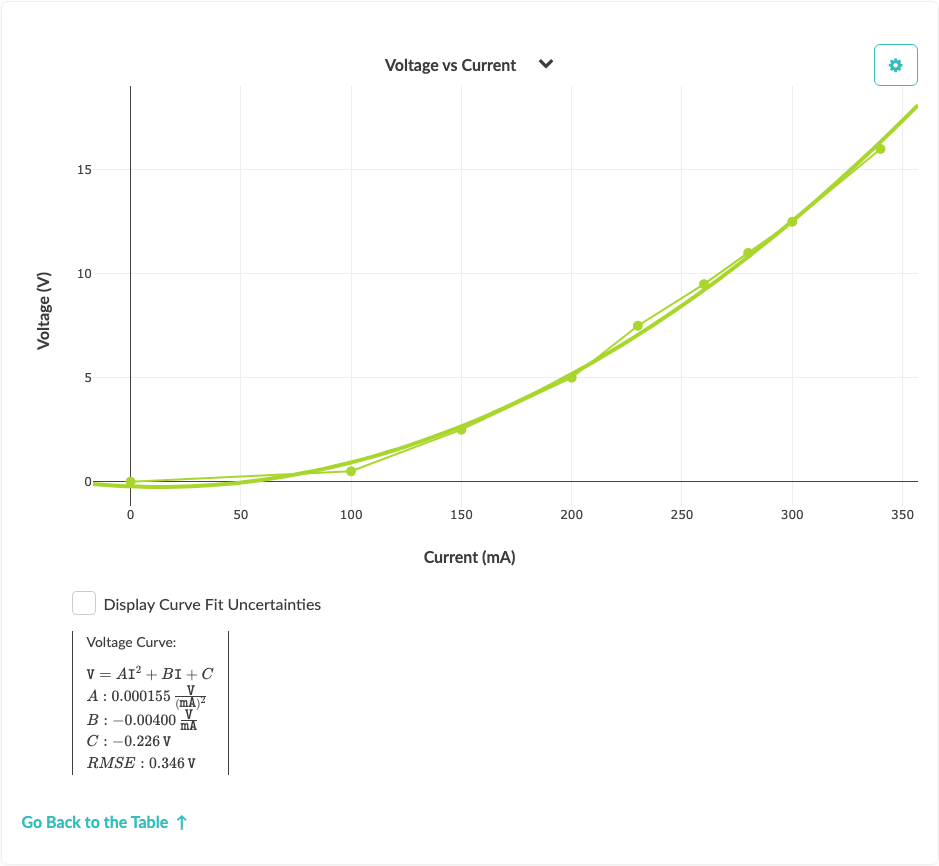
Repeat the process using this circuit with an incandescent lightbulb. Use this data table and graph to collect and analyze your data. 1. Repeat the
Repeat the process using this circuit with an incandescent lightbulb. Use this data table and graph to collect and analyze your data.
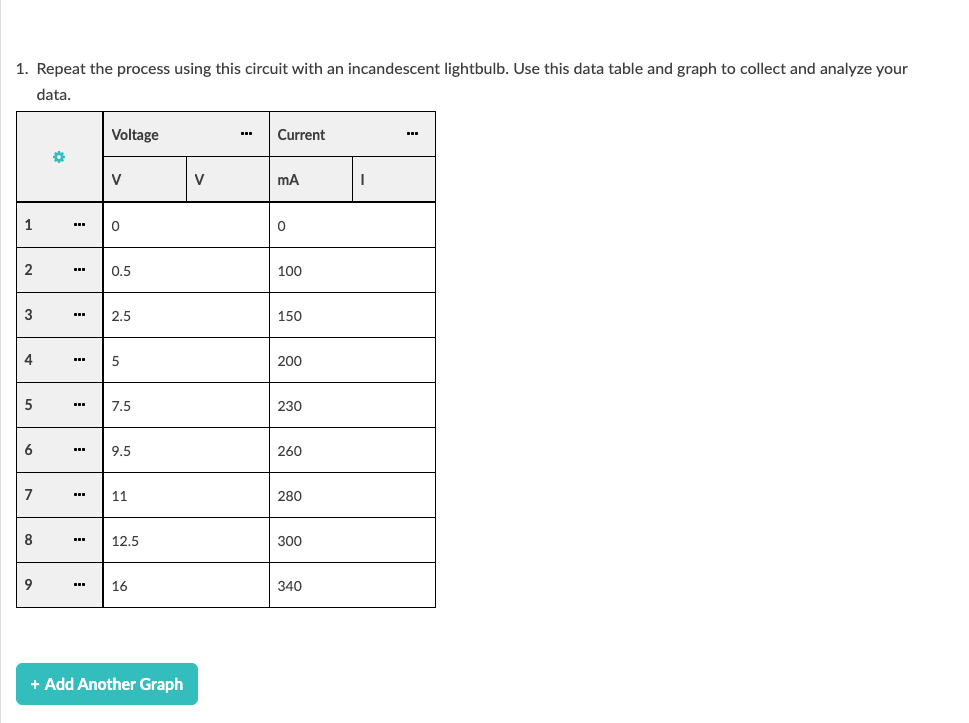
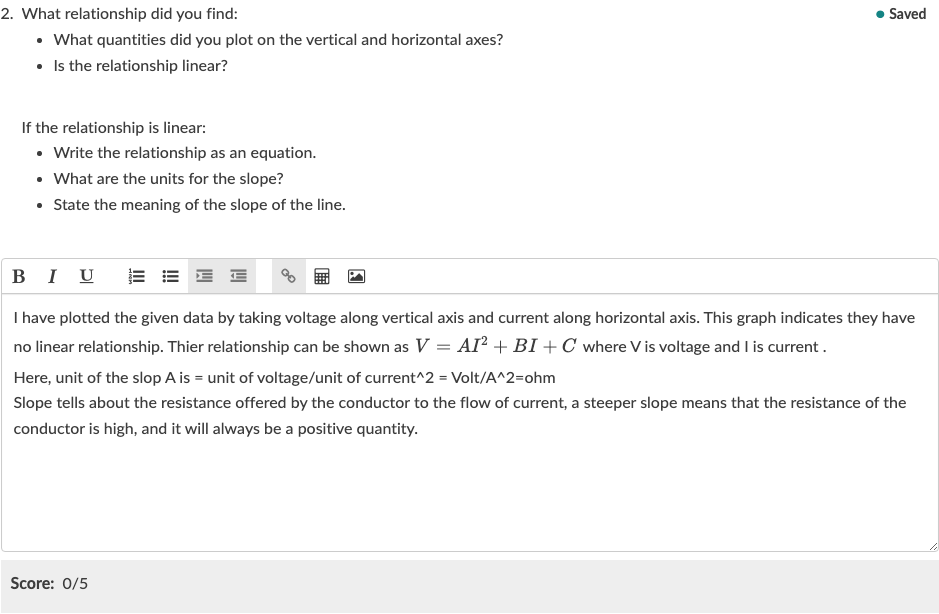
1. Repeat the process using this circuit with an incandescent lightbulb. Use this data table and graph to collect and analyze your data. Voltage vs Current 15 10 Voltage (V) 5 50 100 150 200 250 300 350 Current (mA) Display Curve Fit Uncertainties Voltage Curve: V = A12 + BI + C A : 0.000155 (mA)z B : -0.00400 mA C: -0.226 V RMSE : 0.346 V Go Back to the Table2. What relationship did you find: a Saved . What quantities did you plot on the vertical and horizontal axes? . Is the relationship linear? If the relationship is linear: - Write the relationship as an equation. a What are the units for the slope? . State the meaning of the slope of the line. BI_,_ C! ii iii II'II EQoEIZI l have plotted the given data by taking voltage along vertical axis and current along horizontal axis. This graph indicates they have no linear relationship. Thier relationship can be shown as V = Al: + BI + C whereVis voltage and | is current. Here. unit of the slop A is = unit ofvoltagelunit of current"2 = VoltiA2=ohm Slope tells about the resistance offered by the conductor to the flow of current, a steeper slope means that the resistance of the conductor is high, and it will always be a positive quantity. Score: 05Step by Step Solution
There are 3 Steps involved in it
Step: 1
Get Instant Access to Expert-Tailored Solutions
See step-by-step solutions with expert insights and AI powered tools for academic success
Step: 2
Step: 3
Ace Your Homework with AI
Get the answers you need in no time with our AI-driven, step-by-step assistance
Get Started